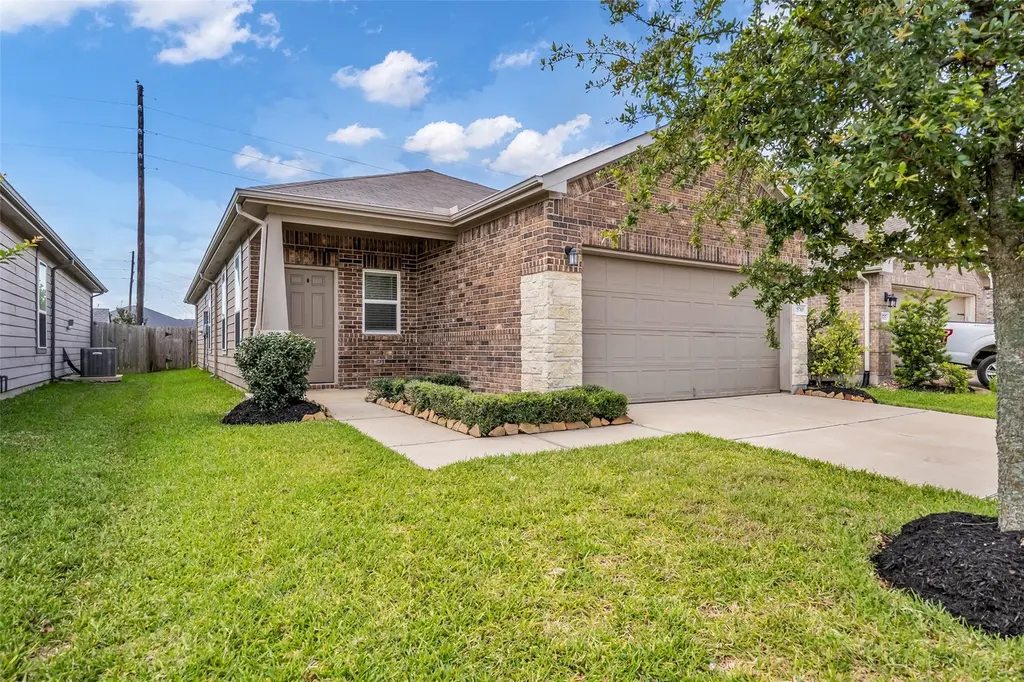
25703 Bottlebrush Sedge St · Houston, TX
Flood risk 5/10 · Moderate
- FEMA flood zone
- X (unshaded)
- Chance of flooding over 30 yrs
- 0.49%
- Est. flood insurance / yr
- $507 – $1,088
Fire risk 3/10 · Minor
- Est. fire insurance / yr
- $1,222 – $2,270
Heat risk 9/10 · Severe
- Hot days now (above 111°F)
- 7 days/yr
- Hot days in 30 yrs
- 23 days/yr
Wind risk 9/10 · Severe
- Chance of severe wind over 30 yrs
- 99.0%
Air-quality risk 2/10 · Minimal
- Unhealthy air days now
- 1 days/yr
- Unhealthy air days in 30 yrs
- 1 days/yr
Risk factors via First Street. Map © Google.
Why this score? — see what drove the D- grade
The composite is a weighted blend of 9 inputs, each scored 0–100. Each bar is that input's sub-score; the figure is the points it added to the 100-point composite (weight × sub-score).
- Cash flow +9.5/30.0
- ARV discount +7.7/15.0
- Schools +5.7/10.0
- 1% rule +4.4/10.0
- Condition / age +4.0/5.0
- Livability +3.7/5.0
- DSCR +2.7/10.0
- Rent growth +2.3/5.0
- Appreciation +0.0/10.0
$275,000
🖨 Deal sheet 📄 Offer letter ✓ Due diligence
Listing remarks
Welcome to Bottlebrush Sedge a beautiful 1-story home with 3 bedrooms, 2 full bath and a private study. As soon as you walk in, you will notice the high ceilings, sun filled living room and the large kitchen and breakfast bar. The kitchen is outfitted with stainless steel appliances, an island, upgraded countertops, raised bartop and plenty of cabinet storage. The open concept makes for perfect entertaining and functional living. You can relax in the comfort of your owner's suite and owner's bath that features double vanity sinks, walk-in shower and soaking tub. Love the outdoors on your patio, enjoy playing in the fully fenced backyard. Come visit us and fall in love with your dream home.
Key facts
- 4,904 sq ft lot
- 2 garage spots
- Built 2019
Property features AI
Finance
- Other: Seller disclosure available
- HOA & community: Signature Association with an annual fee of $620; Curbs in the community
Exterior
- Parking: Attached garage with 2 spaces; Driveway; Garage door opener
- Utilities: Public water; Public sewer
- Home design: Residential property; Built in 2019; Slab foundation; Composition roof
- Construction: Brick and cement siding construction
- Exterior features: Deck; Patio; Porch; Fully fenced backyard; Private yard; Subdivision setting; Concrete road access
Interior
- Kitchen: Dishwasher; Electric oven; Free-standing range; Gas cooktop; Disposal; Microwave; Refrigerator
- Bedrooms: 4 total rooms (includes bedrooms and living areas)
- Flooring: Carpet; Engineered hardwood
- Bathrooms: 2 full bathrooms
- Heating & cooling: Central heating (gas); Central air (electric)
- Interior features: Breakfast bar; Double vanity; High ceilings; Kitchen island; Kitchen/family room combo; Pantry; Soaking tub; Separate shower; Tub/shower; Window treatments; Kitchen/dining combo
- Laundry & utility: Washer hookup; Electric dryer hookup; Washer; Dryer
Neighborhood map
What this means for you Summary
Snapshot
- This is a 3-bed/2.0-bath single-family listed at $275k. Condition is rated good.
Deal economics
- At list price, monthly cash flow is $-192 ($-2k/yr) — negative.
- To cash-flow at today's rent, offer at most $241k (12.3% below list).
- To meet the 1% rule (rent ≥ 1% of price), the offer needs to be $257k (6.4% below list).
- Recommended offer: $241k (12.3% below list) — sets the bar for cash-flow.
- Cap rate 5.5% vs local median 3.2% in Houston — top-decile yield for the area; either an underpriced asset or a hidden risk that comps aren't pricing in. Stress-test before assuming the spread holds.
Location & tenants
- Location reads 74/100 on livability (#184 in TX, #4,771 nationally) — a middle-class / working-renter tenant base. Strengths: amenities A+, cost of living A+, housing A+; Watch: schools D, crime F.
- Katy ISD (suburban): math 61% / reading 63% proficiency, ranked #29 of 826 in TX (top 4%) — acceptable for families but not a draw, mixed tenant base, ~2y average lease.
- Market conditions: Rents soft (-0.8%/yr); 2696 active listings in the ZIP; 2 comparable units currently listed for rent nearby; high-income renter base; 29,883 units permitted in Harris County in 2024 (8,621 in 5+ unit buildings).
Forward outlook
- Local home prices are declining (-3.0%/yr); year-one equity from $2k of loan paydown is wiped out by about $8k of value loss. Plan a longer hold.
- Harris County population projected at +47% by 2050 — long-run rental-demand tailwind backs the buy-and-hold thesis.
Negotiation context
- It's been on market 43 days — a 3% lower offer ($267k) is reasonable based on typical stale-listing flexibility.
Risks & watch-outs
- Watch-outs: property tax is 2.7% of price.
- Climate carrying-cost: moderate flood risk; severe wind risk, 99% chance of damaging wind over 30y; extreme-heat days projected 7→23/yr by 2055 (HVAC capex compounding) — expect insurance premiums to compound above CPI over the hold.
Questions for the listing agent
- What do current leases actually rent for vs. the listed asking? Can we see a recent rent roll and the last 12 months of T-12 income?
- It's been on market 43 days. Have you received any prior offers? Is the seller open to a 12% concession, seller financing, or rate buy-down credit?
- Property tax is high relative to price — has the assessment been appealed recently, and will the sale trigger a re-assessment?
- What does the HOA fee cover, when was the last increase, and are there any pending special assessments or reserve-fund shortfalls?
- Is there a deadline driving the sale (1031 exchange, divorce, estate, relocation)? That informs how much negotiation room exists.
- Schools are D-rated, which usually means shorter tenancies and higher turnover. Who's the typical renter profile here, and what's been the actual vacancy rate?
- Crime grade is F in this area — have there been break-ins, vandalism, or insurance claims at this property in the last 3 years? What carrier currently insures it and at what premium?
- The area grade is low — what's the realistic commute time and amenity access for the typical tenant pool here? Any planned neighborhood developments (good or bad) we should know about?
- What's the average days-on-market for RENTAL listings here right now (not sales)? A rising rental-DOM trend means longer vacancies and softer asking-rent achievability than the comps imply.
- What's the recent tenant-quality profile in this submarket — average credit score on applications, eviction rate, late-payment / NSF rate, and stable-employment percentage? A property-management company in the area should have these aggregated.
- How much new for-sale + rental construction is in the pipeline within 1–3 miles? Heavy new supply typically softens prices + rents 12–24 months out; constrained supply supports both.
Investment metrics
- 1% rule
- 0.94% ✗
- Cap rate
- 5.45%
- Cash-on-cash
- -2.99%
- DSCR
- 0.87
- GRM
- 8.9
CMA / ARV
- ARV (median comp)
- $276,027
- List price
- $275,000
- Delta
- -0.37%
- Verdict
- FAIR
- Comps
- 20 within 1.0 mi
Show comp detail 12 sales within ~0.75 mi
| Address | Dist | Beds/Ba | Sqft | Sold | Price | $/sf | Match |
|---|---|---|---|---|---|---|---|
| 25734 Bottlebrush Sedge St | 0.07mi | 3/2.0 | 1,565 (+1%) | 3mo | $280,000 | $179 | 93 |
| 5722 Savanna Pasture Rd | 0.18mi | 3/2.0 | 1,560 (+1%) | 1mo | $260,000 | $167 | 90 |
| 5738 Savanna Pasture Rd | 0.21mi | 3/2.0 | 1,540 (-0%) | 3mo | $259,990 | $169 | 87 |
| 5603 Savanna Pasture Rd | 0.11mi | 4/2.0 (+1) | 1,558 (+1%) | 4mo | $269,786 | $173 | 85 |
| 25519 Pitchfork Ranch Pl | 0.42mi | 4/2.0 (+1) | 1,569 (+1%) | 1mo | $265,000 | $169 | 72 |
| 25554 Pitchfork Ranch Pl | 0.43mi | 4/2.0 (+1) | 1,569 (+1%) | 2mo | $260,000 | $166 | 71 |
| 25535 Pitchfork Ranch Pl | 0.41mi | 3/2.0 | 1,480 (-4%) | 4mo | $259,999 | $176 | 70 |
| 5935 Waggoner Ranch Trl | 0.42mi | 3/2.0 | 1,496 (-3%) | 7mo | $280,000 | $187 | 69 |
| 25406 Katy Gate Ln | 0.52mi | 3/2.0 | 1,505 (-3%) | 6mo | $275,000 | $183 | 66 |
| 25919 Llano Knoll Ln | 0.44mi | 3/2.0 | 1,499 (-3%) | 9mo | $269,900 | $180 | 66 |
| 25514 Reign Wayman Ct | 0.60mi | 3/2.0 | 1,592 (+3%) | 2mo | $280,000 | $176 | 66 |
| 5023 Yellow Rays Trl | 0.44mi | 4/2.0 (+1) | 1,710 (+10%) | 9mo | $299,900 | $175 | 50 |
Match score weights: distance 35% · size 25% · config 20% · recency 20%. Top-matched comps best support the ARV.
Projected returns pro-forma
-3.0% appreciation · 0.0% rent growth · sell at horizon
- IRR
- -25.3%
- Equity multiple
- 0.17×
- Total profit
- $-64,103
- Equity at exit
- $41,003
- IRR
- -38.1%
- Equity multiple
- -0.30×
- Total profit
- $-99,753
- Equity at exit
- $23,777
Cash invested: $77,000 (down + closing). Projections, not guarantees.
Landlord ↔ Tenant lean methodology
- Overall (STATE)
- 87 Strongly Landlord-Friendly
- State Texas
- 87 Strongly Landlord-Friendly · R+5
- County
- — inherits STATE
- City
- — inherits STATE
ZIP-level market 77493
- Rents YoY
- -0.8%
- Active inventory
- 2696
- Price-to-rent
- 8.9×
Monthly cashflow live
- Estimated rent
- $2,573 medium interval (Pro) →
- Mortgage (P&I)
- −$1,442
- Tax from tax record
- −$616 /mo · $7,395/yr
- Insurance
- −$115
- HOA
- −$52
- Vacancy / Maint / Mgmt
- −$540
- Net cashflow
- $-192
Break-even live
UW: 25.0% down · 7.5% · 30yr · 1.5% tax · 5.0% vac · 8.0% maint · 8.0% mgmt
Financing live
Cash to close
- Down payment
- $68,750
- Closing costs
- $8,250
- Reserves months
- —
- Total cash needed
- —
Loan-product check · same deal, 3 products live
Conventional
25% down · 7.5% · 30yr
- Down + closing
- —
- Monthly P&I
- —
- Monthly cashflow
- —
- DSCR
- —
- Eligible?
- —
Personal DTI + credit; lowest rate.
DSCR
20% down · 8.5% · 30yr
- Down + closing
- —
- Monthly P&I
- —
- Monthly cashflow
- —
- DSCR
- —
- Eligible?
- —
No personal income docs; deal must DSCR.
Hard money
10% down · 12.0% · 12mo
- Down + closing
- —
- Monthly P&I
- —
- Monthly cashflow
- —
- DSCR
- —
- Eligible?
- —
Short-term bridge; refi at stabilization.
Rent comps 2 comps
| Address | Beds | Baths | Sqft | Rent | $/sqft | DOM | Units | Dist |
|---|---|---|---|---|---|---|---|---|
| 6758 Sunset Velvet Dr Katy, TX | 3.0 | 2.0 | 1580 | $2,350 | $1.49 | 43d | 1 | 1.36mi |
| 27064 Beach Ball Dr Katy, TX | 3.0–4.0 | 2.5–3.5 | 1705 | $2,406 | $1.41 | 1d | 25 | 1.50mi |
HOA detail
- Monthly dues
- $52 · $624/yr
Listing history 14 events
-
2026-06-18days on market $275,000 Active 43 DOM
-
2026-06-17days on market $275,000 Active 42 DOM
-
2026-06-16days on market $275,000 Active 41 DOM
-
2026-06-15days on market $275,000 Active 40 DOM
-
2026-06-13days on market $275,000 Active 38 DOM
-
2026-06-09days on market $275,000 Active 34 DOM
-
2026-06-08days on market $275,000 Active 33 DOM
-
2026-06-07days on market $275,000 Active 32 DOM
-
2026-06-04days on market $275,000 Active 29 DOM
-
2026-06-03days on market $275,000 Active 28 DOM
-
2026-06-02days on market $275,000 Active 27 DOM
-
2026-06-01days on market $275,000 Active 26 DOM
-
2026-05-31days on market $275,000 Active 25 DOM
-
2026-05-06$275,000 Active 740-char remark
ⓘ Source: listings_history table (triggers on properties + properties_extension) + one-shot
backfill from property_details.listing_events for pre-trigger history.
Tax reassessment forecast TX · Resets to sale price
- Current annual tax
- $7,395 · $616/mo
- Projected year-2 tax
- $7,395 · $616/mo
- Expected delta
- $0/yr ($0/mo · 0.0%)
ⓘ Screening estimate from a state-policy table — verify with the county assessor before closing.
Climate risk First Street
- Flood 5/10 Major FEMA zone X (unshaded) · 49% chance over 30 yrs
- Wildfire 3/10 Moderate
- Heat 9/10 Extreme 7 d/yr ≥111°F today · 23 d/yr by 30 yrs out
- Wind 9/10 Extreme 99% chance of damaging wind over 30 yrs
- Air quality 2/10 Low 1 unhealthy d/yr today · 1 by 30 yrs out
Nearby sold comps map
Loading sold comps map…
Walkable amenities ~0.75 mi
Loading nearby amenities…
Taxation est. · year 1
- Rental income
- $30,879
- − Mortgage interest
- −$15,404
- − Property taxes
- −$7,395
- − Insurance
- −$1,375
- − Repairs & maintenance
- −$2,470
- − Management
- −$2,470
- − HOA
- −$624
- − Depreciation
- −$8,000
- Taxable loss
- −$6,861
- Est. tax savings @ 24.0%
- +$1,647
- After-tax cash flow
- $-659/yr
For passive investors: Depreciation is non-cash, so a rental often shows a tax loss while cash-flowing — sheltering income. Rental losses are passive: they offset passive income freely, and up to $25,000/yr can offset ordinary (W-2) income if you actively participate and your MAGI is under $100k (phasing out to $0 by $150k); unused losses carry forward. On sale, claimed depreciation is recaptured at up to 25%, and gains may owe capital-gains tax (a 1031 exchange can defer both). Figures are a year-1 estimate at your 24.0% rate — not tax advice; consult a CPA.
Condition & rehab AI · 12 photos
This single-family home is in good condition with a good condition score of 80. It has a good kitchen, bathrooms, exterior, flooring, and interior walls/paint. The home is move-in ready with minimal repairs and maintenance needed. The highest-ROI updates that would raise its value are painting the exterior brick and landscaping improvements.
Value-add opportunities
- Both Painting the exterior brick — Enhances curb appeal and can increase both resale and rental value
- Both Landscaping improvements — Enhances curb appeal and can increase both resale and rental value
Renovation cost estimate screening
Value-add ROI direction
- Both Painting the exterior brick — Enhances curb appeal and can increase both resale and rental value ↑
- Both Landscaping improvements — Enhances curb appeal and can increase both resale and rental value ↑
ⓘ Cost ranges are severity-bucket heuristics (US national rule-of-thumb). Get contractor quotes + a written scope before underwriting a rehab budget.
Schools (NCES district)
- District
- Katy ISD
- NCES district ID
- 4825170
- Math proficiency
- 61% ▼ -7.00%
- Reading proficiency
- 63% ▼ -3.00%
- Median HH income
- $90,312
- Composite
- 56.59/100
- National rank
- #1146
- State rank
- #29 of 826 in TX
Livability — Houston
- Score
- 74/100
- State rank
- #184
- US rank
- #4771
Category grades
Schools grade is shown separately in the Schools card above.
Census & demographics
- County
- Harris County · 4,702,590 people
- City population
- 3,226,434
- Metro
- Houston-The Woodlands-Sugar Land, TX
- Population (ZIP)
- 71,484
- Household income
- $118,464
- Rent vs Own
- Severe rent burden
- 913.0
Population outlook (Harris County) Hauer SSP2
- Today (2025)
- 5,571,493 people
- By 2030
- 6,089,821 · +9.3%
- By 2040
- 7,142,806 · +28.2%
- By 2050
- 8,185,864 · +46.9%
- By 2075
- 10,574,329 · +89.8%
- By 2100
- 12,109,958 · +117.4%
Race, ethnicity, and origin ACS 2023
- Neighborhood character
- Highly diverse neighborhood (Simpson 0.73)
- Race & ethnicity
- White 36% Hispanic / Latino 33% Two or more races 16% Black 15% Asian 12%
- Hispanic origin (detail)
- Mexican 20%
- Common ancestry
- Lithuanian 2% Slovak 1% Italian 1%
- Foreign-born
- 21% · Canada, Vietnam, Jamaica
- Languages at home
- 64% English-only · Spanish 22% Vietnamese 5% French/Haitian/Cajun 4%
Political lean MEDSL · Harris
- 2024 margin
- Lean D (+5.5) · D 52.0% · R 46.4% · Other 1.6%
- 2008→2024 swing
- +3.9pp toward D · 2008: 1.6pp · 2024: 5.5pp
- All cycles
- 2024: D+5.5 2020: D+13.3 2016: D+12.4 2012: D+0.1 2008: D+1.6
Not yet ingested
- Civics
- —
Market trends
- HPI YoY
- ▼ -140.65%
- Current HPI
- 233.1683
- Rent YoY
- ▼ -0.80%
- Metro
- Houston-The Woodlands-Sugar Land, TX
- State GDP YoY
- ▲ 3.95%
- F500 in state
- 110
Industry mix (Fortune 500 HQ in TX)
| Industry | F500 HQs | Revenue |
|---|---|---|
| Energy | 16 | $1,198B |
|
||
| Technology | 5 | $198B |
|
||
| Engineering / Construction | 4 | $72B |
|
||
| Energy Services | 3 | $60B |
|
||
| Utilities | 3 | $41B |
|
||
| Healthcare | 2 | $330B |
|
||
Price history
1 event — show timeline
- 2026-05-06 Listed $275,000 HARMLS
Property tax history
+2.0%/yrLatest (2025): $7,395 · -0.0% YoY. Source: county tax records.
Cash-flow waterfall
monthlySold comps — $/sqft
last 12 mo · ≤1 miLoading sold comps…