 🏗️ New Construction
416 Sunrise Ranch Dr · Conroe, TX
Flood risk No data
- FEMA flood zone
- —
- Chance of flooding over 30 yrs
- —
- Est. flood insurance / yr
- —
Fire risk No data
- Est. fire insurance / yr
- —
Heat risk No data
- Hot days now (above threshold)
- —
- Hot days in 30 yrs
- —
Wind risk No data
- Chance of severe wind over 30 yrs
- —
Air-quality risk No data
- Unhealthy air days now
- —
- Unhealthy air days in 30 yrs
- —
Risk factors via First Street. Map © Google.
Why this score? — see what drove the D grade
The composite is a weighted blend of 9 inputs, each scored 0–100. Each bar is that input's sub-score; the figure is the points it added to the 100-point composite (weight × sub-score).
- Cash flow +13.3/30.0
- ARV discount +7.5/15.0
- Schools +5.4/10.0
- DSCR +4.0/10.0
- Livability +3.7/5.0
- 1% rule +3.2/10.0
- Rent growth +2.6/5.0
- Condition / age +2.5/5.0
- Appreciation +0.0/10.0
$239,790
🖨 Deal sheet 📄 Offer letter ✓ Due diligence
Listing remarks
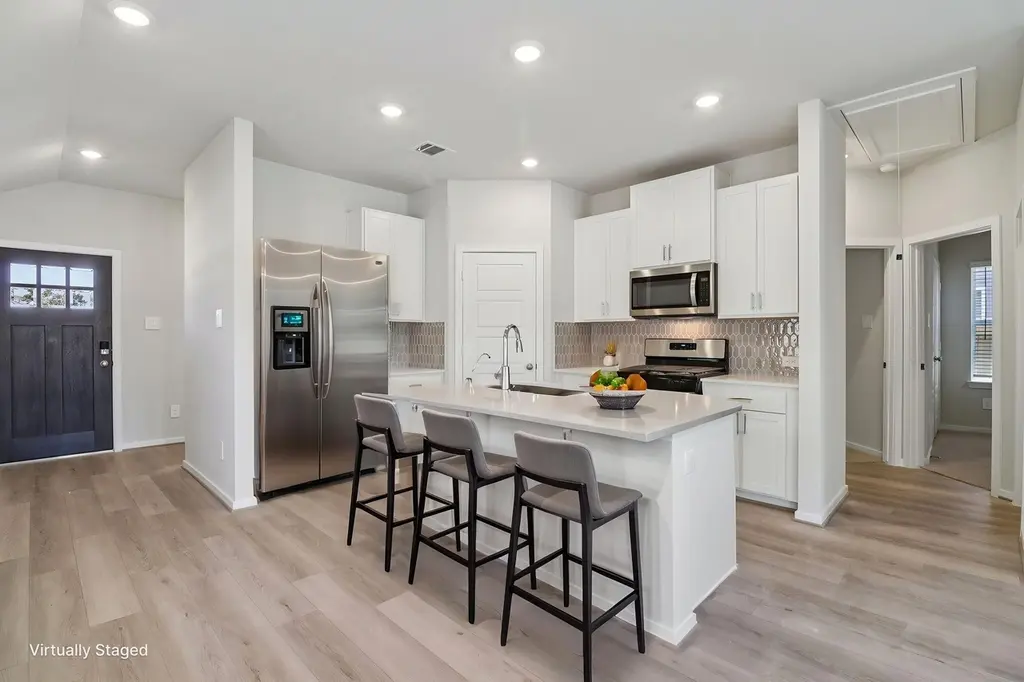
Brand new, energy-efficient home available NOW! Tucked at the rear of the home, the Cascade's private primary suite boasts dual sinks and a large walk-in closet for ample storage. In the kitchen, a large island and spacious pantry maximize convenience. Located in Conroe off SH-105, Pine Lake Cove is just minutes from Lake Conroe. The community is zoned in the sought-after Montgomery ISD and is near parks and entertainment. Groundbreaking energy efficiency is also built seamlessly into every home in this community so you can spend less on utility bills and more on the things that matter most. * Each of our homes is built with innovative, energy-efficient features designed to help you enjoy
Key facts
- Spacious pantry
- Large island
- Large walk-in closet
Tags
Property features AI
Finance
- Financial info: Lease not considered
- HOA & community: Pine Lake Cove HOA; HOA dues $1,200 annually; Community pool
Exterior
- Parking: Attached 2-car garage; Driveway; Garage with door opener
- Security: Prewired for security; Smoke detectors
- Utilities: Public water; Public sewer
- Home design: Residential property; New construction; Single-story (entry level: first floor); Facing information not provided
- Construction: Built in 2026; Brick and cement siding construction; Composition roof; Slab foundation
- Exterior features: Covered patio; Fully fenced yard; Porch; Patio; Deck
Interior
- Kitchen: Dishwasher; Gas cooktop; Gas oven; Microwave; Disposal; ENERGY STAR qualified appliances; Tankless water heater
- Bedrooms: 3 total bedrooms; Primary bedroom on the first floor
- Flooring: Plank flooring; Tile; Vinyl
- Bathrooms: 2 full bathrooms
- Heating & cooling: Heat pump heating; Central air conditioning; Electric cooling; Zoned cooling
- Interior features: Double vanity; Kitchen island; Kitchen/family room combo; Pantry; Stone counters; Kitchen/dining combo; Programmable thermostat; Low emissivity windows
- Laundry & utility: Washer hookup; Electric dryer hookup
Neighborhood map
What this means for you Summary
Snapshot
- This is a 3-bed/2.0-bath land listed at $240k.
Deal economics
- At list price, monthly cash flow is $2 ($20/yr) — positive.
- The deal already cash-flows at list — no discount required.
- To meet the 1% rule (rent ≥ 1% of price), the offer needs to be $203k (15.4% below list).
- Recommended offer: $203k (15.4% below list) — sets the bar for 1% rule.
- Cap rate 6.3% vs local median 3.1% in Conroe — top-decile yield for the area; either an underpriced asset or a hidden risk that comps aren't pricing in. Stress-test before assuming the spread holds.
Location & tenants
- Location reads 74/100 on livability (#169 in TX, #4,447 nationally) — a middle-class / working-renter tenant base. Strengths: cost of living A+, housing A+, amenities B; Watch: commute F, health & safety F.
- Montgomery ISD (rural): math 63% / reading 57% proficiency, ranked #49 of 826 in TX (top 6%) — acceptable for families but not a draw, mixed tenant base, ~2y average lease.
- Zoned schools: Lake Creek H S (math 53% / reading 68%, grade C+, #268 of 1,632 statewide, top 17%, 1,649 students, 23% FRL) — zoned schools at 23% FRL track the district average.
- Market conditions: Rents flat; 2283 active listings in the ZIP; 6 comparable units currently listed for rent nearby; rentals lingering (median 44d on market — plan ~5-8 weeks vacancy on turnover, expect pricing pressure); 50% of comp listings sitting > 30 days — soft ceiling on asking rent; high-income renter base; 13,259 units permitted in Montgomery County in 2024 (1,402 in 5+ unit buildings).
Forward outlook
- Local home prices are declining (-3.0%/yr); year-one equity from $2k of loan paydown is wiped out by about $7k of value loss. Plan a longer hold.
- Montgomery County population projected at +65% by 2050 — long-run rental-demand tailwind backs the buy-and-hold thesis.
Negotiation context
- It's been on market 33 days — a 3% lower offer ($233k) is reasonable based on typical stale-listing flexibility.
- 2 sale attempts; this cycle's ask is 11890% above the opening price — seller raised mid-cycle; expect resistance to lowballs.
Questions for the listing agent
- It's been on market 33 days. Have you received any prior offers? Is the seller open to a 15% concession, seller financing, or rate buy-down credit?
- What does the HOA fee cover, when was the last increase, and are there any pending special assessments or reserve-fund shortfalls?
- Is there a deadline driving the sale (1031 exchange, divorce, estate, relocation)? That informs how much negotiation room exists.
- Schools are D-rated, which usually means shorter tenancies and higher turnover. Who's the typical renter profile here, and what's been the actual vacancy rate?
- The area grade is low — what's the realistic commute time and amenity access for the typical tenant pool here? Any planned neighborhood developments (good or bad) we should know about?
- What's the average days-on-market for RENTAL listings here right now (not sales)? A rising rental-DOM trend means longer vacancies and softer asking-rent achievability than the comps imply.
- What's the recent tenant-quality profile in this submarket — average credit score on applications, eviction rate, late-payment / NSF rate, and stable-employment percentage? A property-management company in the area should have these aggregated.
- How much new for-sale + rental construction is in the pipeline within 1–3 miles? Heavy new supply typically softens prices + rents 12–24 months out; constrained supply supports both.
Investment metrics
- 1% rule
- 0.82% ✗
- Cap rate
- 6.30%
- Cash-on-cash
- 0.03%
- DSCR
- 1.00
- GRM
- 10.1
CMA / ARV
- ARV (median comp)
- $246,200
- List price
- $239,790
- Delta
- -2.60%
- Verdict
- FAIR
- Comps
- 20 within 1.0 mi
Projected returns pro-forma
-3.0% appreciation · 0.4% rent growth · sell at horizon
- IRR
- -19.1%
- Equity multiple
- 0.35×
- Total profit
- $-44,990
- Equity at exit
- $36,709
- IRR
- -17.7%
- Equity multiple
- 0.14×
- Total profit
- $-59,312
- Equity at exit
- $21,287
Cash invested: $68,936 (down + closing). Projections, not guarantees.
Landlord ↔ Tenant lean methodology
- Overall (STATE)
- 87 Strongly Landlord-Friendly
- State Texas
- 87 Strongly Landlord-Friendly · R+5
- County
- — inherits STATE
- City
- — inherits STATE
ZIP-level market 77316
- Home prices YoY
- -10.7%
- Rents YoY
- 0.4%
- Active inventory
- 2283
- Price-to-rent
- 9.9×
Monthly cashflow live
- Estimated rent
- $2,028 high interval (Pro) →
- Mortgage (P&I)
- −$1,291
- Tax from tax record
- −$107 /mo · $1,284/yr
- Insurance
- −$103
- HOA
- −$100
- Vacancy / Maint / Mgmt
- −$426
- Net cashflow
- $2
Break-even live
UW: 25.0% down · 7.5% · 30yr · 1.5% tax · 5.0% vac · 8.0% maint · 8.0% mgmt
Financing live
Cash to close
- Down payment
- $61,550
- Closing costs
- $7,386
- Reserves months
- —
- Total cash needed
- —
Loan-product check · same deal, 3 products live
Conventional
25% down · 7.5% · 30yr
- Down + closing
- —
- Monthly P&I
- —
- Monthly cashflow
- —
- DSCR
- —
- Eligible?
- —
Personal DTI + credit; lowest rate.
DSCR
20% down · 8.5% · 30yr
- Down + closing
- —
- Monthly P&I
- —
- Monthly cashflow
- —
- DSCR
- —
- Eligible?
- —
No personal income docs; deal must DSCR.
Hard money
10% down · 12.0% · 12mo
- Down + closing
- —
- Monthly P&I
- —
- Monthly cashflow
- —
- DSCR
- —
- Eligible?
- —
Short-term bridge; refi at stabilization.
Rent comps 6 comps
| Address | Beds | Baths | Sqft | Rent | $/sqft | DOM | Units | Dist |
|---|---|---|---|---|---|---|---|---|
| 18544 Meadow Point Ln Montgomery, TX | 3.0 | 2.0 | 1467 | $1,950 | $1.33 | 43d | 1 | 0.33mi |
| 1751 Fennel Flower Dr Montgomery, TX | 3.0–4.0 | 2.0–2.5 | 1797 | $1,742 | $0.97 | 2d | 59 | 0.68mi |
| 607 Lake View Dr Montgomery, TX | 3.0 | 2.0 | 1197 | $1,499 | $1.25 | 43d | 1 | 1.06mi |
| 275 Pine Terrace Dr Unit 5106C Montgomery, TX | 3.0 | 2.5 | 1773 | $2,820 | $1.59 | 43d | 1 | 1.21mi |
| 9913 Crescent Cove Dr Montgomery, TX | 3.0–4.0 | 2.5–3.5 | 1805 | $1,499 | $0.83 | 2d | 42 | 1.26mi |
| 1050 S Pine Lake Rd Montgomery, TX | 2.0 | 2.0 | 1052 | $1,845 | $1.75 | 24d | 1 | 1.46mi |
HOA detail
- Monthly dues
- $100 · $1,200/yr
Listing history 12 events
-
2026-06-02statusdays on market $239,790 Pending 33 DOM
-
2026-06-01days on market $239,790 Active 32 DOM
-
2026-05-31days on market $239,790 Active 31 DOM
-
2026-05-15price $260,790 758-char remark
-
2026-05-05price $259,790 204-char remark
-
2026-05-04price $259,790 758-char remark
-
2026-05-02price $265,790 204-char remark
-
2026-05-01price $265,790 758-char remark
-
2026-04-30$262,790 Active 758-char remark
-
2026-04-25status Active 204-char remark
-
2026-04-25historical 204-char remark
-
2026-04-23$262,790 Active 204-char remark
ⓘ Source: listings_history table (triggers on properties + properties_extension) + one-shot
backfill from property_details.listing_events for pre-trigger history.
Tax reassessment forecast TX · Resets to sale price
- Current annual tax
- $1,284 · $107/mo
- Projected year-2 tax
- $4,388 · $366/mo
- Expected delta
- +$3,104/yr (+$259/mo · 241.7%)
ⓘ Screening estimate from a state-policy table — verify with the county assessor before closing.
Nearby sold comps map
Loading sold comps map…
Walkable amenities ~0.75 mi
Loading nearby amenities…
Taxation est. · year 1
- Rental income
- $24,340
- − Mortgage interest
- −$13,791
- − Property taxes
- −$1,284
- − Insurance
- −$1,231
- − Repairs & maintenance
- −$1,947
- − Management
- −$1,947
- − HOA
- −$1,200
- − Depreciation
- −$7,162
- Taxable loss
- −$4,223
- Est. tax savings @ 24.0%
- +$1,013
- After-tax cash flow
- $1,034/yr
For passive investors: Depreciation is non-cash, so a rental often shows a tax loss while cash-flowing — sheltering income. Rental losses are passive: they offset passive income freely, and up to $25,000/yr can offset ordinary (W-2) income if you actively participate and your MAGI is under $100k (phasing out to $0 by $150k); unused losses carry forward. On sale, claimed depreciation is recaptured at up to 25%, and gains may owe capital-gains tax (a 1031 exchange can defer both). Figures are a year-1 estimate at your 24.0% rate — not tax advice; consult a CPA.
Schools (NCES district)
- District
- Montgomery ISD
- NCES district ID
- 4831260
- Math proficiency
- 63% ▼ -3.00%
- Reading proficiency
- 57% ▼ -3.00%
- Median HH income
- $75,596
- Composite
- 53.55/100
- National rank
- #1445
- State rank
- #49 of 826 in TX
Livability — Conroe
- Score
- 74/100
- State rank
- #169
- US rank
- #4447
Category grades
Schools grade is shown separately in the Schools card above.
Census & demographics
- Census place
- Conroe, TX
- County
- Montgomery County · 663,713 people
- City population
- 205,417
- Metro
- Houston-The Woodlands-Sugar Land, TX
- Population (ZIP)
- 34,694
- Household income
- $124,055
- Rent vs Own
- Severe rent burden
- 273.0
Population outlook (Montgomery County) Hauer SSP2
- Today (2025)
- 713,896 people
- By 2030
- 805,263 · +12.8%
- By 2040
- 992,708 · +39.1%
- By 2050
- 1,179,590 · +65.2%
- By 2075
- 1,628,084 · +128.1%
- By 2100
- 1,937,880 · +171.5%
Race, ethnicity, and origin ACS 2023
- Neighborhood character
- Predominantly White (80%)
- Race & ethnicity
- White 80% Hispanic / Latino 14% Two or more races 11% Black 1% Asian 1%
- Hispanic origin (detail)
- Mexican 9%
- Common ancestry
- Lithuanian 6% Slovak 3% Romanian 3%
- Foreign-born
- 6% · Canada
- Languages at home
- 90% English-only · Spanish 8%
Political lean MEDSL · Montgomery
- 2024 margin
- Solid R (+45.5) · D 26.8% · R 72.3%
- 2008→2024 swing
- +7.2pp toward D · 2008: -52.7pp · 2024: -45.5pp
- All cycles
- 2024: R+45.5 2020: R+43.8 2016: R+51.4 2012: R+60.7 2008: R+52.7
Not yet ingested
- Civics
- —
Market trends
- HPI YoY
- ▼ -31.44%
- Current HPI
- 262.6973
- Rent YoY
- ▲ 0.40%
- Metro
- Houston-The Woodlands-Sugar Land, TX
- State GDP YoY
- ▲ 3.95%
- F500 in state
- 110
Industry mix (Fortune 500 HQ in TX)
| Industry | F500 HQs | Revenue |
|---|---|---|
| Energy | 16 | $1,198B |
|
||
| Technology | 5 | $198B |
|
||
| Engineering / Construction | 4 | $72B |
|
||
| Energy Services | 3 | $60B |
|
||
| Utilities | 3 | $41B |
|
||
| Healthcare | 2 | $330B |
|
||
Price history
-99.2% since first listed7 events — show timeline
- 2026-06-06 Listed for Rent $2,000 HARMLS
- 2026-06-02 Pending — HARMLS
- 2026-05-20 Price Changed $239,790 HARMLS
- 2026-05-15 Price Changed $260,790 HARMLS
- 2026-05-04 Price Changed $259,790 HARMLS
- 2026-05-01 Price Changed $265,790 HARMLS
- 2026-04-30 Listed $262,790 HARMLS
Property tax history
+0.8%/yrLatest (2025): $1,284 · -4.6% YoY. Source: county tax records.
Cash-flow waterfall
monthlySold comps — $/sqft
last 12 mo · ≤1 miLoading sold comps…