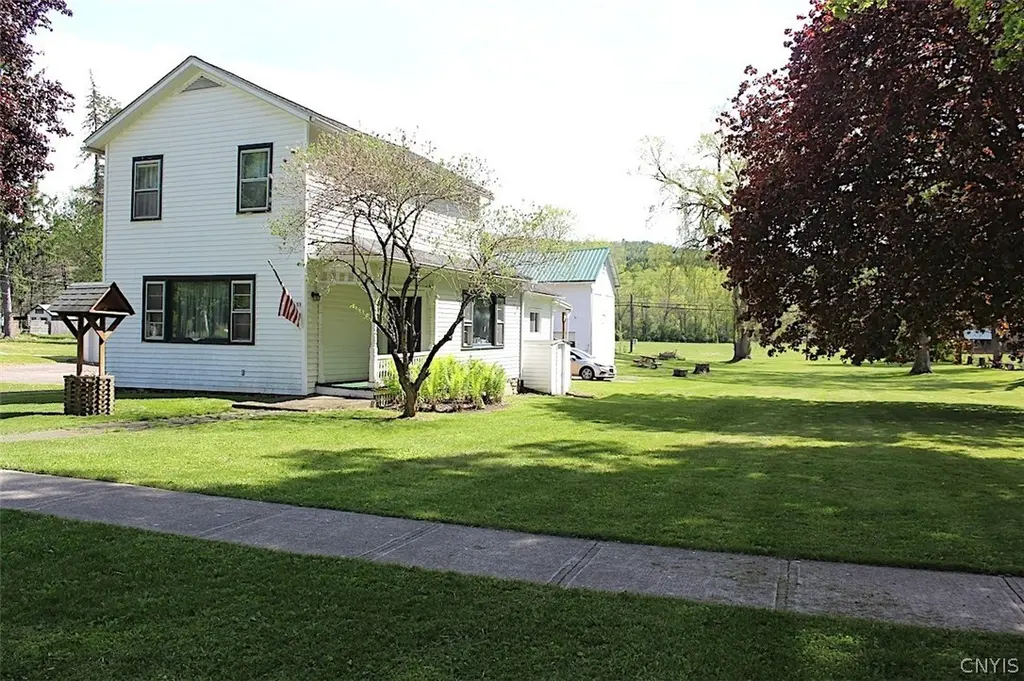
53 E Main St · Angelica, NY
Flood risk 6/10 · Moderate
- FEMA flood zone
- X
- Chance of flooding over 30 yrs
- 0.95%
- Est. flood insurance / yr
- $473 – $860
Fire risk 3/10 · Minor
- Est. fire insurance / yr
- $691 – $1,283
Heat risk 2/10 · Minimal
- Hot days now (above 89°F)
- 8 days/yr
- Hot days in 30 yrs
- 18 days/yr
Wind risk 1/10 · Minimal
- Chance of severe wind over 30 yrs
- —
Air-quality risk 1/10 · Minimal
- Unhealthy air days now
- 0 days/yr
- Unhealthy air days in 30 yrs
- 0 days/yr
Risk factors via First Street. Map © Google.
Why this score? — see what drove the F grade
The composite is a weighted blend of 9 inputs, each scored 0–100. Each bar is that input's sub-score; the figure is the points it added to the 100-point composite (weight × sub-score).
- Cash flow +7.8/30.0
- Appreciation +6.4/10.0
- Schools +4.5/10.0
- Livability +3.1/5.0
- 1% rule +2.8/10.0
- Rent growth +2.5/5.0
- Condition / age +2.5/5.0
- DSCR +1.9/10.0
- ARV discount +0.0/15.0
$142,900
🖨 Deal sheet (PDF) 📄 Offer letter ✓ Due diligence
Listing remarks
This home and oversized garage is located in the Village of Angelica NY, Allegany County. This spacious two-story village home offers the combination many buyers are searching for, a walkable neighborhood setting with a large yard, oversized detached garage, and flexible living space for everyday family life. Bordering the village athletic fields and set on a 0.64-acre lot, the property provides open views, room to spread out, and outdoor space that’s hard to find in a village setting. Inside, the home offers 1,588 square feet with a practical and comfortable layout. The eat-in kitchen provides plenty of cabinet space and flows directly into the main living areas, while the dining roo
Key facts
- Large yard
- Eat-in kitchen
- Outdoor space
Tags
Property features AI
Exterior
- Parking: Detached garage; Approximately 2.5 garage spaces
- Utilities: Public water (connected); Septic tank
- Home design: 2-story home; Existing structure
- Construction: Frame construction with wood siding; Stone foundation; Asphalt roof
- Exterior features: Gravel driveway; Covered porch
Interior
- Kitchen: Electric cooktop; Dishwasher; Refrigerator
- Bedrooms: 2 main-level bedrooms
- Flooring: Carpet; Hardwood; Laminate; Varied flooring
- Bathrooms: 2 full bathrooms; 1 main-level bathroom
- Heating & cooling: Gas heating; Baseboard heating
- Interior features: Eat-in kitchen; Workshop; Full basement
- Laundry & utility: Washer; Dryer; Gas water heater
Neighborhood map
What this means for you Summary
Snapshot
- This is a 2-bed/2.5-bath single-family listed at $143k.
Deal economics
- At list price, monthly cash flow is $-157 ($-2k/yr) — negative.
- To cash-flow at today's rent, offer at most $115k (19.4% below list).
- To meet the 1% rule (rent ≥ 1% of price), the offer needs to be $112k (21.6% below list).
- Recommended offer: $112k (21.6% below list) — sets the bar for 1% rule.
Location & tenants
- Location reads 61/100 on livability (#944 in NY) — a middle-class / working-renter tenant base. Strengths: cost of living A+, housing A+, employment B; Watch: health & safety D, schools D-, crime F.
- Genesee Valley Central School District (rural): math 52% / reading 50% proficiency, ranked #453 of 755 in NY (top 60%) — acceptable for families but not a draw, mixed tenant base, ~2y average lease.
- Market conditions: 20 active listings in the ZIP; 87 units permitted in Allegany County in 2024 (0 in 5+ unit buildings).
Forward outlook
- In year one you build about $5k of equity ($988 loan paydown + $4k appreciation (2.8% local appreciation)).
- Allegany County population projected at -26% by 2050 — secular population decline; favor cash flow + early exit over multi-decade hold.
- By year 7, paydown + projected appreciation supports a ~$32k cash-out refi (75% LTV) — recoverable capital for the next deal without selling this one.
Negotiation context
- It's been on market 24 days — a 2% lower offer ($141k) is reasonable based on typical stale-listing flexibility.
- 2 sale attempts since 3y ago with the ask held roughly flat each time — persistent listings suggest the price (not the market) is what's stuck; bring a comps-based counter.
- Current owner paid $55k; list at $143k implies a 159% gain — meaningful room to come down on a strong offer.
Risks & watch-outs
- Watch-outs: built in 1905 — expect roof / HVAC / electrical / plumbing capex.
- Climate carrying-cost: major flood risk — expect insurance premiums to compound above CPI over the hold.
Questions for the listing agent
- What do current leases actually rent for vs. the listed asking? Can we see a recent rent roll and the last 12 months of T-12 income?
- Built in 1905 — when were the roof, HVAC, electrical panel, plumbing, and water heater last replaced?
- Is there a deadline driving the sale (1031 exchange, divorce, estate, relocation)? That informs how much negotiation room exists.
- Schools are D-rated, which usually means shorter tenancies and higher turnover. Who's the typical renter profile here, and what's been the actual vacancy rate?
- Crime grade is F in this area — have there been break-ins, vandalism, or insurance claims at this property in the last 3 years? What carrier currently insures it and at what premium?
- The area grade is low — what's the realistic commute time and amenity access for the typical tenant pool here? Any planned neighborhood developments (good or bad) we should know about?
- What's the average days-on-market for RENTAL listings here right now (not sales)? A rising rental-DOM trend means longer vacancies and softer asking-rent achievability than the comps imply.
- What's the recent tenant-quality profile in this submarket — average credit score on applications, eviction rate, late-payment / NSF rate, and stable-employment percentage? A property-management company in the area should have these aggregated.
- How much new for-sale + rental construction is in the pipeline within 1–3 miles? Heavy new supply typically softens prices + rents 12–24 months out; constrained supply supports both.
Investment metrics
- 1% rule
- 0.78% ✗
- Cap rate
- 4.97%
- Cash-on-cash
- -4.71%
- DSCR
- 0.79
- GRM
- 10.6
CMA / ARV
- ARV (on-the-fly)
- $103,220
- Comps found
- 5
Show comp detail 5 sales within ~0.75 mi
| Address | Dist | Beds/Ba | Sqft | Sold | Price | $/sf | Match |
|---|---|---|---|---|---|---|---|
| 89 E Main St | 0.09mi | 3/2.0 (+1) | 1,804 (+14%) | 3mo | $150,000 | $83 | 64 |
| 34 Olean St | 0.52mi | 3/1.0 (+1) | 1,636 (+3%) | 8mo | $40,000 | $24 | 54 |
| 114 Elizabeth St | 0.56mi | 3/2.0 (+1) | 1,512 (-5%) | 8mo | $165,000 | $109 | 52 |
| 106 Mechanic St | 0.43mi | 3/1.0 (+1) | 1,782 (+12%) | 20mo | $72,000 | $40 | 31 |
| 221 W Main St | 0.74mi | 3/2.0 (+1) | 1,788 (+13%) | 9mo | $115,900 | $65 | 30 |
Match score weights: distance 35% · size 25% · config 20% · recency 20%. Top-matched comps best support the ARV.
Projected returns pro-forma
2.79% appreciation · 3.0% rent growth · sell at horizon
- IRR
- 2.5%
- Equity multiple
- 1.14×
- Total profit
- $5,692
- Equity at exit
- $62,589
- IRR
- 6.1%
- Equity multiple
- 1.91×
- Total profit
- $36,341
- Equity at exit
- $95,182
Cash invested: $40,012 (down + closing). Projections, not guarantees.
Landlord ↔ Tenant lean methodology
- Overall (STATE)
- 15 Strongly Tenant-Friendly
- State New York
- 15 Strongly Tenant-Friendly · D+10
- County
- — inherits STATE
- City
- — inherits STATE
ZIP-level market 14709
- Home prices YoY
- 1.0%
- Active inventory
- 20
- Price-to-rent
- 10.6×
Monthly cashflow live
- Estimated rent
- $1,121 medium interval (Pro) →
- Mortgage (P&I)
- −$749
- Tax from tax record
- −$233 /mo · $2,802/yr
- Insurance
- −$60
- HOA
- −$0
- Vacancy / Maint / Mgmt
- −$235
- Net cashflow
- $-157
Break-even live
Sensitivity live
| Price | -10% $-76 | -5% $-117 | +0% $-157 | +5% $-198 | +10% $-238 |
|---|---|---|---|---|---|
| Rent | -10% $-246 | -5% $-201 | +0% $-157 | +5% $-113 | +10% $-69 |
| Rate | -1.0pp $-85 | -0.5pp $-121 | base $-157 | +0.5pp $-194 | +1.0pp $-232 |
UW: 25.0% down · 7.5% · 30yr · 1.5% tax · 5.0% vac · 8.0% maint · 8.0% mgmt
Financing live
Cash to close
- Down payment
- $35,725
- Closing costs
- $4,287
- Reserves months
- —
- Total cash needed
- —
Loan-product check · same deal, 3 products live
Conventional
25% down · 7.5% · 30yr
- Down + closing
- —
- Monthly P&I
- —
- Monthly cashflow
- —
- DSCR
- —
- Eligible?
- —
Personal DTI + credit; lowest rate.
DSCR
20% down · 8.5% · 30yr
- Down + closing
- —
- Monthly P&I
- —
- Monthly cashflow
- —
- DSCR
- —
- Eligible?
- —
No personal income docs; deal must DSCR.
Hard money
10% down · 12.0% · 12mo
- Down + closing
- —
- Monthly P&I
- —
- Monthly cashflow
- —
- DSCR
- —
- Eligible?
- —
Short-term bridge; refi at stabilization.
Listing history 23 events
-
2026-06-22days on market $142,900 Active 24 DOM
-
2026-06-21days on market $142,900 Active 23 DOM
-
2026-06-21days on market $142,900 Active 22 DOM
-
2026-06-18days on market $142,900 Active 20 DOM
-
2026-06-17days on market $142,900 Active 19 DOM
-
2026-06-16days on market $142,900 Active 18 DOM
-
2026-06-15days on market $142,900 Active 17 DOM
-
2026-06-13days on market $142,900 Active 15 DOM
-
2026-06-12days on market $142,900 Active 14 DOM
-
2026-06-09days on market $142,900 Active 11 DOM
-
2026-06-08days on market $142,900 Active 10 DOM
-
2026-06-07days on market $142,900 Active 9 DOM
-
2026-06-05days on market $142,900 Active 7 DOM
-
2026-06-04days on market $142,900 Active 5 DOM
-
2026-06-02days on market $142,900 Active 4 DOM
-
2026-06-01days on market $142,900 Active 3 DOM
-
2026-05-31days on market $142,900 Active 2 DOM
-
2026-05-29$142,900 Active
-
2023-12-27status Pending
-
2023-09-08status Under Contract- Do Not Show
-
2023-09-07historical
-
2023-07-09$122,900 Active
-
2003-03-18soldstatus $55,120
ⓘ Source: listings_history table (triggers on properties + properties_extension) + one-shot
backfill from property_details.listing_events for pre-trigger history.
Tax reassessment forecast NY · Partial reset (capped growth)
- Current annual tax
- $2,802 · $233/mo
- Projected year-2 tax
- $2,802 · $233/mo
- Expected delta
- $0/yr ($0/mo · 0.0%)
ⓘ Screening estimate from a state-policy table — verify with the county assessor before closing.
Climate risk First Street
- Flood 6/10 Major FEMA zone X · 95% chance over 30 yrs
- Wildfire 3/10 Moderate
- Heat 2/10 Low 8 d/yr ≥89°F today · 18 d/yr by 30 yrs out
- Wind 1/10 Low
- Air quality 1/10 Low 0 unhealthy d/yr today · 0 by 30 yrs out
Nearby sold comps map
Loading sold comps map…
Walkable amenities ~0.75 mi
Loading nearby amenities…
Taxation est. · year 1
- Rental income
- $13,447
- − Mortgage interest
- −$8,005
- − Property taxes
- −$2,802
- − Insurance
- −$714
- − Repairs & maintenance
- −$1,076
- − Management
- −$1,076
- − Depreciation
- −$4,157
- Taxable loss
- −$4,382
- Est. tax savings @ 24.0%
- +$1,052
- After-tax cash flow
- $-834/yr
For passive investors: Depreciation is non-cash, so a rental often shows a tax loss while cash-flowing — sheltering income. Rental losses are passive: they offset passive income freely, and up to $25,000/yr can offset ordinary (W-2) income if you actively participate and your MAGI is under $100k (phasing out to $0 by $150k); unused losses carry forward. On sale, claimed depreciation is recaptured at up to 25%, and gains may owe capital-gains tax (a 1031 exchange can defer both). Figures are a year-1 estimate at your 24.0% rate — not tax advice; consult a CPA.
Schools (NCES district)
- District
- Genesee Valley Central School District
- NCES district ID
- 3600017
- Math proficiency
- 52% ▲ 5.00%
- Reading proficiency
- 50% ▲ 1.00%
- Median HH income
- $43,704
- Composite
- 45.0/100
- National rank
- #5858
- State rank
- #453 of 755 in NY
Livability — Angelica
- Score
- 61/100
- State rank
- #944
- US rank
- #18364
Category grades
Schools grade is shown separately in the Schools card above.
Census & demographics
- Census place
- Angelica, NY
- Population (ZIP)
- 1,190
Population outlook (Allegany County) Hauer SSP2
- Today (2025)
- 45,362 people
- By 2030
- 43,078 · -5.0%
- By 2040
- 38,031 · -16.2%
- By 2050
- 33,634 · -25.9%
- By 2075
- 25,285 · -44.3%
- By 2100
- 18,902 · -58.3%
Race, ethnicity, and origin ACS 2023
- Neighborhood character
- Predominantly White (94%)
- Race & ethnicity
- White 94% Two or more races 3% Asian 2%
- Common ancestry
- Lithuanian 5% Romanian 4% Slovak 2%
- Foreign-born
- 1% · China, Canada
- Languages at home
- 98% English-only · German/W. Germanic 2%
Political lean MEDSL · Allegany
- 2024 margin
- Solid R (+43.2) · D 28.4% · R 71.6%
- 2008→2024 swing
- -21.5pp toward R · 2008: -21.7pp · 2024: -43.2pp
- All cycles
- 2024: R+43.2 2020: R+38.9 2016: R+42.3 2012: R+25.3 2008: R+21.7
Not yet ingested
- Civics
- —
Market trends
- HPI YoY
- ▲ 2.79%
- Current HPI
- 270.867
- Rent YoY
- —
- Metro
- —
- State GDP YoY
- ▲ 2.60%
- F500 in state
- 92
Industry mix (Fortune 500 HQ in NY)
| Industry | F500 HQs | Revenue |
|---|---|---|
| Financial Services | 10 | $950B |
|
||
| Consumer Goods | 9 | $162B |
|
||
| Insurance | 4 | $225B |
|
||
| Telecommunications | 2 | $144B |
|
||
| Pharmaceuticals | 2 | $112B |
|
||
| Media / Entertainment | 2 | $69B |
|
||
Price history
+159.3% since first listed6 events — show timeline
- 2026-05-29 Listed $142,900 CNYIS
- 2023-12-27 Pending — UNYREIS
- 2023-09-08 Pending — UNYREIS
- 2023-09-07 Listing Removed — UNYREIS
- 2023-07-09 Listed $122,900 UNYREIS
- 2003-03-18 Sold (Public Records) $55,120 Public Records
Property tax history
+0.4%/yrLatest (2025): $2,802 · -0.1% YoY. Source: county tax records.
Cash-flow waterfall
monthlySold comps — $/sqft
last 12 mo · ≤1 miLoading sold comps…