5810 21st St N #15 · Lealman, FL
Flood risk 4/10 · Minor
- FEMA flood zone
- X (unshaded)
- Chance of flooding over 30 yrs
- 0.22%
- Est. flood insurance / yr
- $507 – $1,088
Fire risk 1/10 · Minimal
- Est. fire insurance / yr
- $947 – $1,759
Heat risk 10/10 · Severe
- Hot days now (above 106°F)
- 7 days/yr
- Hot days in 30 yrs
- 28 days/yr
Wind risk 10/10 · Severe
- Chance of severe wind over 30 yrs
- 99.0%
Air-quality risk 4/10 · Minor
- Unhealthy air days now
- 4 days/yr
- Unhealthy air days in 30 yrs
- 4 days/yr
Risk factors via First Street. Map © Google.
Why this score? — see what drove the C+ grade
The composite is a weighted blend of 9 inputs, each scored 0–100. Each bar is that input's sub-score; the figure is the points it added to the 100-point composite (weight × sub-score).
- Cash flow +25.1/30.0
- 1% rule +10.0/10.0
- DSCR +8.2/10.0
- ARV discount +7.5/15.0
- Schools +4.3/10.0
- Livability +4.0/5.0
- Condition / age +2.5/5.0
- Rent growth +2.0/5.0
- Appreciation +0.0/10.0
$78,500
🖨 Deal sheet 📄 Offer letter ✓ Due diligence
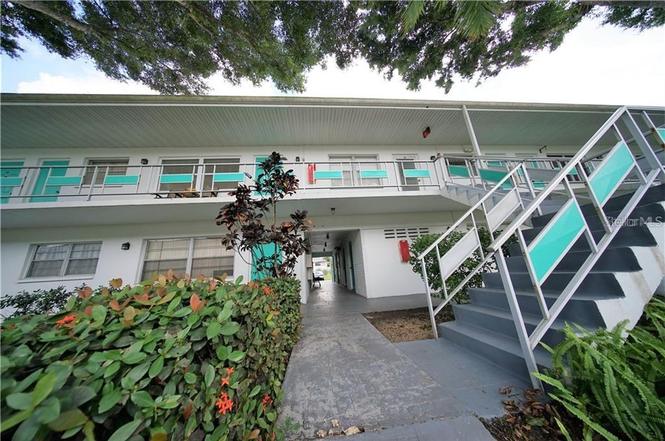
Listing remarks
Welcome to the Town Apts community located in X zone, which is presently NOT A FLOOD ZONE. This unit tucked in the west END OF THE COMPLEX, on the second floor, 2nd from the mid stairway features DOUBLE-PANE WINDOWS, UPDATED kitchen cabinets, FLORIDA ROOM in the back, CENTRALLY AIR-CONDITIONED Florida room in addition to all other rooms, gas stove, laminate and ceramic tile flooring, CARPORT, and more. The room sizes are approximate, and Florida room might be additional square footage not reflecting in total square footage in the public records; buyer is advised to measure all and verify. The LOW MONTHLY FEE in the amount of $430 includes presently water/sewer, trash removal, basic CABLE, I
Key facts
- Laminate flooring
- Carport
- Gas stove
Tags
Property features AI
Finance
- Other: Condo land included; Common-area pool (gunite, heated, in-ground)
- HOA & community: HOA with monthly condo fee ($445); Association amenities include clubhouse, pool, laundry, security, shuffleboard court and storage; Association fee covers pool, electricity, gas, sewer, water, trash, grounds maintenance and escrow reserves; Senior community; buyer approval required; pets not allowed; Total annual fees approximately $5,340
Exterior
- Parking: Assigned parking; Guest parking; Carport (1 space)
- Security: Community security
- Utilities: Public water; Public sewer; Electricity connected; Natural gas connected; Cable connected; Sewer connected; Water connected
- Home design: Condominium; Residential property; One story; Faces north; Building I
- Construction: Block and other construction materials; Shingle roof; Slab foundation; Built as part of a multi-unit building
- Exterior features: Awnings; Rain gutters; Sidewalk; Storage; Landscaped grounds with mature trees; Near public transit; Unincorporated area; Asphalt road access
Interior
- Kitchen: Range; Refrigerator
- Bedrooms: 1 bedroom
- Flooring: Ceramic tile; Laminate
- Bathrooms: 1 full bathroom
- Heating & cooling: Central heating (natural gas); Central air conditioning
- Interior features: Ceiling fans; Dining area (L-shaped); Double-pane windows; Smoke detectors
- Laundry & utility: On-site common laundry room; Laundry room with outside access
Neighborhood map
What this means for you Summary
Snapshot
- This is a 1-bed/1.0-bath condo listed at $78k.
Deal economics
- At list price, monthly cash flow is $173 ($2k/yr) — positive.
- The deal already cash-flows at list — no discount required.
- Meets the 1% rule at list price ($1k rent vs $78k).
- Recommended offer: $69k (12.0% below list) — sets the bar for market timing.
- Cap rate 8.9% vs local median 4.7% in Lealman — top-decile yield for the area; either an underpriced asset or a hidden risk that comps aren't pricing in. Stress-test before assuming the spread holds.
Location & tenants
- Location reads 81/100 on livability (#83 in FL, #1,394 nationally) — a professional / high-income tenant draw. Strengths: commute A+, cost of living A+, housing A+; Watch: crime D+, schools F, employment F.
- Pinellas (suburban): math 51% / reading 51% proficiency, ranked #31 of 73 in FL (top 42%) — acceptable for families but not a draw, mixed tenant base, ~2y average lease.
- Market conditions: Rents soft (-2.1%/yr); 165 active listings in the ZIP; 17 comparable units currently listed for rent nearby; rentals at typical pace (median 18d on market — plan ~3-4 weeks tenant-placement turnaround); 2,676 units permitted in Pinellas County in 2024 (1,422 in 5+ unit buildings).
- This rent runs 35% of the median local income ($47k/yr) — at the standard rent-burdened threshold; future hikes will face affordability resistance.
Forward outlook
- Local home prices are declining (-3.0%/yr); year-one equity from $543 of loan paydown is wiped out by about $2k of value loss. Plan a longer hold.
- Pinellas County population projected at +14% by 2050 — modest demand growth; plan on rents tracking national, not racing it.
Negotiation context
- It's been on market 314 days — a 12% lower offer ($69k) is reasonable based on typical stale-listing flexibility.
- 8 sale attempts since 11y ago; this cycle's ask has dropped $10k (12%) from the opening price — seller is motivated, your offer sets the floor, not the list.
- Current owner paid $14k; list at $78k implies a 461% gain — meaningful room to come down on a strong offer.
Risks & watch-outs
- Watch-outs: HOA is 32% of rent.
- Climate carrying-cost: severe wind risk, 99% chance of damaging wind over 30y; extreme-heat days projected 7→28/yr by 2055 (HVAC capex compounding) — expect insurance premiums to compound above CPI over the hold.
Questions for the listing agent
- It's been on market 314 days. Have you received any prior offers? Is the seller open to a 12% concession, seller financing, or rate buy-down credit?
- Built in 1966 — when were the roof, HVAC, electrical panel, plumbing, and water heater last replaced?
- What does the HOA fee cover, when was the last increase, and are there any pending special assessments or reserve-fund shortfalls?
- Any open or pending special assessments — roof, HVAC, plumbing, elevator, façade? What's the per-unit balance and payoff schedule, and is the seller paying it off at close or rolling it to the buyer?
- Why hasn't it sold? Are there any deal-killer items the seller is aware of (foundation, flood, title, zoning, code violations)?
- Is there a deadline driving the sale (1031 exchange, divorce, estate, relocation)? That informs how much negotiation room exists.
- Schools are F-rated, which usually means shorter tenancies and higher turnover. Who's the typical renter profile here, and what's been the actual vacancy rate?
- Crime grade is D in this area — have there been break-ins, vandalism, or insurance claims at this property in the last 3 years? What carrier currently insures it and at what premium?
- What's the average days-on-market for RENTAL listings here right now (not sales)? A rising rental-DOM trend means longer vacancies and softer asking-rent achievability than the comps imply.
- What's the recent tenant-quality profile in this submarket — average credit score on applications, eviction rate, late-payment / NSF rate, and stable-employment percentage? A property-management company in the area should have these aggregated.
- How much new apartment / multifamily construction is in the pipeline within 1–3 miles? Heavy new supply (>2% of stock underway) typically softens rents 12–24 months out; light construction supports rent growth.
Investment metrics
- 1% rule
- 1.78% ✓
- Cap rate
- 8.93%
- Cash-on-cash
- 9.42%
- DSCR
- 1.42
- GRM
- 4.7
CMA / ARV
No comps found within radius.
Projected returns pro-forma
-3.0% appreciation · 0.0% rent growth · sell at horizon
- IRR
- -7.2%
- Equity multiple
- 0.75×
- Total profit
- $-5,575
- Equity at exit
- $11,705
- IRR
- -4.8%
- Equity multiple
- 0.75×
- Total profit
- $-5,504
- Equity at exit
- $6,787
Cash invested: $21,980 (down + closing). Projections, not guarantees.
Landlord ↔ Tenant lean methodology
- Overall (STATE)
- 87 Strongly Landlord-Friendly
- State Florida
- 87 Strongly Landlord-Friendly · R+3
- County
- — inherits STATE
- City
- — inherits STATE
ZIP-level market 33714
- Home prices YoY
- -30.9%
- Rents YoY
- -2.1%
- Active inventory
- 165
- Price-to-rent
- 4.7×
Monthly cashflow live
- Estimated rent
- $1,400 high interval (Pro) →
- Mortgage (P&I)
- −$412
- Tax from tax record
- −$44 /mo · $534/yr
- Insurance
- −$33
- HOA
- −$445
- Vacancy / Maint / Mgmt
- −$294
- Net cashflow
- $173
Break-even live
UW: 25.0% down · 7.5% · 30yr · 1.5% tax · 5.0% vac · 8.0% maint · 8.0% mgmt
Financing live
Cash to close
- Down payment
- $19,625
- Closing costs
- $2,355
- Reserves months
- —
- Total cash needed
- —
Loan-product check · same deal, 3 products live
Conventional
25% down · 7.5% · 30yr
- Down + closing
- —
- Monthly P&I
- —
- Monthly cashflow
- —
- DSCR
- —
- Eligible?
- —
Personal DTI + credit; lowest rate.
DSCR
20% down · 8.5% · 30yr
- Down + closing
- —
- Monthly P&I
- —
- Monthly cashflow
- —
- DSCR
- —
- Eligible?
- —
No personal income docs; deal must DSCR.
Hard money
10% down · 12.0% · 12mo
- Down + closing
- —
- Monthly P&I
- —
- Monthly cashflow
- —
- DSCR
- —
- Eligible?
- —
Short-term bridge; refi at stabilization.
Rent comps 17 comps
| Address | Beds | Baths | Sqft | Rent | $/sqft | DOM | Units | Dist |
|---|---|---|---|---|---|---|---|---|
| 5850 18th St N St Petersburg, FL | 1.0–2.0 | 1.0–2.0 | 727 | $1,300 | $1.79 | 24d | 2 | 0.21mi |
| 3109 54th Ave N Saint Petersburg, FL | 1.0 | 1.0 | 400 | $1,025 | $2.56 | 21d | 1 | 0.89mi |
| 3109 54th Ave N Unit 1/2 St. Petersburg, FL | 1.0 | 1.0 | 400 | $1,025 | $2.56 | 17d | 1 | 0.89mi |
| 4481 Crestwood Dr N Saint Petersburg, FL | 2.0 | 1.0 | 720 | $1,950 | $2.71 | 3d | 1 | 0.90mi |
| 660 62nd Ave N #1204 Saint Petersburg, FL | 1.0 | 1.0 | 656 | $1,400 | $2.13 | 23d | 1 | 1.18mi |
| 2807 41st Ave N Unit 3 St. Petersburg, FL | 1.0 | 1.0 | 450 | $1,600 | $3.56 | 24d | 1 | 1.23mi |
| 4163 31st St N unit Unit D Saint Petersburg, FL | 1.0 | 1.0 | 600 | $1,490 | $2.48 | 13d | 1 | 1.32mi |
| 3725 18th St N Saint Petersburg, FL | 2.0 | 1.0 | 700 | $1,795 | $2.56 | 16d | 1 | 1.32mi |
| 3600 49th Ave N Saint Petersburg, FL | 1.0–2.0 | 1.0 | 680 | $1,150 | $1.69 | 3d | 8 | 1.34mi |
| 209 NW Jefferson Cir N Unit 15 St. Petersburg, FL | 2.0 | 1.0 | 740 | $1,275 | $1.72 | 24d | 1 | 1.35mi |
| 209 NW Jefferson Cir N Unit JEFFERSON209-15 St. Petersburg, FL | 2.0 | 1.0 | 740 | $1,275 | $1.72 | 2d | 1 | 1.35mi |
| 550 50th Ave N Saint Petersburg, FL | 2.0 | 1.0 | 765 | $1,700 | $2.22 | 7d | 2 | 1.37mi |
| 5364 4th St N St. Petersburg, FL | 1.0 | 1.0 | 570 | $1,150 | $2.02 | 24d | 1 | 1.39mi |
| 3791 58th Ave N Unit 3 St. Petersburg, FL | 1.0 | 1.0 | 500 | $1,430 | $2.86 | 17d | 1 | 1.40mi |
| 3715 66th Ave N Unit B Pinellas Park, FL | 2.0 | 1.0 | 750 | $1,475 | $1.97 | 21d | 1 | 1.45mi |
| 2730 37th Ave N Unit B St. Petersburg, FL | 1.0 | 1.0 | 560 | $1,590 | $2.84 | 24d | 1 | 1.46mi |
| 3700 Haines Rd N St Petersburg, FL | 1.0–2.0 | 1.0 | 675 | $1,700 | $2.52 | 14d | 2 | 1.49mi |
HOA detail condo
- Monthly dues
- $445 · $5,340/yr
- Likely covers
- watersewertrashgascable
- Assessments
- None detected in remarks — confirm with the listing agent.
Listing history 33 events
-
2026-06-18days on market $78,500 Active 314 DOM
-
2026-06-17days on market $78,500 Active 313 DOM
-
2026-06-16days on market $78,500 Active 312 DOM
-
2026-06-15days on market $78,500 Active 311 DOM
-
2026-06-13days on market $78,500 Active 309 DOM
-
2026-06-09days on market $78,500 Active 305 DOM
-
2026-06-08days on market $78,500 Active 304 DOM
-
2026-06-07days on market $78,500 Active 303 DOM
-
2026-06-04days on market $78,500 Active 300 DOM
-
2026-06-03days on market $78,500 Active 299 DOM
-
2026-06-01days on market $78,500 Active 297 DOM
-
2026-05-31days on market $78,500 Active 296 DOM
-
2026-02-01status Active
-
2026-01-31historical
-
2026-01-01status Active
-
2025-12-30historical
-
2025-11-13price $78,500
-
2025-10-31status Active
-
2025-10-30historical
-
2025-08-05$89,000 Active
-
2021-05-04price $99,500
-
2021-05-04price $85,000
-
2019-06-19price $66,900
-
2019-01-29$55,300 Active
-
2017-01-05historical
-
2016-12-10$34,995 Active
-
2016-08-31historical
-
2016-02-22$35,000 Active
-
2015-12-15historical
-
2015-07-10price $35,000
-
2015-06-16price $33,000
-
2015-02-11$29,900 Active
-
1998-04-03soldstatus $14,000
ⓘ Source: listings_history table (triggers on properties + properties_extension) + one-shot
backfill from property_details.listing_events for pre-trigger history.
Tax reassessment forecast FL · Resets to sale price
- Current annual tax
- $534 · $44/mo
- Projected year-2 tax
- $652 · $54/mo
- Expected delta
- +$118/yr (+$10/mo · 22.1%)
ⓘ Screening estimate from a state-policy table — verify with the county assessor before closing.
Climate risk First Street
- Flood 4/10 Moderate FEMA zone X (unshaded) · 22% chance over 30 yrs
- Wildfire 1/10 Low
- Heat 10/10 Extreme 7 d/yr ≥106°F today · 28 d/yr by 30 yrs out
- Wind 10/10 Extreme 99% chance of damaging wind over 30 yrs
- Air quality 4/10 Moderate 4 unhealthy d/yr today · 4 by 30 yrs out
Nearby sold comps map
Loading sold comps map…
Walkable amenities ~0.75 mi
Loading nearby amenities…
Taxation est. · year 1
- Rental income
- $16,805
- − Mortgage interest
- −$4,397
- − Property taxes
- −$534
- − Insurance
- −$392
- − Repairs & maintenance
- −$1,344
- − Management
- −$1,344
- − HOA
- −$5,340
- − Depreciation
- −$2,284
- Taxable income
- $1,170
- Est. tax owed @ 24.0%
- −$281
- After-tax cash flow
- $1,790/yr
For passive investors: Depreciation is non-cash, so a rental often shows a tax loss while cash-flowing — sheltering income. Rental losses are passive: they offset passive income freely, and up to $25,000/yr can offset ordinary (W-2) income if you actively participate and your MAGI is under $100k (phasing out to $0 by $150k); unused losses carry forward. On sale, claimed depreciation is recaptured at up to 25%, and gains may owe capital-gains tax (a 1031 exchange can defer both). Figures are a year-1 estimate at your 24.0% rate — not tax advice; consult a CPA.
Schools (NCES district)
- District
- Pinellas
- NCES district ID
- 1201560
- Math proficiency
- 51% ▼ -5.00%
- Reading proficiency
- 51% ▼ -3.00%
- Median HH income
- $46,270
- Composite
- 43.27/100
- National rank
- #3046
- State rank
- #31 of 73 in FL
Livability — Lealman
- Score
- 81/100
- State rank
- #83
- US rank
- #1394
Category grades
Schools grade is shown separately in the Schools card above.
Census & demographics
- Census place
- Lealman, FL
- County
- Pinellas County · 939,478 people
- City population
- 20,103
- Metro
- Tampa-St. Petersburg-Clearwater, FL
- Population (ZIP)
- 19,227
- Household income
- $47,487
- Rent vs Own
- Severe rent burden
- 915.0
Population outlook (Pinellas County) Hauer SSP2
- Today (2025)
- 1,027,532 people
- By 2030
- 1,063,586 · +3.5%
- By 2040
- 1,125,020 · +9.5%
- By 2050
- 1,168,637 · +13.7%
- By 2075
- 1,265,188 · +23.1%
- By 2100
- 1,260,357 · +22.7%
Race, ethnicity, and origin ACS 2023
- Neighborhood character
- Diverse neighborhood (Simpson 0.55)
- Race & ethnicity
- White 64% Hispanic / Latino 13% Two or more races 12% Black 10% Asian 6%
- Hispanic origin (detail)
- Mexican 2% Puerto Rican 2% Cuban 6% Dominican 1%
- Common ancestry
- Slovak 2% Italian 2% Romanian 2%
- Foreign-born
- 16% · Canada, Vietnam
- Languages at home
- 79% English-only · Spanish 11% Russian/Polish/Slavic 4% Vietnamese 3%
Political lean MEDSL · Pinellas
- 2024 margin
- Lean R (+5.2) · D 46.9% · R 52.1%
- 2008→2024 swing
- -13.5pp toward R · 2008: 8.3pp · 2024: -5.2pp
- All cycles
- 2024: R+5.2 2020: D+0.2 2016: R+1.1 2012: D+5.6 2008: D+8.3
Not yet ingested
- Civics
- —
Market trends
- HPI YoY
- ▼ -179.12%
- Current HPI
- 399.6253
- Rent YoY
- ▼ -2.08%
- Metro
- Tampa-St. Petersburg-Clearwater, FL
- State GDP YoY
- ▲ 3.28%
- F500 in state
- 36
Industry mix (Fortune 500 HQ in FL)
| Industry | F500 HQs | Revenue |
|---|---|---|
| Industrial Technology | 2 | $29B |
|
||
| Insurance | 2 | $17B |
|
||
| Retail | 1 | $60B |
|
||
| Technology Distribution | 1 | $58B |
|
||
| Homebuilding | 1 | $35B |
|
||
| Technology Manufacturing | 1 | $35B |
|
||
Price history
+460.7% since first listed21 events — show timeline
- 2026-02-01 Relisted — Stellar MLS as Distributed by MLS Grid
- 2026-01-31 Listing Removed — Stellar MLS as Distributed by MLS Grid
- 2026-01-01 Relisted — Stellar MLS as Distributed by MLS Grid
- 2025-12-30 Listing Removed — Stellar MLS as Distributed by MLS Grid
- 2025-11-13 Price Changed $78,500 Stellar MLS as Distributed by MLS Grid
- 2025-10-31 Relisted — Stellar MLS as Distributed by MLS Grid
- 2025-10-30 Listing Removed — Stellar MLS as Distributed by MLS Grid
- 2025-08-05 Listed $89,000 Stellar MLS as Distributed by MLS Grid
- 2021-05-04 Price Changed $85,000 Stellar MLS as Distributed by MLS Grid
- 2021-05-04 Price Changed $99,500 Stellar MLS as Distributed by MLS Grid
- 2019-06-19 Price Changed $66,900 Stellar MLS as Distributed by MLS Grid
- 2019-01-29 Listed $55,300 Stellar MLS as Distributed by MLS Grid
- 2017-01-05 Listing Removed — Stellar MLS as Distributed by MLS Grid
- 2016-12-10 Listed $34,995 Stellar MLS as Distributed by MLS Grid
- 2016-08-31 Listing Removed — Stellar MLS as Distributed by MLS Grid
- 2016-02-22 Listed $35,000 Stellar MLS as Distributed by MLS Grid
- 2015-12-15 Listing Removed — Stellar MLS as Distributed by MLS Grid
- 2015-07-10 Price Changed $35,000 Stellar MLS as Distributed by MLS Grid
- 2015-06-16 Price Changed $33,000 Stellar MLS as Distributed by MLS Grid
- 2015-02-11 Listed $29,900 Stellar MLS as Distributed by MLS Grid
- 1998-04-03 Sold (Public Records) $14,000 Public Records
Property tax history
+4.3%/yrLatest (2025): $534 · -2.5% YoY. Source: county tax records.
Cash-flow waterfall
monthlySold comps — $/sqft
last 12 mo · ≤1 miLoading sold comps…