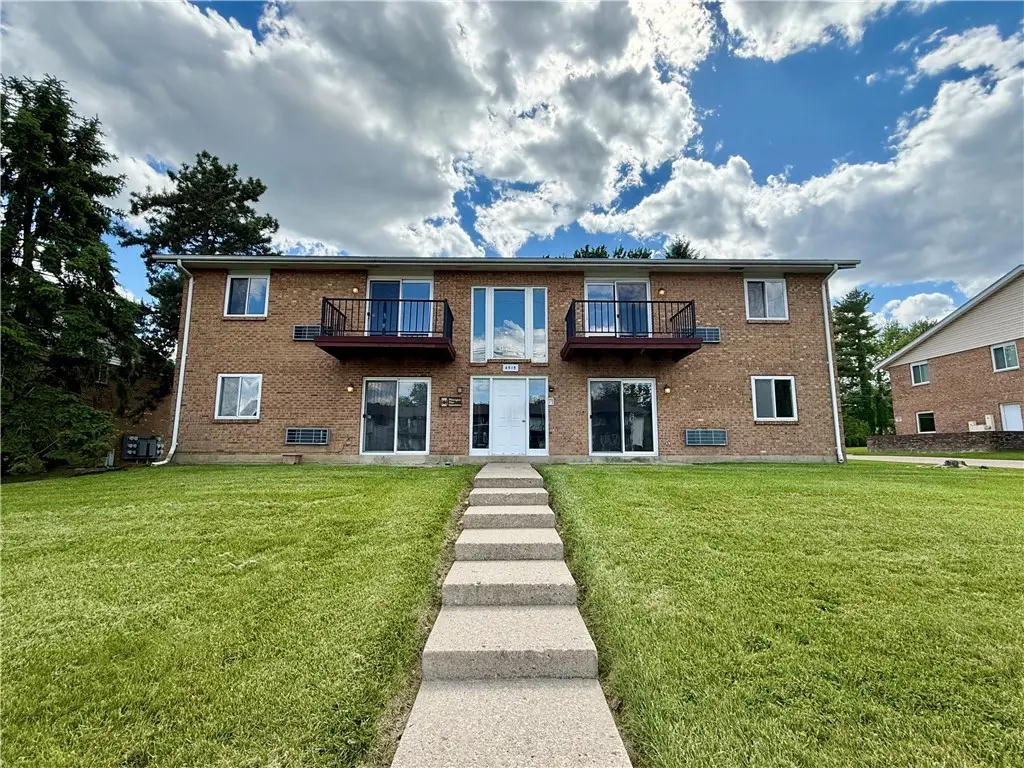
 8-Plex
4515 Wilmington Pike · Kettering, OH
Flood risk 1/10 · Minimal
- FEMA flood zone
- X (unshaded)
- Chance of flooding over 30 yrs
- 0.0%
- Est. flood insurance / yr
- $507 – $1,088
Fire risk 1/10 · Minimal
- Est. fire insurance / yr
- $713 – $1,323
Heat risk 3/10 · Minor
- Hot days now (above 100°F)
- 7 days/yr
- Hot days in 30 yrs
- 18 days/yr
Wind risk 2/10 · Minimal
- Chance of severe wind over 30 yrs
- 0.0%
Air-quality risk 3/10 · Minor
- Unhealthy air days now
- 2 days/yr
- Unhealthy air days in 30 yrs
- 3 days/yr
Risk factors via First Street. Map © Google.
Why this score? — see what drove the B grade
The composite is a weighted blend of 9 inputs, each scored 0–100. Each bar is that input's sub-score; the figure is the points it added to the 100-point composite (weight × sub-score).
- Cash flow +30.0/30.0
- 1% rule +10.0/10.0
- DSCR +10.0/10.0
- ARV discount +7.5/15.0
- Schools +5.2/10.0
- Livability +4.2/5.0
- Condition / age +4.0/5.0
- Rent growth +3.6/5.0
- Appreciation +0.0/10.0
$543,752
🖨 Deal sheet 📄 Offer letter ✓ Due diligence
Multi-family units
County records classify this as Multi-Family (5+ Unit). Listing-text estimate: 8 units. confirmed
5+ unit building — per-unit beds/baths from public records are typically unavailable; the breakdown below (if shown) is an estimate from the listing text.
Listing remarks
8-unit multifamily investment opportunity locations on Wilmington Pike in Kettering. Property consists of Eight 1-Bedroom units with shared laundry facilities available within the building. Existing appliances currently on site convey with the property. Building is serviced by a single water meter and includes approximately 9 off street parking spaces located behind the building. Property is currently fully vacant with no tenants in place. Conveniently situated near shopping, dining, employment centers and major transportation routes, offering strong accessibility for tenants and long-term investment potential. Property presents an opportunity for improvements updates, and value-add potenti
Key facts
- Strong accessibility
- Value-add potential
- 0.34 acre lot
Tags
Property features AI
Finance
- Financial info: Offered for sale
Exterior
- Parking: No garage
- Utilities: Public water; Water service available
- Home design: Two-story building; Single building containing all units
- Construction: Brick construction; Slab foundation; Built on a 0.34-acre lot
- Exterior features: Residential zoning; Public water available
Interior
- Kitchen: Range; Refrigerator
- Bedrooms: All units are one-bedroom units (8 total)
- Bathrooms: Eight full bathrooms
- Heating & cooling: Individual heating; Wall-mounted cooling units
- Interior features: Individual heating for each unit; Wall cooling units
- Laundry & utility: No specific laundry details provided
Neighborhood map
What this means for you Summary
Snapshot
- This is a 8 × 1-bed/1-bath units multifamily listed at $544k. Condition is rated good.
Deal economics
- At list price, monthly cash flow is $3k ($34k/yr) — positive. Per door: $357/mo.
- The deal already cash-flows at list — no discount required.
- Meets the 1% rule at list price ($8k rent vs $544k).
- Cap rate 12.6% vs local median 4.4% in Kettering — top-decile yield for the area; either an underpriced asset or a hidden risk that comps aren't pricing in. Stress-test before assuming the spread holds.
Location & tenants
- Location reads 83/100 on livability (#61 in OH, #922 nationally) — a professional / high-income tenant draw. Strengths: schools A+, crime A+, cost of living A+; Watch: commute F.
- Kettering City School District (suburban): math 54% / reading 68% proficiency, ranked #277 of 656 in OH (top 42%) — acceptable for families but not a draw, mixed tenant base, ~2y average lease.
- Market conditions: Rents rising fast (+4.3%/yr); 119 active listings in the ZIP; solid renter incomes; 907 units permitted in Montgomery County in 2024 (416 in 5+ unit buildings).
- At $8,370/mo this rent would consume 122% of the median local household income ($82k/yr) (locally 626% of renters already pay >50% of income on rent) — very limited rent-growth headroom before tenants either downsize or default.
Forward outlook
- Local home prices are declining (-3.0%/yr); year-one equity from $4k of loan paydown is wiped out by about $16k of value loss. Plan a longer hold.
- Montgomery County population projected at -10% by 2050 — secular population decline; favor cash flow + early exit over multi-decade hold.
- At projected returns (-3.0% appreciation + 4.3% rent growth), your $152k cash investment doubles in ~6 years — after that, you're playing with house money.
Negotiation context
- Only 6 days on market — expect competitive offers; lowballing is unlikely to land.
Questions for the listing agent
- Can we see the unit-by-unit rent roll, current vacancy, and any below-market leases? What's the average tenancy length?
- What capital expenditures (roof, boiler, parking lot, exteriors) have been made in the last 5 years, and what's planned in the next 2?
- Built in 1977 — when were the roof, HVAC, electrical panel, plumbing, and water heater last replaced?
- Is there a deadline driving the sale (1031 exchange, divorce, estate, relocation)? That informs how much negotiation room exists.
- Schools are A-rated — typically a magnet for longer-tenancy family renters. What's the average tenant stay here, and is there a school-zone premium baked into asking?
- What's the average days-on-market for RENTAL listings here right now (not sales)? A rising rental-DOM trend means longer vacancies and softer asking-rent achievability than the comps imply.
- What's the recent tenant-quality profile in this submarket — average credit score on applications, eviction rate, late-payment / NSF rate, and stable-employment percentage? A property-management company in the area should have these aggregated.
- How much new apartment / multifamily construction is in the pipeline within 1–3 miles? Heavy new supply (>2% of stock underway) typically softens rents 12–24 months out; light construction supports rent growth.
Investment metrics
- 1% rule
- 1.54% ✓
- Cap rate
- 12.59%
- Cash-on-cash
- 22.50%
- DSCR
- 2.00
- GRM
- 5.4
CMA / ARV
No comps found within radius.
Projected returns pro-forma
-3.0% appreciation · 4.35% rent growth · sell at horizon
- IRR
- 16.9%
- Equity multiple
- 1.69×
- Total profit
- $105,344
- Equity at exit
- $81,075
- IRR
- 26.4%
- Equity multiple
- 3.46×
- Total profit
- $374,950
- Equity at exit
- $47,014
Cash invested: $152,251 (down + closing). Projections, not guarantees.
Landlord ↔ Tenant lean methodology
- Overall (STATE)
- 73 Landlord-Friendly
- State Ohio
- 73 Landlord-Friendly · R+6
- County
- — inherits STATE
- City
- — inherits STATE
ZIP-level market 45440
- Rents YoY
- 4.3%
- Active inventory
- 119
- Price-to-rent
- 43.3×
Monthly cashflow live
- Estimated rent
- $8,370 medium interval (Pro) →
- Mortgage (P&I)
- −$2,851
- Tax est. 1.5%
- −$680 /mo · $8,156/yr
- Insurance
- −$227
- HOA
- −$0
- Vacancy / Maint / Mgmt
- −$1,758
- Net cashflow
- $2,855
Break-even live
8-unit breakdown (identical units grouped — click to expand)
| Units | Beds | Baths | Est. rent |
|---|---|---|---|
| 8× units | 1 | 1 | $8,368 |
| #1 | 1 | 1 | $1,046 |
| #2 | 1 | 1 | $1,046 |
| #3 | 1 | 1 | $1,046 |
| #4 | 1 | 1 | $1,046 |
| #5 | 1 | 1 | $1,046 |
| #6 | 1 | 1 | $1,046 |
| #7 | 1 | 1 | $1,046 |
| #8 | 1 | 1 | $1,046 |
| Total (8 units) | $8,370 | ||
UW: 25.0% down · 7.5% · 30yr · 1.5% tax · 5.0% vac · 8.0% maint · 8.0% mgmt
Financing live
Cash to close
- Down payment
- $135,938
- Closing costs
- $16,313
- Reserves months
- —
- Total cash needed
- —
Loan-product check · same deal, 3 products live
Conventional
25% down · 7.5% · 30yr
- Down + closing
- —
- Monthly P&I
- —
- Monthly cashflow
- —
- DSCR
- —
- Eligible?
- —
Personal DTI + credit; lowest rate.
DSCR
20% down · 8.5% · 30yr
- Down + closing
- —
- Monthly P&I
- —
- Monthly cashflow
- —
- DSCR
- —
- Eligible?
- —
No personal income docs; deal must DSCR.
Hard money
10% down · 12.0% · 12mo
- Down + closing
- —
- Monthly P&I
- —
- Monthly cashflow
- —
- DSCR
- —
- Eligible?
- —
Short-term bridge; refi at stabilization.
Listing history 5 events
-
2026-06-03status $543,752 Pending 6 DOM
-
2026-06-02days on market $543,752 Active 6 DOM
-
2026-06-01days on market $543,752 Active 5 DOM
-
2026-05-31days on market $543,752 Active 4 DOM
-
2026-05-27$543,752 Active
ⓘ Source: listings_history table (triggers on properties + properties_extension) + one-shot
backfill from property_details.listing_events for pre-trigger history.
Climate risk First Street
- Flood 1/10 Low FEMA zone X (unshaded) · 0% chance over 30 yrs
- Wildfire 1/10 Low
- Heat 3/10 Moderate 7 d/yr ≥100°F today · 18 d/yr by 30 yrs out
- Wind 2/10 Low 0% chance of damaging wind over 30 yrs
- Air quality 3/10 Moderate 2 unhealthy d/yr today · 3 by 30 yrs out
Nearby sold comps map
Loading sold comps map…
Walkable amenities ~0.75 mi
Loading nearby amenities…
Taxation est. · year 1
- Rental income
- $100,440
- − Mortgage interest
- −$30,459
- − Property taxes
- −$8,156
- − Insurance
- −$2,719
- − Repairs & maintenance
- −$8,035
- − Management
- −$8,035
- − Depreciation
- −$15,818
- Taxable income
- $27,218
- Est. tax owed @ 24.0%
- −$6,532
- After-tax cash flow
- $27,722/yr
For passive investors: Depreciation is non-cash, so a rental often shows a tax loss while cash-flowing — sheltering income. Rental losses are passive: they offset passive income freely, and up to $25,000/yr can offset ordinary (W-2) income if you actively participate and your MAGI is under $100k (phasing out to $0 by $150k); unused losses carry forward. On sale, claimed depreciation is recaptured at up to 25%, and gains may owe capital-gains tax (a 1031 exchange can defer both). Figures are a year-1 estimate at your 24.0% rate — not tax advice; consult a CPA.
Condition & rehab AI · 2 photos
This 8-unit multifamily property is in good condition with minimal repairs needed. Painting the exterior and maintaining the landscaping would significantly enhance its curb appeal and value.
Value-add opportunities
- Both Paint exterior — Enhances curb appeal and property value
- Both Landscaping — Improves curb appeal and enhances property value
Renovation cost estimate screening
Value-add ROI direction
- Both Paint exterior — Enhances curb appeal and property value ↑
- Both Landscaping — Improves curb appeal and enhances property value ↑
ⓘ Cost ranges are severity-bucket heuristics (US national rule-of-thumb). Get contractor quotes + a written scope before underwriting a rehab budget.
Schools (NCES district)
- District
- Kettering City School District
- NCES district ID
- 3904418
- Math proficiency
- 54% ▼ -21.00%
- Reading proficiency
- 68% ▼ -9.00%
- Median HH income
- $50,353
- Composite
- 51.89/100
- National rank
- #1653
- State rank
- #277 of 656 in OH
Livability — Kettering
- Score
- 83/100
- State rank
- #61
- US rank
- #922
Category grades
Schools grade is shown separately in the Schools card above.
Census & demographics
- Census place
- Kettering, OH
- County
- Greene County · 132,120 people
- City population
- 73,116
- Metro
- Dayton-Kettering, OH
- Population (ZIP)
- 22,358
- Household income
- $82,383
- Rent vs Own
- Severe rent burden
- 626.0
Population outlook (Montgomery County) Hauer SSP2
- Today (2025)
- 523,241 people
- By 2030
- 514,948 · -1.6%
- By 2040
- 493,378 · -5.7%
- By 2050
- 469,639 · -10.2%
- By 2075
- 418,360 · -20.0%
- By 2100
- 353,315 · -32.5%
Race, ethnicity, and origin ACS 2023
- Neighborhood character
- Predominantly White (82%)
- Race & ethnicity
- White 82% Two or more races 9% Black 5% Hispanic / Latino 5% Asian 2%
- Common ancestry
- Romanian 2% Lithuanian 2% Italian 2%
- Foreign-born
- 6% · Canada, South Korea
- Languages at home
- 92% English-only · Spanish 3% French/Haitian/Cajun 1% Arabic 1%
Political lean MEDSL · Montgomery
- 2024 margin
- Toss-up / Even · D 49.8% · R 49.3%
- 2008→2024 swing
- -5.8pp toward R · 2008: 6.2pp · 2024: 0.5pp
- All cycles
- 2024: D+0.5 2020: D+2.2 2016: R+1.2 2012: D+3.1 2008: D+6.2
Not yet ingested
- Civics
- —
Market trends
- HPI YoY
- ▼ -168.53%
- Current HPI
- 217.1026
- Rent YoY
- ▲ 4.35%
- Metro
- Dayton-Kettering, OH
- State GDP YoY
- ▲ 1.98%
- F500 in state
- 48
Industry mix (Fortune 500 HQ in OH)
| Industry | F500 HQs | Revenue |
|---|---|---|
| Insurance | 3 | $145B |
|
||
| Industrial Machinery | 3 | $49B |
|
||
| Financial Services | 3 | $24B |
|
||
| Consumer Goods | 2 | $93B |
|
||
| Aerospace / Defense | 2 | $47B |
|
||
| Utilities | 2 | $33B |
|
||
Price history
1 event — show timeline
- 2026-05-27 Listed $543,752 Dayton MLS
Cash-flow waterfall
monthlySold comps — $/sqft
last 12 mo · ≤1 miLoading sold comps…