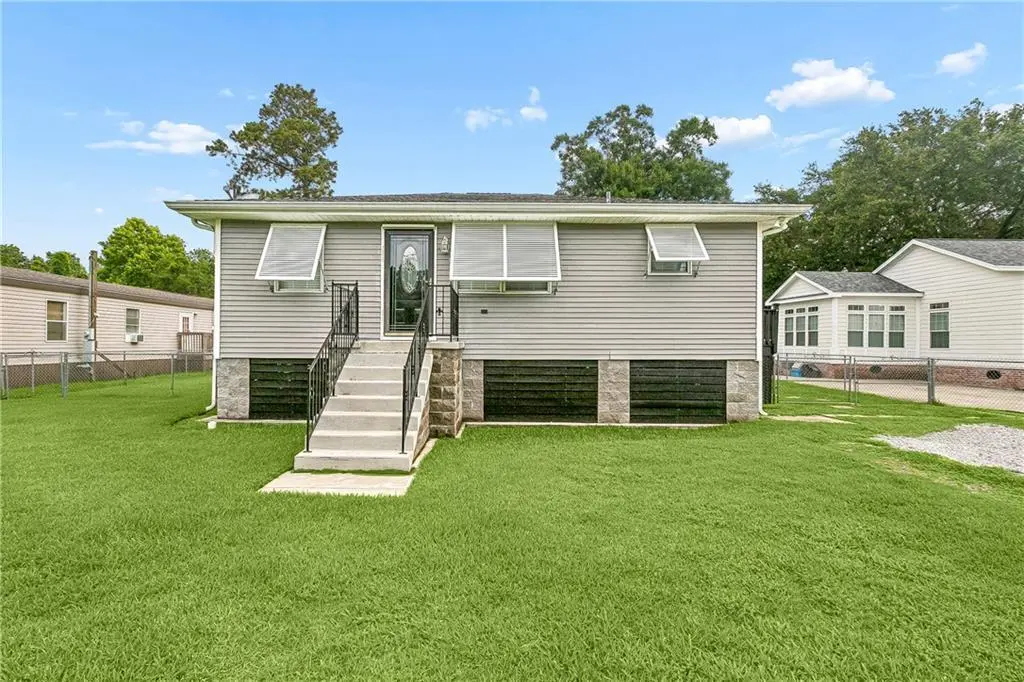
2920 Farmsite Rd · Violet, LA
Flood risk 8/10 · Major
- FEMA flood zone
- X (shaded)
- Chance of flooding over 30 yrs
- 0.6%
- Est. flood insurance / yr
- $507 – $1,088
Fire risk 1/10 · Minimal
- Est. fire insurance / yr
- $1,269 – $2,357
Heat risk 10/10 · Severe
- Hot days now (above 108°F)
- 7 days/yr
- Hot days in 30 yrs
- 21 days/yr
Wind risk 10/10 · Severe
- Chance of severe wind over 30 yrs
- 99.0%
Air-quality risk 2/10 · Minimal
- Unhealthy air days now
- 1 days/yr
- Unhealthy air days in 30 yrs
- 2 days/yr
Risk factors via First Street. Map © Google.
Why this score? — see what drove the C+ grade
The composite is a weighted blend of 9 inputs, each scored 0–100. Each bar is that input's sub-score; the figure is the points it added to the 100-point composite (weight × sub-score).
- Cash flow +20.8/30.0
- ARV discount +14.8/15.0
- DSCR +6.6/10.0
- Schools +5.0/10.0
- 1% rule +4.2/10.0
- Livability +3.0/5.0
- Rent growth +2.5/5.0
- Condition / age +2.5/5.0
- Appreciation +0.8/10.0
$180,000
🖨 Deal sheet 📄 Offer letter ✓ Due diligence
Listing remarks MLS
Welcome to 2920 Farmsite Road, a beautifully updated home offering the perfect blend of modern finishes, functional living space and a spacious outdoor setting in the heart of Violet. Elevated for peace of mind and featuring durable exterior upgrades, this property is move-in ready and designed for comfortable everyday living. Inside, you'll find warm hardwood floors flowing throughout the main living areas and bedrooms, complemented by a fresh neutral color palette and stylish black accents. The spacious living room offers plenty of room for gathering and entertaining, while the adjacent dining area connects seamlessly to the updated kitchen. Featuring abundant cabinetry, granite countertops, stainless steel appliances, a subway tile backsplash and ample storage, the kitchen is both attractive and practical. The primary suite includes a private ensuite bath with a beautifully renovated walk-in shower, while the additional bathroom has been tastefully updated with modern finishes. A dedicated laundry room adds convenience and functionality. Step outside to enjoy the covered patio overlooking an expansive fenced backyard--perfect for weekend barbecues, outdoor entertaining, pets or play. A large storage shed provides additional space for tools, equipment and hobbies. Conveniently located with easy access to local schools, shopping and major roadways, this well-maintained home offers a fantastic opportunity to enjoy updated living with plenty of room to spread out!
Key facts
- Updated home
- Updated kitchen
- Hardwood floors
Tags
Property features AI
Exterior
- Parking: Driveway
- Utilities: Public water; Public sewer
- Home design: Single-story; Raised foundation; Very good condition
- Construction: Vinyl siding; Shingle roof
- Exterior features: City lot; Oversized lot; Lot dimensions approximately 75 x 238
Interior
- Kitchen: Microwave; Oven; Range; Refrigerator
- Bathrooms: 2 full bathrooms
- Heating & cooling: Central heating; Central air conditioning
- Interior features: Ceiling fan(s)
- Laundry & utility: Washer hookup; Dryer hookup
Neighborhood map
What this means for you Summary
Snapshot
- This is a 2-bed/2.0-bath single-family listed at $180k.
Deal economics
- At list price, monthly cash flow is $179 ($2k/yr) — positive.
- The deal already cash-flows at list — no discount required.
- To meet the 1% rule (rent ≥ 1% of price), the offer needs to be $165k (8.1% below list).
- Recommended offer: $165k (8.1% below list) — sets the bar for 1% rule.
Location & tenants
- Location reads 59/100 on livability (#269 in LA) — a working-class tenant base; expect higher turnover. Strengths: cost of living A+, housing A+; Watch: crime F, amenities F, commute F.
- Market conditions: 53 active listings in the ZIP; 112 units permitted in St. Bernard Parish in 2024 (0 in 5+ unit buildings).
Forward outlook
- Local home prices are declining (-3.0%/yr); year-one equity from $1k of loan paydown is wiped out by about $5k of value loss. Plan a longer hold.
- St. Bernard County population projected at +89% by 2050 — long-run rental-demand tailwind backs the buy-and-hold thesis.
Negotiation context
- Only 10 days on market — expect competitive offers; lowballing is unlikely to land.
- 4 sale attempts since 6y ago with the ask held roughly flat each time — persistent listings suggest the price (not the market) is what's stuck; bring a comps-based counter.
- Current owner paid $127k; 42% above their basis — modest negotiation headroom, anchor on the comps not their cost.
Risks & watch-outs
- Watch-outs: flood insurance adds $66/mo.
- Climate carrying-cost: severe flood risk; severe wind risk, 99% chance of damaging wind over 30y; extreme-heat days projected 7→21/yr by 2055 (HVAC capex compounding) — expect insurance premiums to compound above CPI over the hold.
Questions for the listing agent
- What's the actual annual flood-insurance premium (NFIP or private), and is the property in a SFHA with mandatory coverage?
- Is there a deadline driving the sale (1031 exchange, divorce, estate, relocation)? That informs how much negotiation room exists.
- Crime grade is F in this area — have there been break-ins, vandalism, or insurance claims at this property in the last 3 years? What carrier currently insures it and at what premium?
- What's the average days-on-market for RENTAL listings here right now (not sales)? A rising rental-DOM trend means longer vacancies and softer asking-rent achievability than the comps imply.
- What's the recent tenant-quality profile in this submarket — average credit score on applications, eviction rate, late-payment / NSF rate, and stable-employment percentage? A property-management company in the area should have these aggregated.
- How much new for-sale + rental construction is in the pipeline within 1–3 miles? Heavy new supply typically softens prices + rents 12–24 months out; constrained supply supports both.
Investment metrics
- 1% rule
- 0.92% ✗
- Cap rate
- 7.93%
- Cash-on-cash
- 5.85%
- DSCR
- 1.26
- GRM
- 9.1
CMA / ARV
- ARV (on-the-fly)
- $214,914
- Comps found
- 6
Show comp detail 6 sales within ~0.75 mi
| Address | Dist | Beds/Ba | Sqft | Sold | Price | $/sf | Match |
|---|---|---|---|---|---|---|---|
| 2908 South Lake Blvd | 0.18mi | 3/2.0 (+1) | 1,500 (+3%) | 15mo | $220,000 | $147 | 70 |
| 2704 Torres Dr | 0.22mi | 3/2.0 (+1) | 1,253 (-14%) | 3mo | $190,000 | $152 | 59 |
| 2405 Bobolink Dr | 0.60mi | 3/2.0 (+1) | 1,479 (+1%) | 8mo | $129,000 | $87 | 58 |
| 2504 Kingbird Blvd | 0.63mi | 3/2.0 (+1) | 1,464 (+0%) | 15mo | $179,900 | $123 | 53 |
| 909 Bayou Rd | 0.72mi | 3/2.0 (+1) | 1,550 (+6%) | 16mo | $269,000 | $174 | 38 |
| 2009 Redbird Dr | 0.52mi | 3/2.0 (+1) | 1,246 (-15%) | 20mo | $172,500 | $138 | 30 |
Match score weights: distance 35% · size 25% · config 20% · recency 20%. Top-matched comps best support the ARV.
Projected returns pro-forma
-3.0% appreciation · 3.0% rent growth · sell at horizon
- IRR
- -9.7%
- Equity multiple
- 0.65×
- Total profit
- $-17,792
- Equity at exit
- $26,839
- IRR
- -0.3%
- Equity multiple
- 0.98×
- Total profit
- $-975
- Equity at exit
- $15,563
Cash invested: $50,400 (down + closing). Projections, not guarantees.
Landlord ↔ Tenant lean methodology
- Overall (STATE)
- 90 Strongly Landlord-Friendly
- State Louisiana
- 90 Strongly Landlord-Friendly · R+12
- County
- — inherits STATE
- City
- — inherits STATE
ZIP-level market 70092
- Home prices YoY
- -3.7%
- Active inventory
- 53
- Price-to-rent
- 9.1×
Monthly cashflow live
- Estimated rent
- $1,654 medium interval (Pro) →
- Mortgage (P&I)
- −$944
- Tax from tax record
- −$42 /mo · $504/yr
- Insurance
- −$75
- Flood insurance flood zone
- −$66 /mo · $798/yr
- HOA
- −$0
- Vacancy / Maint / Mgmt
- −$347
- Net cashflow
- $179
Break-even live
UW: 25.0% down · 7.5% · 30yr · 1.5% tax · 5.0% vac · 8.0% maint · 8.0% mgmt
Financing live
Cash to close
- Down payment
- $45,000
- Closing costs
- $5,400
- Reserves months
- —
- Total cash needed
- —
Loan-product check · same deal, 3 products live
Conventional
25% down · 7.5% · 30yr
- Down + closing
- —
- Monthly P&I
- —
- Monthly cashflow
- —
- DSCR
- —
- Eligible?
- —
Personal DTI + credit; lowest rate.
DSCR
20% down · 8.5% · 30yr
- Down + closing
- —
- Monthly P&I
- —
- Monthly cashflow
- —
- DSCR
- —
- Eligible?
- —
No personal income docs; deal must DSCR.
Hard money
10% down · 12.0% · 12mo
- Down + closing
- —
- Monthly P&I
- —
- Monthly cashflow
- —
- DSCR
- —
- Eligible?
- —
Short-term bridge; refi at stabilization.
Listing history 8 events
-
2026-06-18days on market $180,000 Active 10 DOM
-
2026-06-17days on market $180,000 Active 9 DOM
-
2026-06-16days on market $180,000 Active 8 DOM
-
2026-06-15days on market $180,000 Active 7 DOM
-
2026-06-13days on market $180,000 Active 5 DOM
-
2026-06-10days on market $180,000 Active 2 DOM
-
2026-06-08remarks 699-char remark
-
2026-06-08$180,000 Active 1 DOM
ⓘ Source: listings_history table (triggers on properties + properties_extension) + one-shot
backfill from property_details.listing_events for pre-trigger history.
Tax reassessment forecast LA · Resets to sale price
- Current annual tax
- $504 · $42/mo
- Projected year-2 tax
- $990 · $82/mo
- Expected delta
- +$486/yr (+$40/mo · 96.3%)
ⓘ Screening estimate from a state-policy table — verify with the county assessor before closing.
Climate risk First Street
- Flood 8/10 Severe FEMA zone X (shaded) · 60% chance over 30 yrs
- Wildfire 1/10 Low
- Heat 10/10 Extreme 7 d/yr ≥108°F today · 21 d/yr by 30 yrs out
- Wind 10/10 Extreme 99% chance of damaging wind over 30 yrs
- Air quality 2/10 Low 1 unhealthy d/yr today · 2 by 30 yrs out
Nearby sold comps map
Loading sold comps map…
Walkable amenities ~0.75 mi
Loading nearby amenities…
Taxation est. · year 1
- Rental income
- $19,849
- − Mortgage interest
- −$10,083
- − Property taxes
- −$504
- − Insurance
- −$1,697
- − Repairs & maintenance
- −$1,588
- − Management
- −$1,588
- − Depreciation
- −$5,236
- Taxable loss
- −$847
- Est. tax savings @ 24.0%
- +$203
- After-tax cash flow
- $2,355/yr
For passive investors: Depreciation is non-cash, so a rental often shows a tax loss while cash-flowing — sheltering income. Rental losses are passive: they offset passive income freely, and up to $25,000/yr can offset ordinary (W-2) income if you actively participate and your MAGI is under $100k (phasing out to $0 by $150k); unused losses carry forward. On sale, claimed depreciation is recaptured at up to 25%, and gains may owe capital-gains tax (a 1031 exchange can defer both). Figures are a year-1 estimate at your 24.0% rate — not tax advice; consult a CPA.
Schools (NCES district)
No district data.
Livability — Violet
- Score
- 59/100
- State rank
- #269
- US rank
- #19722
Category grades
Schools grade is shown separately in the Schools card above.
Census & demographics
- Census place
- Violet, LA
- City population
- 6,784
- Population (ZIP)
- 6,784
Population outlook (St. Bernard County) Hauer SSP2
- Today (2025)
- 66,513 people
- By 2030
- 77,768 · +16.9%
- By 2040
- 101,296 · +52.3%
- By 2050
- 125,770 · +89.1%
- By 2075
- 188,160 · +182.9%
- By 2100
- 239,339 · +259.8%
Race, ethnicity, and origin ACS 2023
- Neighborhood character
- Diverse neighborhood (Simpson 0.60)
- Race & ethnicity
- White 46% Black 43% Hispanic / Latino 9% Two or more races 6% Native American 1%
- Hispanic origin (detail)
- Mexican 1%
- Common ancestry
- Lithuanian 11% Iranian 1% Hispanic 1%
- Foreign-born
- 2% · Canada
- Languages at home
- 97% English-only · Spanish 2%
Political lean MEDSL · St. Bernard
- 2024 margin
- Strong R (+29.3) · D 34.5% · R 63.8% · Other 1.7%
- 2008→2024 swing
- +16.1pp toward D · 2008: -45.4pp · 2024: -29.3pp
- All cycles
- 2024: R+29.3 2020: R+28.5 2016: R+33.4 2012: R+24.7 2008: R+45.4
Not yet ingested
- Civics
- —
Market trends
- HPI YoY
- ▼ -8.36%
- Current HPI
- 218.6728
- Rent YoY
- —
- Metro
- —
- State GDP YoY
- ▲ 3.29%
- F500 in state
- 10
Industry mix (Fortune 500 HQ in LA)
| Industry | F500 HQs | Revenue |
|---|---|---|
| Telecommunications | 2 | $23B |
|
||
| Utilities | 1 | $12B |
|
||
| Wholesale / Distribution | 1 | $5B |
|
||
| Advertising | 1 | $2B |
|
||
Price history
+44.0% since first listed7 events — show timeline
- 2026-06-05 Listed $180,000 AcadianaMLS
- 2026-06-05 Listed $180,000 GSREIN
- 2020-07-01 Sold (Public Records) $127,000 Public Records
- 2020-06-23 Sold (MLS) $127,000 GSREIN
- 2020-04-13 Pending — GSREIN
- 2020-03-23 Listed $125,000 AcadianaMLS
- 2020-03-23 Listed $125,000 GSREIN
Property tax history
-1.7%/yrLatest (2025): $504 · -69.7% YoY. Source: county tax records.
Cash-flow waterfall
monthlySold comps — $/sqft
last 12 mo · ≤1 miLoading sold comps…