 🌊 Lakefront
4632 Carambola Cir N · Coconut Creek, FL
Flood risk 1/10 · Minimal
- FEMA flood zone
- X (unshaded)
- Chance of flooding over 30 yrs
- 0.0%
- Est. flood insurance / yr
- $507 – $1,088
Fire risk 1/10 · Minimal
- Est. fire insurance / yr
- $947 – $1,759
Heat risk 9/10 · Severe
- Hot days now (above 107°F)
- 7 days/yr
- Hot days in 30 yrs
- 26 days/yr
Wind risk 10/10 · Severe
- Chance of severe wind over 30 yrs
- 99.0%
Air-quality risk 3/10 · Minor
- Unhealthy air days now
- 2 days/yr
- Unhealthy air days in 30 yrs
- 3 days/yr
Risk factors via First Street. Map © Google.
Why this score? — see what drove the D- grade
The composite is a weighted blend of 9 inputs, each scored 0–100. Each bar is that input's sub-score; the figure is the points it added to the 100-point composite (weight × sub-score).
- Cash flow +8.9/30.0
- ARV discount +7.5/15.0
- 1% rule +6.0/10.0
- Livability +4.2/5.0
- Schools +4.1/10.0
- DSCR +2.5/10.0
- Condition / age +2.5/5.0
- Rent growth +2.3/5.0
- Appreciation +0.0/10.0
$210,000
🖨 Deal sheet 📄 Offer letter ✓ Due diligence
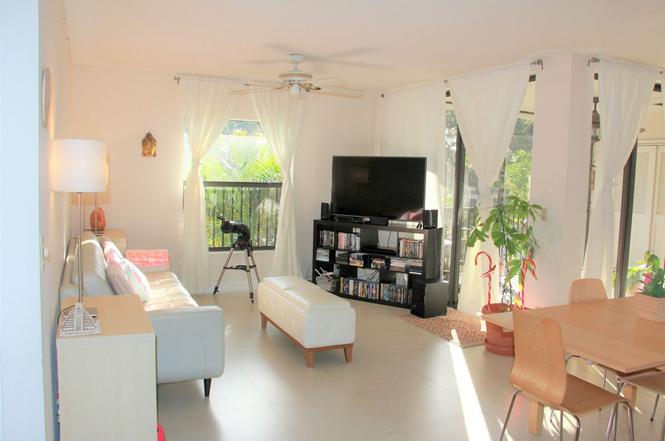
Listing remarks
Beautiful Corner Condo 2BR/2BA Bright, Spacious, and Centrally Located! Welcome to this beautiful and spacious 2-bedroom, 2-bathroom corner unit on the 2nd floor offering 1,233 sq. ft. of total living space (978 sq. ft. under air). With its split floor plan, abundant natural light, and inviting layout, this home is perfect for comfortable living and entertaining. Step inside to find a bright eat-in kitchen and a formal dining area, ideal for gatherings. The large primary suite features an oversized closet, while the living room, dining room, and primary bedroom all open to a large, screened, tiled patio perfect for relaxing and enjoying the Florida breeze. You'll also love the in-unit
Key facts
- Oversized closet
- Split floor plan
- Formal dining area
Tags
Property features AI
Exterior
- Home design: Condo
- Exterior features: Lot approximately 1,233 square feet
Neighborhood map
What this means for you Summary
Snapshot
- This is a 2-bed/2.0-bath condo listed at $210k.
Deal economics
- At list price, monthly cash flow is $-170 ($-2k/yr) — negative.
- The deal already cash-flows at list — no discount required.
- Meets the 1% rule at list price ($2k rent vs $210k).
- Recommended offer: $185k (12.0% below list) — sets the bar for market timing.
- Cap rate 5.3% vs local median 3.7% in Coconut Creek — top-decile yield for the area; either an underpriced asset or a hidden risk that comps aren't pricing in. Stress-test before assuming the spread holds.
Location & tenants
- Location reads 85/100 on livability (#30 in FL, #617 nationally) — a professional / high-income tenant draw. Strengths: commute A+, housing A+, health & safety A+; Watch: amenities F.
- Broward (suburban): math 42% / reading 53% proficiency, ranked #46 of 73 in FL (top 63%) — families likely to look elsewhere, expect single-tenant / working-renter base with shorter leases.
- Market conditions: Rents soft (-0.9%/yr); 326 active listings in the ZIP; 40 comparable units currently listed for rent nearby; rentals at typical pace (median 19d on market — plan ~3-4 weeks tenant-placement turnaround); 2,111 units permitted in Broward County in 2024 (1,265 in 5+ unit buildings).
- At $2,320/mo this rent would consume 49% of the median local household income ($57k/yr) (locally 433% of renters already pay >50% of income on rent) — very limited rent-growth headroom before tenants either downsize or default.
Forward outlook
- Local home prices are declining (-3.0%/yr); year-one equity from $1k of loan paydown is wiped out by about $6k of value loss. Plan a longer hold.
- Broward County population projected at +34% by 2050 — long-run rental-demand tailwind backs the buy-and-hold thesis.
Negotiation context
- It's been on market 248 days — a 12% lower offer ($185k) is reasonable based on typical stale-listing flexibility.
Risks & watch-outs
- Watch-outs: HOA is 24% of rent.
- Climate carrying-cost: severe wind risk, 99% chance of damaging wind over 30y; extreme-heat days projected 7→26/yr by 2055 (HVAC capex compounding) — expect insurance premiums to compound above CPI over the hold.
Questions for the listing agent
- What do current leases actually rent for vs. the listed asking? Can we see a recent rent roll and the last 12 months of T-12 income?
- It's been on market 248 days. Have you received any prior offers? Is the seller open to a 12% concession, seller financing, or rate buy-down credit?
- What does the HOA fee cover, when was the last increase, and are there any pending special assessments or reserve-fund shortfalls?
- Any open or pending special assessments — roof, HVAC, plumbing, elevator, façade? What's the per-unit balance and payoff schedule, and is the seller paying it off at close or rolling it to the buyer?
- Why hasn't it sold? Are there any deal-killer items the seller is aware of (foundation, flood, title, zoning, code violations)?
- Is there a deadline driving the sale (1031 exchange, divorce, estate, relocation)? That informs how much negotiation room exists.
- Schools are B-rated — typically a magnet for longer-tenancy family renters. What's the average tenant stay here, and is there a school-zone premium baked into asking?
- The area grade is low — what's the realistic commute time and amenity access for the typical tenant pool here? Any planned neighborhood developments (good or bad) we should know about?
- This sits on a lake — are riparian / water-frontage rights deeded with the parcel? Any dock permits, shoreline easements, or HOA water-use restrictions?
- What's the documented flood / surge / shoreline-erosion history here (FEMA AND non-FEMA — e.g., storm surge, creek backup, septic-field saturation)?
- Any water-quality or seasonal algae-bloom issues that affect tenant satisfaction or short-term-rental demand?
- What's the average days-on-market for RENTAL listings here right now (not sales)? A rising rental-DOM trend means longer vacancies and softer asking-rent achievability than the comps imply.
- What's the recent tenant-quality profile in this submarket — average credit score on applications, eviction rate, late-payment / NSF rate, and stable-employment percentage? A property-management company in the area should have these aggregated.
- How much new apartment / multifamily construction is in the pipeline within 1–3 miles? Heavy new supply (>2% of stock underway) typically softens rents 12–24 months out; light construction supports rent growth.
Investment metrics
- 1% rule
- 1.10% ✓
- Cap rate
- 5.32%
- Cash-on-cash
- -3.46%
- DSCR
- 0.85
- GRM
- 7.5
CMA / ARV
No comps found within radius.
Projected returns pro-forma
-3.0% appreciation · 0.0% rent growth · sell at horizon
- IRR
- -26.8%
- Equity multiple
- 0.13×
- Total profit
- $-51,266
- Equity at exit
- $31,312
- IRR
- -50.0%
- Equity multiple
- -0.42×
- Total profit
- $-83,317
- Equity at exit
- $18,157
Cash invested: $58,800 (down + closing). Projections, not guarantees.
Landlord ↔ Tenant lean methodology
- Overall (STATE)
- 87 Strongly Landlord-Friendly
- State Florida
- 87 Strongly Landlord-Friendly · R+3
- County
- — inherits STATE
- City
- — inherits STATE
ZIP-level market 33066
- Home prices YoY
- -29.3%
- Rents YoY
- -0.9%
- Active inventory
- 326
- Price-to-rent
- 7.5×
Monthly cashflow live
- Estimated rent
- $2,320 high interval (Pro) →
- Mortgage (P&I)
- −$1,101
- Tax est. 1.5%
- −$262 /mo · $3,150/yr
- Insurance
- −$88
- HOA est. from 2 same-building comps
- −$551
- Vacancy / Maint / Mgmt
- −$487
- Net cashflow
- $-170
Break-even live
UW: 25.0% down · 7.5% · 30yr · 1.5% tax · 5.0% vac · 8.0% maint · 8.0% mgmt
Financing live
Cash to close
- Down payment
- $52,500
- Closing costs
- $6,300
- Reserves months
- —
- Total cash needed
- —
Loan-product check · same deal, 3 products live
Conventional
25% down · 7.5% · 30yr
- Down + closing
- —
- Monthly P&I
- —
- Monthly cashflow
- —
- DSCR
- —
- Eligible?
- —
Personal DTI + credit; lowest rate.
DSCR
20% down · 8.5% · 30yr
- Down + closing
- —
- Monthly P&I
- —
- Monthly cashflow
- —
- DSCR
- —
- Eligible?
- —
No personal income docs; deal must DSCR.
Hard money
10% down · 12.0% · 12mo
- Down + closing
- —
- Monthly P&I
- —
- Monthly cashflow
- —
- DSCR
- —
- Eligible?
- —
Short-term bridge; refi at stabilization.
Rent comps 40 comps
| Address | Beds | Baths | Sqft | Rent | $/sqft | DOM | Units | Dist |
|---|---|---|---|---|---|---|---|---|
| 1877 Carambola Cir N Coconut Creek, FL | 2.0 | 2.0 | 978 | $2,300 | $2.35 | 10d | 1 | 0.08mi |
| 1877 Carambola Cir N Unit 1877 Coconut Creek, FL | 2.0 | 2.0 | 978 | $2,300 | $2.35 | 24d | 1 | 0.08mi |
| 2678 Carambola Cir N #1762 Coconut Creek, FL | 2.0 | 2.0 | 1120 | $2,600 | $2.32 | 24d | 1 | 0.11mi |
| 2676 Carambola Cir N Unit N Coconut Creek, FL | 2.0 | 2.0 | 978 | $2,250 | $2.30 | 3d | 1 | 0.11mi |
| 2616 Carambola Cir N #1702 Coconut Creek, FL | 2.0 | 2.0 | 1106 | $2,750 | $2.49 | 24d | 1 | 0.14mi |
| 2649 Carambola Cir N Unit 1735 Coral Springs, FL | 3.0 | 2.0 | 1120 | $3,000 | $2.68 | 24d | 1 | 0.14mi |
| 2649 Carambola Cir N Coral Springs, FL | 3.0 | 2.0 | 1120 | $2,900 | $2.59 | 7d | 1 | 0.14mi |
| 2511 Carambola Cir N #18102 Coconut Creek, FL | 2.0 | 2.0 | 1106 | $2,650 | $2.40 | 20d | 1 | 0.15mi |
| 2738 Carambola Cir S #1913 Coconut Creek, FL | 3.0 | 2.0 | 1120 | $2,300 | $2.05 | 24d | 1 | 0.15mi |
| 2923 Carambola Cir S Coconut Creek, FL | 3.0 | 2.0 | 1093 | $2,500 | $2.29 | 2d | 1 | 0.21mi |
| 4484 Carambola Cir S #27321 Coconut Creek, FL | 2.0 | 2.0 | 962 | $2,000 | $2.08 | 24d | 1 | 0.22mi |
| 4467 Carambola Cir S Coconut Creek, FL | 3.0 | 2.0 | 1115 | $2,375 | $2.13 | 7d | 1 | 0.26mi |
| 2923 Carambola Cir N Unit 2923 Coconut Creek, FL | 3.0 | 2.0 | 1093 | $2,500 | $2.29 | 10d | 1 | 0.34mi |
| 2902 Carambola Cir N Unit 2902 Coconut Creek, FL | 2.0 | 2.0 | 955 | $2,049 | $2.15 | 24d | 1 | 0.37mi |
| 3929 Carambola Cir N #2902 Coconut Creek, FL | 2.0 | 2.0 | 955 | $2,049 | $2.15 | 24d | 1 | 0.44mi |
| 2900 NW 42nd Ave Unit A103 Coconut Creek, FL | 2.0 | 2.0 | 970 | $2,100 | $2.16 | 24d | 1 | 0.50mi |
| 2900 NW 42nd Ave Unit A103 Coconut Creek, FL | 2.0 | 2.0 | 970 | $2,100 | $2.16 | 22d | 1 | 0.50mi |
| 2900 NW 42nd Ave Unit A110 Coconut Creek, FL | 2.0 | 2.0 | 930 | $2,000 | $2.15 | 5d | 1 | 0.51mi |
| 3800 Coral Tree Cir Coconut Creek, FL | 1.0–3.0 | 1.0–2.5 | 1124 | $2,298 | $2.04 | 1d | 6 | 0.52mi |
| 3857 Coral Tree Cir #204 Coconut Creek, FL | 1.0 | 1.0 | 764 | $1,850 | $2.42 | 24d | 1 | 0.58mi |
| 3427 NW 47th Ave #3190 Coconut Creek, FL | 2.0 | 2.0 | 955 | $2,300 | $2.41 | 7d | 1 | 0.62mi |
| 3427 NW 47th Ave #3190 Coconut Creek, FL | 2.0 | 2.0 | 955 | $2,300 | $2.41 | 22d | 1 | 0.62mi |
| 3858 Coral Tree Cir #205 Coconut Creek, FL | 1.0 | 1.0 | 764 | $1,850 | $2.42 | 3d | 1 | 0.62mi |
| 3859 Coral Tree Cir #308 Coconut Creek, FL | 1.0 | 1.0 | 764 | $1,700 | $2.23 | 24d | 1 | 0.63mi |
| 3870 Lyons Rd Unit 209-8 Coconut Creek, FL | 2.0 | 2.0 | 1112 | $2,175 | $1.96 | 24d | 1 | 0.73mi |
| 4142 Cocoplum Cir Coconut Creek, FL | 1.0–3.0 | 1.0–2.5 | 1129 | $2,223 | $1.97 | 1d | 17 | 0.74mi |
| 3830 Lyons Rd Unit 110-3 Coconut Creek, FL | 1.0 | 1.0 | 798 | $1,675 | $2.10 | 24d | 1 | 0.75mi |
| 3933 Cocoplum Cir #3518 Coconut Creek, FL | 2.0 | 2.0 | 982 | $2,200 | $2.24 | 18d | 1 | 0.80mi |
| 3848 Lyons Rd Unit 205-1 Coconut Creek, FL | 2.0 | 2.0 | 1112 | $2,175 | $1.96 | 24d | 1 | 0.80mi |
| 2342 NW 36th Ave #2342 Coconut Creek, FL | 2.0 | 2.5 | 1068 | $2,395 | $2.24 | 24d | 1 | 0.80mi |
| 2342 NW 36th Ave #2342 Coconut Creek, FL | 2.0 | 2.5 | 1068 | $2,395 | $2.24 | 7d | 1 | 0.80mi |
| 3831 Cocoplum Cir #3592 Coconut Creek, FL | 3.0 | 2.0 | 1115 | $2,450 | $2.20 | 15d | 1 | 0.84mi |
| 3757 Cocoplum Cir #3567 Coconut Creek, FL | 2.0 | 2.0 | 982 | $2,100 | $2.14 | 24d | 1 | 0.85mi |
| 3287 Cocoplum Cir #3321 Coconut Creek, FL | 3.0 | 2.0 | 1100 | $2,500 | $2.27 | 17d | 1 | 0.86mi |
| 3439 Cocoplum Cir #3420 Coconut Creek, FL | 2.0 | 2.0 | 982 | $2,250 | $2.29 | 7d | 1 | 0.90mi |
| 4854 Fishermans Dr Coconut Creek, FL | 1.0–2.0 | 1.0–2.0 | 800 | $2,400 | $3.00 | 1d | 13 | 0.91mi |
| 3781 Cocoplum Cir #3579 Coconut Creek, FL | 2.0 | 2.0 | 982 | $2,300 | $2.34 | 18d | 1 | 0.94mi |
| 5100 W Sample Rd Margate, FL | 1.0–2.0 | 1.0–2.0 | 975 | $2,321 | $2.38 | 3d | 16 | 1.02mi |
| 2474 NW 49th Ter #766 Coconut Creek, FL | 2.0 | 2.0 | 974 | $2,300 | $2.36 | 12d | 1 | 1.09mi |
| 2486 NW 49th Ter #762 Coconut Creek, FL | 3.0 | 2.0 | 1116 | $2,350 | $2.11 | 7d | 1 | 1.09mi |
HOA detail condo
- Monthly dues
- $0 · $0/yr
- Assessments
- None detected in remarks — confirm with the listing agent.
Listing history 13 events
-
2026-06-18days on market $210,000 Active 248 DOM
-
2026-06-17days on market $210,000 Active 247 DOM
-
2026-06-16days on market $210,000 Active 246 DOM
-
2026-06-15days on market $210,000 Active 245 DOM
-
2026-06-13days on market $210,000 Active 243 DOM
-
2026-06-09days on market $210,000 Active 239 DOM
-
2026-06-07days on market $210,000 Active 237 DOM
-
2026-06-04days on market $210,000 Active 234 DOM
-
2026-06-03days on market $210,000 Active 233 DOM
-
2026-06-02days on market $210,000 Active 232 DOM
-
2026-06-01days on market $210,000 Active 231 DOM
-
2026-05-31days on market $210,000 Active 230 DOM
-
2025-10-13$210,000 Active
ⓘ Source: listings_history table (triggers on properties + properties_extension) + one-shot
backfill from property_details.listing_events for pre-trigger history.
Climate risk First Street
- Flood 1/10 Low FEMA zone X (unshaded) · 0% chance over 30 yrs
- Wildfire 1/10 Low
- Heat 9/10 Extreme 7 d/yr ≥107°F today · 26 d/yr by 30 yrs out
- Wind 10/10 Extreme 99% chance of damaging wind over 30 yrs
- Air quality 3/10 Moderate 2 unhealthy d/yr today · 3 by 30 yrs out
Nearby sold comps map
Loading sold comps map…
Walkable amenities ~0.75 mi
Loading nearby amenities…
Taxation est. · year 1
- Rental income
- $27,835
- − Mortgage interest
- −$11,763
- − Property taxes
- −$3,150
- − Insurance
- −$1,050
- − Repairs & maintenance
- −$2,227
- − Management
- −$2,227
- − HOA
- −$6,612
- − Depreciation
- −$6,109
- Taxable loss
- −$5,303
- Est. tax savings @ 24.0%
- +$1,273
- After-tax cash flow
- $-765/yr
For passive investors: Depreciation is non-cash, so a rental often shows a tax loss while cash-flowing — sheltering income. Rental losses are passive: they offset passive income freely, and up to $25,000/yr can offset ordinary (W-2) income if you actively participate and your MAGI is under $100k (phasing out to $0 by $150k); unused losses carry forward. On sale, claimed depreciation is recaptured at up to 25%, and gains may owe capital-gains tax (a 1031 exchange can defer both). Figures are a year-1 estimate at your 24.0% rate — not tax advice; consult a CPA.
Schools (NCES district)
- District
- Broward
- NCES district ID
- 1200180
- Math proficiency
- 42% ▼ -18.00%
- Reading proficiency
- 53% ▼ -5.00%
- Median HH income
- $52,139
- Composite
- 40.88/100
- National rank
- #3621
- State rank
- #46 of 73 in FL
Livability — Coconut Creek
- Score
- 85/100
- State rank
- #30
- US rank
- #617
Category grades
Schools grade is shown separately in the Schools card above.
Census & demographics
- Census place
- Coconut Creek, FL
- County
- Broward County · 1,963,430 people
- City population
- 50,557
- Metro
- Miami-Fort Lauderdale-Pompano Beach, FL
- Population (ZIP)
- 16,719
- Household income
- $57,051
- Rent vs Own
- Severe rent burden
- 433.0
Population outlook (Broward County) Hauer SSP2
- Today (2025)
- 2,207,033 people
- By 2030
- 2,360,704 · +7.0%
- By 2040
- 2,661,208 · +20.6%
- By 2050
- 2,946,698 · +33.5%
- By 2075
- 3,602,273 · +63.2%
- By 2100
- 3,970,984 · +79.9%
Race, ethnicity, and origin ACS 2023
- Neighborhood character
- Diverse neighborhood (Simpson 0.62)
- Race & ethnicity
- White 56% Hispanic / Latino 23% Two or more races 20% Black 11% Asian 4%
- Hispanic origin (detail)
- Mexican 1% Puerto Rican 3% Cuban 3%
- Common ancestry
- Scotch-Irish 4% Romanian 4% Italian 2%
- Foreign-born
- 33% · Canada, Jamaica, Vietnam
- Languages at home
- 65% English-only · Spanish 19% Other Indo-European 7% French/Haitian/Cajun 3%
Political lean MEDSL · Broward
- 2024 margin
- D (+17.0) · D 58.0% · R 41.0%
- 2008→2024 swing
- -17.8pp toward R · 2008: 34.7pp · 2024: 17.0pp
- All cycles
- 2024: D+17.0 2020: D+29.8 2016: D+35.0 2012: D+34.9 2008: D+34.7
Not yet ingested
- Civics
- —
Market trends
- HPI YoY
- ▼ -121.75%
- Current HPI
- 293.3769
- Rent YoY
- ▼ -0.95%
- Metro
- Miami-Fort Lauderdale-Pompano Beach, FL
- State GDP YoY
- ▲ 3.28%
- F500 in state
- 36
Industry mix (Fortune 500 HQ in FL)
| Industry | F500 HQs | Revenue |
|---|---|---|
| Industrial Technology | 2 | $29B |
|
||
| Insurance | 2 | $17B |
|
||
| Retail | 1 | $60B |
|
||
| Technology Distribution | 1 | $58B |
|
||
| Homebuilding | 1 | $35B |
|
||
| Technology Manufacturing | 1 | $35B |
|
||
Price history
1 event — show timeline
- 2025-10-13 Listed $210,000 ForSaleByOwner.com
Cash-flow waterfall
monthlySold comps — $/sqft
last 12 mo · ≤1 miLoading sold comps…