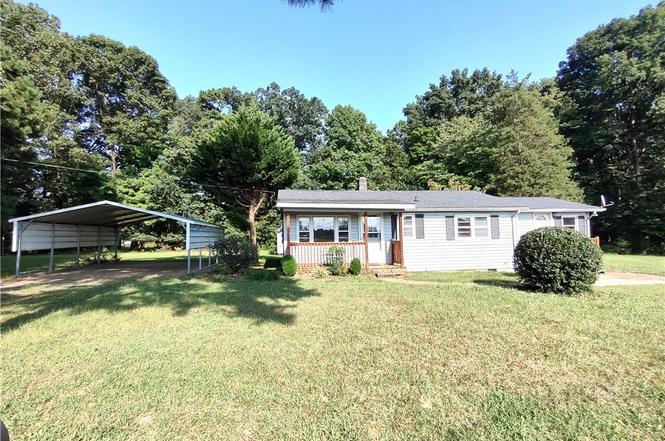
53 Old E C Womack Rd · Sanford, NC
Flood risk 1/10 · Minimal
- FEMA flood zone
- X (unshaded)
- Chance of flooding over 30 yrs
- 0.0%
- Est. flood insurance / yr
- $507 – $1,088
Fire risk 5/10 · Moderate
- Est. fire insurance / yr
- $906 – $1,684
Heat risk 6/10 · Moderate
- Hot days now (above 105°F)
- 7 days/yr
- Hot days in 30 yrs
- 17 days/yr
Wind risk 6/10 · Moderate
- Chance of severe wind over 30 yrs
- 57.0%
Air-quality risk 2/10 · Minimal
- Unhealthy air days now
- 1 days/yr
- Unhealthy air days in 30 yrs
- 1 days/yr
Risk factors via First Street. Map © Google.
Why this score? — see what drove the C+ grade
The composite is a weighted blend of 9 inputs, each scored 0–100. Each bar is that input's sub-score; the figure is the points it added to the 100-point composite (weight × sub-score).
- Cash flow +22.0/30.0
- ARV discount +15.0/15.0
- DSCR +7.0/10.0
- 1% rule +4.8/10.0
- Rent growth +3.7/5.0
- Livability +3.6/5.0
- Schools +3.0/10.0
- Condition / age +2.5/5.0
- Appreciation +0.0/10.0
$157,700
🖨 Deal sheet (PDF) 📄 Offer letter ✓ Due diligence
Listing remarks
Come one come all - first time buyers, investors, those wanting to down size, or how about those who want to get away from city life and move to the country. Don't let this little house fool you. It's just off Buckhorn Rd sitting on 1.5+ acres. With some love and care this cutie pie could be a super nice home! If you've been looking for a home in todays market then you know its hard to find a home sitting on 1.52 acres under 200k. Yes this house needs work, but you can soon call it home and get started on its redesign. living room, 2 bedrooms per septic permit, believe it or not it has 2 baths, laundry in bathroom, kitchen and open area that could be used as a living room/ flex space/ you
Key facts
- 1.5 acres
- 1.52 acre lot
- 2 parking spots
Tags
Property features AI
Exterior
- Parking: 2 covered parking spaces; 2-car carport
- Utilities: Public water; Holding tank or septic tank for sewer
- Home design: Single-family residence; Residential property
- Construction: Frame construction
- Exterior features: Lot is approximately 1.52 acres; Zoned residential
Interior
- Kitchen: Range; Refrigerator
- Bedrooms: 5 total rooms
- Flooring: Vinyl flooring; Carpet flooring
- Bathrooms: 2 full bathrooms
- Heating & cooling: Heat pump heating
- Interior features: Range; Refrigerator; No fireplace
Neighborhood map
What this means for you Summary
Snapshot
- This is a 2-bed/2.0-bath single-family listed at $158k.
Deal economics
- At list price, monthly cash flow is $250 ($3k/yr) — positive.
- The deal already cash-flows at list — no discount required.
- To meet the 1% rule (rent ≥ 1% of price), the offer needs to be $154k (2.5% below list).
- Recommended offer: $139k (12.0% below list) — sets the bar for market timing.
- Cap rate 8.2% vs local median 3.6% in Sanford — top-decile yield for the area; either an underpriced asset or a hidden risk that comps aren't pricing in. Stress-test before assuming the spread holds.
Location & tenants
- Location reads 72/100 on livability (#92 in NC) — a middle-class / working-renter tenant base. Strengths: cost of living A+, housing A+, health & safety A+; Watch: employment D, crime D-, commute F.
- Lee County Schools (rural): math 31% / reading 39% proficiency, ranked #131 of 178 in NC (top 74%) — families likely to look elsewhere, expect single-tenant / working-renter base with shorter leases.
- Zoned schools: East Lee Middle (math 21% / reading 37%, grade F, #350 of 475 statewide, top 74%, 531 students, 71% FRL); Lee County High (math 39% / reading 44%, grade F, #381 of 535 statewide, top 72%, 1,508 students, 60% FRL).
- Market conditions: Rents rising fast (+4.7%/yr); 528 active listings in the ZIP; 602 units permitted in Lee County in 2024 (0 in 5+ unit buildings).
- This rent runs 30% of the median local income ($61k/yr) — at the standard rent-burdened threshold; future hikes will face affordability resistance.
Forward outlook
- Local home prices are declining (-3.0%/yr); year-one equity from $1k of loan paydown is wiped out by about $5k of value loss. Plan a longer hold.
- Lee County population projected at +8% by 2050 — modest demand growth; plan on rents tracking national, not racing it.
Negotiation context
- It's been on market 224 days — a 12% lower offer ($139k) is reasonable based on typical stale-listing flexibility.
- 4 sale attempts; this cycle's ask has dropped $30k (16%) from the opening price — seller is motivated, your offer sets the floor, not the list.
- Current owner paid $25k; list at $158k implies a 531% gain — meaningful room to come down on a strong offer.
Risks & watch-outs
- Climate carrying-cost: major wind risk, 57% chance of damaging wind over 30y; moderate wildfire risk; extreme-heat days projected 7→17/yr by 2055 (HVAC capex compounding) — expect insurance premiums to compound above CPI over the hold.
Questions for the listing agent
- It's been on market 224 days. Have you received any prior offers? Is the seller open to a 12% concession, seller financing, or rate buy-down credit?
- Built in 1962 — when were the roof, HVAC, electrical panel, plumbing, and water heater last replaced?
- Why hasn't it sold? Are there any deal-killer items the seller is aware of (foundation, flood, title, zoning, code violations)?
- Is there a deadline driving the sale (1031 exchange, divorce, estate, relocation)? That informs how much negotiation room exists.
- Schools are F-rated, which usually means shorter tenancies and higher turnover. Who's the typical renter profile here, and what's been the actual vacancy rate?
- Crime grade is D in this area — have there been break-ins, vandalism, or insurance claims at this property in the last 3 years? What carrier currently insures it and at what premium?
- What's the average days-on-market for RENTAL listings here right now (not sales)? A rising rental-DOM trend means longer vacancies and softer asking-rent achievability than the comps imply.
- What's the recent tenant-quality profile in this submarket — average credit score on applications, eviction rate, late-payment / NSF rate, and stable-employment percentage? A property-management company in the area should have these aggregated.
- How much new for-sale + rental construction is in the pipeline within 1–3 miles? Heavy new supply typically softens prices + rents 12–24 months out; constrained supply supports both.
Investment metrics
- 1% rule
- 0.98% ✗
- Cap rate
- 8.20%
- Cash-on-cash
- 6.80%
- DSCR
- 1.30
- GRM
- 8.5
CMA / ARV
- ARV (on-the-fly)
- $211,768
- Comps found
- 1
Show comp detail 1 sale within ~0.75 mi
| Address | Dist | Beds/Ba | Sqft | Sold | Price | $/sf | Match |
|---|---|---|---|---|---|---|---|
| 4662 Buckhorn Rd | 0.43mi | 2/1.0 | 900 (-12%) | 17mo | $185,000 | $206 | 42 |
Match score weights: distance 35% · size 25% · config 20% · recency 20%. Top-matched comps best support the ARV.
Projected returns pro-forma
-3.0% appreciation · 4.66% rent growth · sell at horizon
- IRR
- -4.2%
- Equity multiple
- 0.84×
- Total profit
- $-7,060
- Equity at exit
- $23,514
- IRR
- 7.1%
- Equity multiple
- 1.57×
- Total profit
- $25,242
- Equity at exit
- $13,635
Cash invested: $44,156 (down + closing). Projections, not guarantees.
Landlord ↔ Tenant lean methodology
- Overall (STATE)
- 85 Strongly Landlord-Friendly
- State North Carolina
- 85 Strongly Landlord-Friendly · R+3
- County
- — inherits STATE
- City
- — inherits STATE
ZIP-level market 27330
- Home prices YoY
- -19.4%
- Rents YoY
- 4.7%
- Active inventory
- 528
- Price-to-rent
- 8.5×
Monthly cashflow live
- Estimated rent
- $1,538 medium interval (Pro) →
- Mortgage (P&I)
- −$827
- Tax from tax record
- −$72 /mo · $867/yr
- Insurance
- −$66
- HOA
- −$0
- Vacancy / Maint / Mgmt
- −$323
- Net cashflow
- $250
Break-even live
Sensitivity live
| Price | -10% $339 | -5% $295 | +0% $250 | +5% $206 | +10% $161 |
|---|---|---|---|---|---|
| Rent | -10% $129 | -5% $189 | +0% $250 | +5% $311 | +10% $372 |
| Rate | -1.0pp $330 | -0.5pp $290 | base $250 | +0.5pp $209 | +1.0pp $168 |
UW: 25.0% down · 7.5% · 30yr · 1.5% tax · 5.0% vac · 8.0% maint · 8.0% mgmt
Financing live
Cash to close
- Down payment
- $39,425
- Closing costs
- $4,731
- Reserves months
- —
- Total cash needed
- —
Loan-product check · same deal, 3 products live
Conventional
25% down · 7.5% · 30yr
- Down + closing
- —
- Monthly P&I
- —
- Monthly cashflow
- —
- DSCR
- —
- Eligible?
- —
Personal DTI + credit; lowest rate.
DSCR
20% down · 8.5% · 30yr
- Down + closing
- —
- Monthly P&I
- —
- Monthly cashflow
- —
- DSCR
- —
- Eligible?
- —
No personal income docs; deal must DSCR.
Hard money
10% down · 12.0% · 12mo
- Down + closing
- —
- Monthly P&I
- —
- Monthly cashflow
- —
- DSCR
- —
- Eligible?
- —
Short-term bridge; refi at stabilization.
Listing history 31 events
-
2026-06-21days on market $157,700 Active 224 DOM
-
2026-06-19days on market $157,700 Active 222 DOM
-
2026-06-18days on market $157,700 Active 221 DOM
-
2026-06-17days on market $157,700 Active 220 DOM
-
2026-06-16days on market $157,700 Active 219 DOM
-
2026-06-15days on market $157,700 Active 218 DOM
-
2026-06-14days on market $157,700 Active 216 DOM
-
2026-06-13days on market $157,700 Active 215 DOM
-
2026-06-10days on market $157,700 Active 213 DOM
-
2026-06-09days on market $157,700 Active 212 DOM
-
2026-06-08days on market $157,700 Active 211 DOM
-
2026-06-07days on market $157,700 Active 210 DOM
-
2026-06-05days on market $157,700 Active 207 DOM
-
2026-06-03days on market $157,700 Active 206 DOM
-
2026-06-02days on market $157,700 Active 205 DOM
-
2026-06-01days on market $157,700 Active 204 DOM
-
2026-05-31days on market $157,700 Active 203 DOM
-
2026-05-30days on market $157,700 Active 202 DOM
-
2026-05-02status Active
-
2026-05-02price $157,700
-
2026-03-30status Active
-
2026-03-14status Pending
-
2026-03-04price $167,700
-
2025-12-23price $177,700
-
2025-09-28status Active
-
2025-09-13status Pending
-
2025-09-05$187,700 Active
-
2006-09-12soldstatus $25,000
-
2006-04-27soldstatus $33,500
-
2001-01-23soldstatus $37,000
-
1998-09-14soldstatus $20,000
ⓘ Source: listings_history table (triggers on properties + properties_extension) + one-shot
backfill from property_details.listing_events for pre-trigger history.
Tax reassessment forecast NC · Resets to sale price
- Current annual tax
- $867 · $72/mo
- Projected year-2 tax
- $1,293 · $108/mo
- Expected delta
- +$426/yr (+$35/mo · 49.1%)
ⓘ Screening estimate from a state-policy table — verify with the county assessor before closing.
Climate risk First Street
- Flood 1/10 Low FEMA zone X (unshaded) · 0% chance over 30 yrs
- Wildfire 5/10 Major
- Heat 6/10 Major 7 d/yr ≥105°F today · 17 d/yr by 30 yrs out
- Wind 6/10 Major 57% chance of damaging wind over 30 yrs
- Air quality 2/10 Low 1 unhealthy d/yr today · 1 by 30 yrs out
Nearby sold comps map
Loading sold comps map…
Walkable amenities ~0.75 mi
Loading nearby amenities…
Taxation est. · year 1
- Rental income
- $18,459
- − Mortgage interest
- −$8,834
- − Property taxes
- −$867
- − Insurance
- −$788
- − Repairs & maintenance
- −$1,477
- − Management
- −$1,477
- − Depreciation
- −$4,588
- Taxable income
- $428
- Est. tax owed @ 24.0%
- −$103
- After-tax cash flow
- $2,900/yr
For passive investors: Depreciation is non-cash, so a rental often shows a tax loss while cash-flowing — sheltering income. Rental losses are passive: they offset passive income freely, and up to $25,000/yr can offset ordinary (W-2) income if you actively participate and your MAGI is under $100k (phasing out to $0 by $150k); unused losses carry forward. On sale, claimed depreciation is recaptured at up to 25%, and gains may owe capital-gains tax (a 1031 exchange can defer both). Figures are a year-1 estimate at your 24.0% rate — not tax advice; consult a CPA.
Schools (NCES district)
- District
- Lee County Schools
- NCES district ID
- 3702560
- Math proficiency
- 31% ▼ -6.00%
- Reading proficiency
- 39% ▬ 0.00%
- Median HH income
- $45,300
- Composite
- 29.87/100
- National rank
- #6403
- State rank
- #131 of 178 in NC
Livability — Sanford
- Score
- 72/100
- State rank
- #92
- US rank
- #6134
Category grades
Schools grade is shown separately in the Schools card above.
Census & demographics
- County
- Lee County · 76,725 people
- City population
- 76,725
- Metro
- Sanford, NC
- Population (ZIP)
- 39,778
- Household income
- $61,300
- Rent vs Own
- Severe rent burden
- 928.0
Population outlook (Lee County) Hauer SSP2
- Today (2025)
- 63,008 people
- By 2030
- 64,443 · +2.3%
- By 2040
- 66,898 · +6.2%
- By 2050
- 68,310 · +8.4%
- By 2075
- 70,920 · +12.6%
- By 2100
- 70,402 · +11.7%
Race, ethnicity, and origin ACS 2023
- Neighborhood character
- Diverse neighborhood (Simpson 0.63)
- Race & ethnicity
- White 54% Hispanic / Latino 21% Black 19% Two or more races 10% Asian 1%
- Hispanic origin (detail)
- Mexican 12% Puerto Rican 2%
- Common ancestry
- Slovak 4% Serbian 2% Italian 1%
- Foreign-born
- 10% · Canada
- Languages at home
- 81% English-only · Spanish 17%
Political lean MEDSL · Lee
- 2024 margin
- R (+17.5) · D 40.8% · R 58.3%
- 2008→2024 swing
- -9.1pp toward R · 2008: -8.4pp · 2024: -17.5pp
- All cycles
- 2024: R+17.5 2020: R+14.9 2016: R+13.2 2012: R+10.2 2008: R+8.4
Not yet ingested
- Civics
- —
Market trends
- HPI YoY
- ▼ -72.62%
- Current HPI
- 302.3589
- Rent YoY
- ▲ 4.66%
- Metro
- Sanford, NC
- State GDP YoY
- ▲ 3.28%
- F500 in state
- 26
Industry mix (Fortune 500 HQ in NC)
| Industry | F500 HQs | Revenue |
|---|---|---|
| Financial Services | 2 | $213B |
|
||
| Retail | 2 | $95B |
|
||
| Industrial Conglomerate | 1 | $38B |
|
||
| Metals / Steel | 1 | $35B |
|
||
| Utilities | 1 | $30B |
|
||
| Industrial Machinery | 1 | $19B |
|
||
Price history
+688.5% since first listed13 events — show timeline
- 2026-05-02 Relisted — LPRMLS
- 2026-05-02 Price Changed $157,700 LPRMLS
- 2026-03-30 Relisted — LPRMLS
- 2026-03-14 Pending — LPRMLS
- 2026-03-04 Price Changed $167,700 LPRMLS
- 2025-12-23 Price Changed $177,700 LPRMLS
- 2025-09-28 Relisted — LPRMLS
- 2025-09-13 Pending — LPRMLS
- 2025-09-05 Listed $187,700 LPRMLS
- 2006-09-12 Sold (Public Records) $25,000 Public Records
- 2006-04-27 Sold (Public Records) $33,500 Public Records
- 2001-01-23 Sold (Public Records) $37,000 Public Records
- 1998-09-14 Sold (Public Records) $20,000 Public Records
Property tax history
+4.7%/yrLatest (2025): $867 · +3.0% YoY. Source: county tax records.
Cash-flow waterfall
monthlySold comps — $/sqft
last 12 mo · ≤1 miLoading sold comps…