 6-Plex
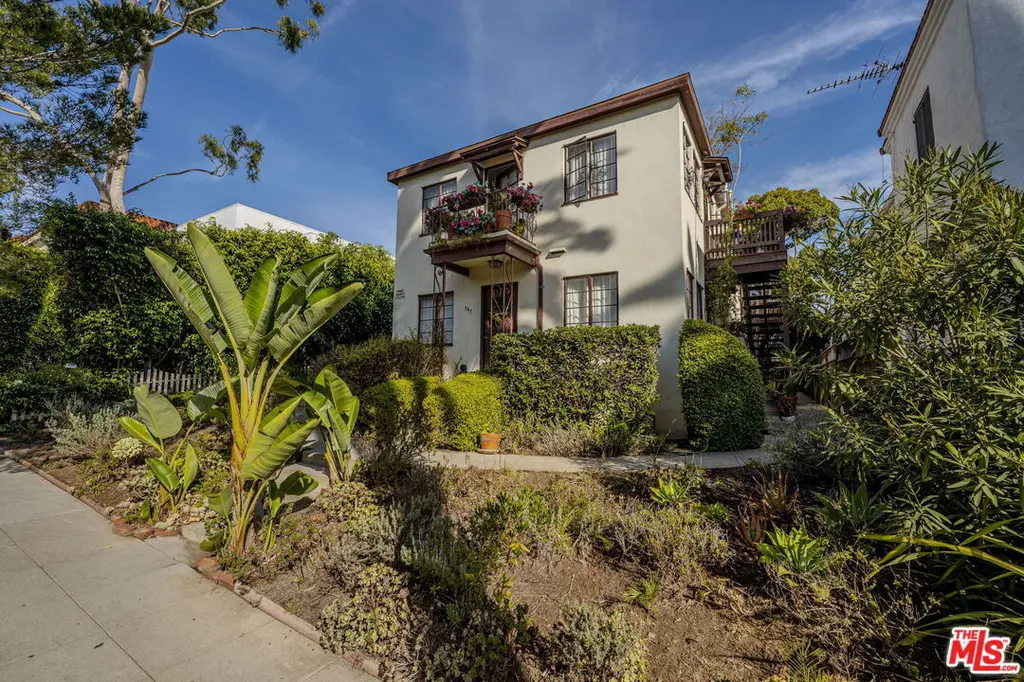
947 17th St · Santa Monica, CA
Flood risk 1/10 · Minimal
- FEMA flood zone
- X (unshaded)
- Chance of flooding over 30 yrs
- 0.0%
- Est. flood insurance / yr
- $507 – $1,088
Fire risk 1/10 · Minimal
- Est. fire insurance / yr
- $659 – $1,223
Heat risk 6/10 · Moderate
- Hot days now (above 83°F)
- 7 days/yr
- Hot days in 30 yrs
- 20 days/yr
Wind risk 1/10 · Minimal
- Chance of severe wind over 30 yrs
- —
Air-quality risk 4/10 · Minor
- Unhealthy air days now
- 5 days/yr
- Unhealthy air days in 30 yrs
- 6 days/yr
Risk factors via First Street. Map © Google.
Why this score? — see what drove the B- grade
The composite is a weighted blend of 9 inputs, each scored 0–100. Each bar is that input's sub-score; the figure is the points it added to the 100-point composite (weight × sub-score).
- Cash flow +26.4/30.0
- DSCR +9.0/10.0
- 1% rule +6.2/10.0
- Schools +6.2/10.0
- Appreciation +4.9/10.0
- ARV discount +4.4/15.0
- Livability +3.6/5.0
- Rent growth +2.5/5.0
- Condition / age +2.5/5.0
$2,695,000
🖨 Deal sheet 📄 Offer letter ✓ Due diligence
Multi-family units
County records classify this as Multi-Family (5+ Unit). Listing-text estimate: 6 units. confirmed
5+ unit building — per-unit beds/baths from public records are typically unavailable; the breakdown below (if shown) is an estimate from the listing text.
Listing remarks MLS
Charming 6-unit property with expansive grounds and five covered parking spaces. Each unit has been tastefully updated, blending vintage charm with modern conveniences like dishwashers in most units. All units are at market rent, and the building features shared laundry. With strong financials and excellent income potential, this well-maintained Santa Monica gem is primed for a savvy investor to step in and maximize returns.
Key facts
- Shared laundry
- Covered parking
- Income potential
Tags
Neighborhood map
What this means for you Summary
Snapshot
- This is a 6 × 8-bed/6.0-bath units multifamily listed at $2.69M.
Deal economics
- At list price, monthly cash flow is $7k ($84k/yr) — positive. Per door: $1k/mo.
- The deal already cash-flows at list — no discount required.
- Meets the 1% rule at list price ($30k rent vs $2.69M).
- Recommended offer: $2.61M (3.0% below list) — sets the bar for market timing.
- Cap rate 9.4% vs local median 1.2% in Santa Monica — top-decile yield for the area; either an underpriced asset or a hidden risk that comps aren't pricing in. Stress-test before assuming the spread holds.
Location & tenants
- Location reads 72/100 on livability (#178 in CA) — a middle-class / working-renter tenant base. Strengths: schools A+, amenities A+, commute A+; Watch: health & safety C-, crime F, cost of living F.
- Santa Monica-Malibu Unified (urban): math 61% / reading 74% proficiency, ranked #123 of 1,400 in CA (top 9%) — acceptable for families but not a draw, mixed tenant base, ~2y average lease.
- Market conditions: Rents soft (-0.1%/yr); 93 active listings in the ZIP; high-income renter base; 19,697 units permitted in Los Angeles County in 2024 (9,426 in 5+ unit buildings).
Forward outlook
- In year one you build about $16k of equity ($19k loan paydown + $-3k appreciation (-0.1% local appreciation)).
- Los Angeles County population projected at +9% by 2050 — modest demand growth; plan on rents tracking national, not racing it.
- At projected returns (-0.1% appreciation + 0.0% rent growth), your $755k cash investment doubles in ~8 years — after that, you're playing with house money.
- By year 8, paydown + projected appreciation supports a ~$180k cash-out refi (75% LTV) — recoverable capital for the next deal without selling this one.
Negotiation context
- It's been on market 45 days — a 3% lower offer ($2.61M) is reasonable based on typical stale-listing flexibility.
- 3 sale attempts since 26y ago; this cycle's ask has dropped $300k (10%) from the opening price — seller is motivated, your offer sets the floor, not the list.
- Current owner paid $960k; list at $2.69M implies a 181% gain — meaningful room to come down on a strong offer.
Risks & watch-outs
- Watch-outs: built in 1950 — expect roof / HVAC / electrical / plumbing capex.
- Climate carrying-cost: extreme-heat days projected 7→20/yr by 2055 (HVAC capex compounding) — expect insurance premiums to compound above CPI over the hold.
Questions for the listing agent
- It's been on market 45 days. Have you received any prior offers? Is the seller open to a 3% concession, seller financing, or rate buy-down credit?
- Can we see the unit-by-unit rent roll, current vacancy, and any below-market leases? What's the average tenancy length?
- What capital expenditures (roof, boiler, parking lot, exteriors) have been made in the last 5 years, and what's planned in the next 2?
- Built in 1950 — when were the roof, HVAC, electrical panel, plumbing, and water heater last replaced?
- Is there a deadline driving the sale (1031 exchange, divorce, estate, relocation)? That informs how much negotiation room exists.
- Schools are A-rated — typically a magnet for longer-tenancy family renters. What's the average tenant stay here, and is there a school-zone premium baked into asking?
- Crime grade is F in this area — have there been break-ins, vandalism, or insurance claims at this property in the last 3 years? What carrier currently insures it and at what premium?
- What's the average days-on-market for RENTAL listings here right now (not sales)? A rising rental-DOM trend means longer vacancies and softer asking-rent achievability than the comps imply.
- What's the recent tenant-quality profile in this submarket — average credit score on applications, eviction rate, late-payment / NSF rate, and stable-employment percentage? A property-management company in the area should have these aggregated.
- How much new apartment / multifamily construction is in the pipeline within 1–3 miles? Heavy new supply (>2% of stock underway) typically softens rents 12–24 months out; light construction supports rent growth.
Investment metrics
- 1% rule
- 1.12% ✓
- Cap rate
- 9.43%
- Cash-on-cash
- 11.19%
- DSCR
- 1.50
- GRM
- 7.4
CMA / ARV
- ARV (median comp)
- $2,519,117
- List price
- $2,695,000
- Delta
- 6.98%
- Verdict
- FAIR
- Comps
- 20 within 1.0 mi
Show comp detail 2 sales within ~0.75 mi
| Address | Dist | Beds/Ba | Sqft | Sold | Price | $/sf | Match |
|---|---|---|---|---|---|---|---|
| 938 15th St | 0.19mi | 7/5.0 (-1) | 4,062 (-2%) | 11mo | $2,215,000 | $545 | 70 |
| 2002 Montana Ave | 0.31mi | 8/6.0 | 4,528 (+10%) | 9mo | $2,550,000 | $563 | 62 |
Match score weights: distance 35% · size 25% · config 20% · recency 20%. Top-matched comps best support the ARV.
Projected returns pro-forma
-0.1% appreciation · 0.0% rent growth · sell at horizon
- IRR
- 7.7%
- Equity multiple
- 1.35×
- Total profit
- $267,540
- Equity at exit
- $769,016
- IRR
- 10.8%
- Equity multiple
- 2.07×
- Total profit
- $804,444
- Equity at exit
- $913,667
Cash invested: $754,600 (down + closing). Projections, not guarantees.
Landlord ↔ Tenant lean methodology
- Overall (STATE)
- 18 Strongly Tenant-Friendly
- State California
- 18 Strongly Tenant-Friendly · D+13
- County
- — inherits STATE
- City
- — inherits STATE
ZIP-level market 90403
- Home prices YoY
- -0.0%
- Rents YoY
- -0.1%
- Active inventory
- 93
- Price-to-rent
- 44.5×
Monthly cashflow live
- Estimated rent
- $30,247 medium interval (Pro) →
- Mortgage (P&I)
- −$14,133
- Tax from tax record
- −$1,600 /mo · $19,195/yr
- Insurance
- −$1,123
- HOA
- −$0
- Vacancy / Maint / Mgmt
- −$6,352
- Net cashflow
- $7,040
Break-even live
6-unit breakdown (identical units grouped — click to expand)
| Units | Beds | Baths | Est. rent |
|---|---|---|---|
| 6× units | 8 | 6 | $30,246 |
| #1 | 8 | 6 | $5,041 |
| #2 | 8 | 6 | $5,041 |
| #3 | 8 | 6 | $5,041 |
| #4 | 8 | 6 | $5,041 |
| #5 | 8 | 6 | $5,041 |
| #6 | 8 | 6 | $5,041 |
| Total (6 units) | $30,247 | ||
UW: 25.0% down · 7.5% · 30yr · 1.5% tax · 5.0% vac · 8.0% maint · 8.0% mgmt
Financing live
Cash to close
- Down payment
- $673,750
- Closing costs
- $80,850
- Reserves months
- —
- Total cash needed
- —
Loan-product check · same deal, 3 products live
Conventional
25% down · 7.5% · 30yr
- Down + closing
- —
- Monthly P&I
- —
- Monthly cashflow
- —
- DSCR
- —
- Eligible?
- —
Personal DTI + credit; lowest rate.
DSCR
20% down · 8.5% · 30yr
- Down + closing
- —
- Monthly P&I
- —
- Monthly cashflow
- —
- DSCR
- —
- Eligible?
- —
No personal income docs; deal must DSCR.
Hard money
10% down · 12.0% · 12mo
- Down + closing
- —
- Monthly P&I
- —
- Monthly cashflow
- —
- DSCR
- —
- Eligible?
- —
Short-term bridge; refi at stabilization.
Listing history 24 events
-
2026-06-18days on market $2,695,000 Active 45 DOM
-
2026-06-17days on market $2,695,000 Active 44 DOM
-
2026-06-16days on market $2,695,000 Active 43 DOM
-
2026-06-15days on market $2,695,000 Active 42 DOM
-
2026-06-13days on market $2,695,000 Active 40 DOM
-
2026-06-13days on market $2,695,000 Active 39 DOM
-
2026-06-09days on market $2,695,000 Active 36 DOM
-
2026-06-08days on market $2,695,000 Active 35 DOM
-
2026-06-07days on market $2,695,000 Active 34 DOM
-
2026-06-04days on market $2,695,000 Active 31 DOM
-
2026-06-03days on market $2,695,000 Active 30 DOM
-
2026-06-02days on market $2,695,000 Active 29 DOM
-
2026-06-01days on market $2,695,000 Active 28 DOM
-
2026-05-31days on market $2,695,000 Active 27 DOM
-
2026-05-04$2,995,000 Active 428-char remark
Show marketing remark (428 chars)
Charming 6-unit property with expansive grounds and five covered parking spaces. Each unit has been tastefully updated, blending vintage charm with modern conveniences like dishwashers in most units. All units are at market rent, and the building features shared laundry. With strong financials and excellent income potential, this well-maintained Santa Monica gem is primed for a savvy investor to step in and maximize returns.
-
2024-12-24historical $2,450
-
2024-12-23$2,450
-
2001-02-21soldstatus $960,000 366-char remark
Show marketing remark (366 chars)
PRIME DEVELOPMENT SITE- SO. OF MONTANA. MULTIPLE RECENT HI-END CONDO PROJECTS COMPLETED ON STREET. 6 UNITS, UNIT #6 HAS 1BEDROOM, 1 BATH, NOT FURNISHED, RENT - $584.08. 3 CAN DELIVER VACANT AT C. O. E. RENTS WAY BELOW MARKET. INSPECTION WITH ACCEPTED OFFER ONLY. SOLD IN 'AS IS' CONDITION- LAND VALUE. 1 OF SELLERS IS R. E. LICENCEE. BUYER TO CO-OP W/ 1031 EXCHANGE.
-
2001-02-20soldstatus $960,000
-
2000-11-28historical 366-char remark
Show marketing remark (366 chars)
PRIME DEVELOPMENT SITE- SO. OF MONTANA. MULTIPLE RECENT HI-END CONDO PROJECTS COMPLETED ON STREET. 6 UNITS, UNIT #6 HAS 1BEDROOM, 1 BATH, NOT FURNISHED, RENT - $584.08. 3 CAN DELIVER VACANT AT C. O. E. RENTS WAY BELOW MARKET. INSPECTION WITH ACCEPTED OFFER ONLY. SOLD IN 'AS IS' CONDITION- LAND VALUE. 1 OF SELLERS IS R. E. LICENCEE. BUYER TO CO-OP W/ 1031 EXCHANGE.
-
2000-08-03$975,000 366-char remark
Show marketing remark (366 chars)
PRIME DEVELOPMENT SITE- SO. OF MONTANA. MULTIPLE RECENT HI-END CONDO PROJECTS COMPLETED ON STREET. 6 UNITS, UNIT #6 HAS 1BEDROOM, 1 BATH, NOT FURNISHED, RENT - $584.08. 3 CAN DELIVER VACANT AT C. O. E. RENTS WAY BELOW MARKET. INSPECTION WITH ACCEPTED OFFER ONLY. SOLD IN 'AS IS' CONDITION- LAND VALUE. 1 OF SELLERS IS R. E. LICENCEE. BUYER TO CO-OP W/ 1031 EXCHANGE.
-
1990-08-06soldstatus $725,000
-
1990-08-06soldstatus $725,000
-
1989-11-08soldstatus $577,000
ⓘ Source: listings_history table (triggers on properties + properties_extension) + one-shot
backfill from property_details.listing_events for pre-trigger history.
Tax reassessment forecast CA · Resets to sale price
- Current annual tax
- $19,195 · $1,600/mo
- Projected year-2 tax
- $20,482 · $1,707/mo
- Expected delta
- +$1,287/yr (+$107/mo · 6.7%)
ⓘ Screening estimate from a state-policy table — verify with the county assessor before closing.
Climate risk First Street
- Flood 1/10 Low FEMA zone X (unshaded) · 0% chance over 30 yrs
- Wildfire 1/10 Low
- Heat 6/10 Major 7 d/yr ≥83°F today · 20 d/yr by 30 yrs out
- Wind 1/10 Low
- Air quality 4/10 Moderate 5 unhealthy d/yr today · 6 by 30 yrs out
Nearby sold comps map
Loading sold comps map…
Walkable amenities ~0.75 mi
Loading nearby amenities…
Taxation est. · year 1
- Rental income
- $362,964
- − Mortgage interest
- −$150,962
- − Property taxes
- −$19,195
- − Insurance
- −$13,475
- − Repairs & maintenance
- −$29,037
- − Management
- −$29,037
- − Depreciation
- −$78,400
- Taxable income
- $42,858
- Est. tax owed @ 24.0%
- −$10,286
- After-tax cash flow
- $74,191/yr
For passive investors: Depreciation is non-cash, so a rental often shows a tax loss while cash-flowing — sheltering income. Rental losses are passive: they offset passive income freely, and up to $25,000/yr can offset ordinary (W-2) income if you actively participate and your MAGI is under $100k (phasing out to $0 by $150k); unused losses carry forward. On sale, claimed depreciation is recaptured at up to 25%, and gains may owe capital-gains tax (a 1031 exchange can defer both). Figures are a year-1 estimate at your 24.0% rate — not tax advice; consult a CPA.
Schools (NCES district)
- District
- Santa Monica-Malibu Unified
- NCES district ID
- 0635700
- Math proficiency
- 61% ▬ 0.00%
- Reading proficiency
- 74% ▬ 0.00%
- Median HH income
- $81,489
- Composite
- 61.58/100
- National rank
- #1535
- State rank
- #123 of 1400 in CA
Livability — Santa Monica
- Score
- 72/100
- State rank
- #178
- US rank
- #5878
Category grades
Schools grade is shown separately in the Schools card above.
Census & demographics
- Census place
- Santa Monica, CA
- County
- Los Angeles County · 9,444,647 people
- City population
- 93,581
- Metro
- Los Angeles-Long Beach-Anaheim, CA
- Population (ZIP)
- 23,867
- Household income
- $121,925
- Rent vs Own
- Severe rent burden
- 2265.0
Population outlook (Los Angeles County) Hauer SSP2
- Today (2025)
- 10,940,515 people
- By 2030
- 11,256,481 · +2.9%
- By 2040
- 11,729,929 · +7.2%
- By 2050
- 11,948,407 · +9.2%
- By 2075
- 11,818,114 · +8.0%
- By 2100
- 10,842,928 · -0.9%
Race, ethnicity, and origin ACS 2023
- Neighborhood character
- Predominantly White (67%)
- Race & ethnicity
- White 67% Hispanic / Latino 12% Two or more races 12% Asian 11% Black 2%
- Hispanic origin (detail)
- Mexican 9%
- Common ancestry
- Italian 7% Romanian 5% Scotch-Irish 4%
- Foreign-born
- 24% · Canada, China, Dominican Republic
- Languages at home
- 75% English-only · Spanish 8% Other Indo-European 6% Russian/Polish/Slavic 4%
Political lean MEDSL · Los Angeles
- 2024 margin
- Solid D (+32.9) · D 64.8% · R 31.9% · Other 3.3%
- 2008→2024 swing
- -7.4pp toward R · 2008: 40.4pp · 2024: 32.9pp
- All cycles
- 2024: D+32.9 2020: D+44.2 2016: D+48.0 2012: D+40.0 2008: D+40.4
Not yet ingested
- Civics
- —
Market trends
- HPI YoY
- ▼ -0.10%
- Current HPI
- 310.2427
- Rent YoY
- ▼ -0.07%
- Metro
- Los Angeles-Long Beach-Anaheim, CA
- State GDP YoY
- ▲ 3.21%
- F500 in state
- 116
Industry mix (Fortune 500 HQ in CA)
| Industry | F500 HQs | Revenue |
|---|---|---|
| Technology | 27 | $1,492B |
|
||
| Financial Services | 3 | $174B |
|
||
| Retail | 3 | $44B |
|
||
| Insurance | 3 | $26B |
|
||
| Media / Entertainment | 2 | $115B |
|
||
| Pharmaceuticals / Biotech | 2 | $62B |
|
||
Price history
+419.1% since first listed10 events — show timeline
- 2026-05-04 Listed $2,995,000 TheMLS
- 2024-12-24 Rental Removed $2,450 CLAW
- 2024-12-23 Listed for Rent $2,450 CLAW
- 2001-02-21 Sold (MLS) $960,000 TheMLS
- 2001-02-20 Sold (Public Records) $960,000 Public Records
- 2000-11-28 Delisted — TheMLS
- 2000-08-03 Listed $975,000 TheMLS
- 1990-08-06 Sold (Public Records) $725,000 Public Records
- 1990-08-06 Sold (Public Records) $725,000 Public Records
- 1989-11-08 Sold (Public Records) $577,000 Public Records
Property tax history
+2.2%/yrLatest (2025): $19,195 · +6.3% YoY. Source: county tax records.
Cash-flow waterfall
monthlySold comps — $/sqft
last 12 mo · ≤1 miLoading sold comps…