19800 Woodridge Dr · Norman, OK
Flood risk 1/10 · Minimal
- FEMA flood zone
- X (unshaded)
- Chance of flooding over 30 yrs
- 0.0%
- Est. flood insurance / yr
- $507 – $1,088
Fire risk 6/10 · Moderate
- Est. fire insurance / yr
- $2,463 – $4,575
Heat risk 5/10 · Moderate
- Hot days now (above 109°F)
- 7 days/yr
- Hot days in 30 yrs
- 18 days/yr
Wind risk 3/10 · Minor
- Chance of severe wind over 30 yrs
- 4.0%
Air-quality risk 2/10 · Minimal
- Unhealthy air days now
- 1 days/yr
- Unhealthy air days in 30 yrs
- 1 days/yr
Risk factors via First Street. Map © Google.
Why this score? — see what drove the C grade
The composite is a weighted blend of 9 inputs, each scored 0–100. Each bar is that input's sub-score; the figure is the points it added to the 100-point composite (weight × sub-score).
- Cash flow +21.2/30.0
- ARV discount +14.2/15.0
- DSCR +6.7/10.0
- 1% rule +4.9/10.0
- Livability +4.2/5.0
- Rent growth +2.5/5.0
- Condition / age +2.5/5.0
- Schools +1.1/10.0
- Appreciation +0.0/10.0
$195,000
🖨 Deal sheet 📄 Offer letter ✓ Due diligence
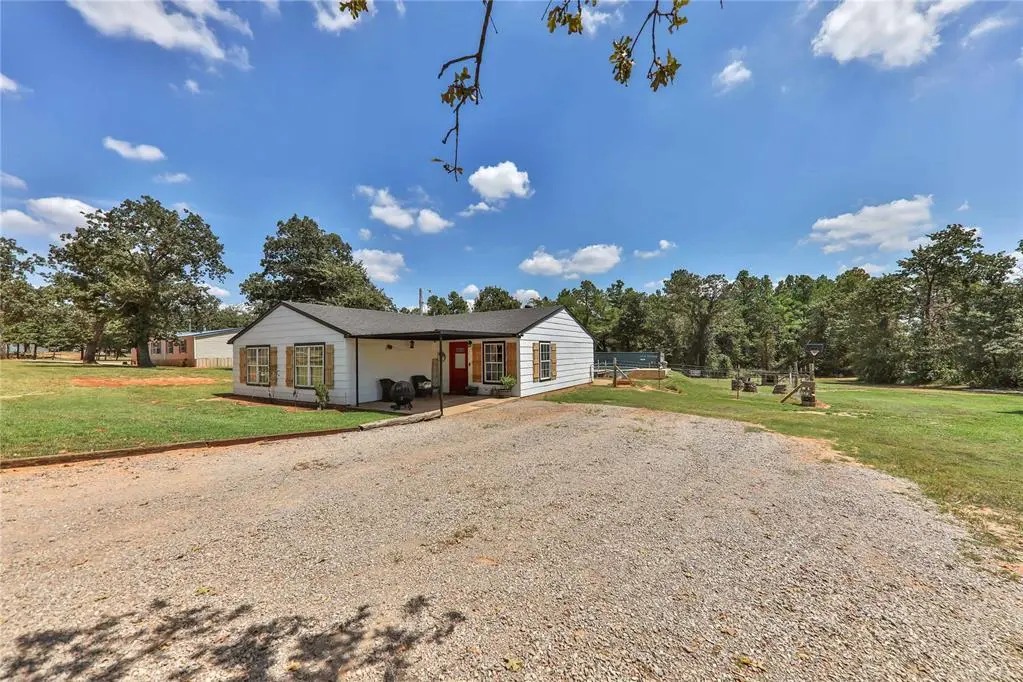
Listing remarks
* * * Seller is offering $5,000 in concessions to help reduce buyer’s out-of-pocket costs! * * * Don't miss the chance to enjoy peaceful, country living on 1 unrestricted acre in Little Axe School district. . This beautifully remodeled home offers 3 bedrooms PLUS a study and two updated bathrooms. Step into a warm and inviting family room as you enter the home. The open layout seamlessly connects the space to the beautifully remodeled kitchen, creating the perfect setting for everyday living and entertaining. Outside, enjoy your own backyard retreat featuring an above ground pool, a storm shelter for peace mind, and plenty of trees spread across a spacious one acre corner lot. T
Key facts
- Unrestricted acre
- High speed internet
- Above ground pool
Tags
Property features AI
Finance
- Other: Homestead exempt; Livestock allowed; Existing property; Occupied by owner
- Financial info: Loan qualification possible
- HOA & community: No mandatory association dues
Exterior
- Parking: Gravel parking
- Utilities: Electricity available; High-speed internet; Rural water; Private well available
- Home design: Single family residence; One-level home; West-facing
- Construction: Frame construction; Composition roof (replaced 2024); Slab foundation
- Exterior features: Covered porch; Open deck; Porch; Water feature; Wire fencing; Corner lot; Rural setting; Storm shelter (outdoors)
Interior
- Kitchen: Dishwasher
- Bedrooms: 3 bedrooms
- Flooring: Combination flooring; Tile flooring
- Bathrooms: 2 full bathrooms
- Interior features: Ceiling fan(s); Whirlpool
Neighborhood map
What this means for you Summary
Snapshot
- This is a 3-bed/2.0-bath single-family listed at $195k.
Deal economics
- At list price, monthly cash flow is $281 ($3k/yr) — positive.
- The deal already cash-flows at list — no discount required.
- To meet the 1% rule (rent ≥ 1% of price), the offer needs to be $193k (1.0% below list).
- Recommended offer: $189k (3.0% below list) — sets the bar for market timing.
- Cap rate 8.0% vs local median 3.6% in Norman — top-decile yield for the area; either an underpriced asset or a hidden risk that comps aren't pricing in. Stress-test before assuming the spread holds.
Location & tenants
- Location reads 85/100 on livability (#1 in OK, #557 nationally) — a professional / high-income tenant draw. Strengths: amenities A+, commute A+, cost of living A+.
- Little Axe (rural): math 10% / reading 14% proficiency, ranked #236 of 270 in OK (top 87%) — low school quality limits family demand, transient renter base, plan for 1-2y turnover; 63% free/reduced lunch — lower-income household profile, screen leases tightly.
- Zoned schools: Little Axe Es (math 10% / reading 14%, grade F, #667 of 845 statewide, top 82%, 587 students, 0% FRL); Little Axe Hs (math 8% / reading 22%, grade F, #332 of 447 statewide, top 78%, 331 students, 0% FRL) — zoned schools average 0% FRL vs 63% district-wide (63 pts lower); this property's tenant base skews higher-income than the district average.
- Market conditions: 96 active listings in the ZIP; 592 units permitted in Cleveland County in 2024 (12 in 5+ unit buildings).
Forward outlook
- Local home prices are declining (-3.0%/yr); year-one equity from $1k of loan paydown is wiped out by about $6k of value loss. Plan a longer hold.
- Cleveland County population projected at +40% by 2050 — long-run rental-demand tailwind backs the buy-and-hold thesis.
Negotiation context
- It's been on market 43 days — a 3% lower offer ($189k) is reasonable based on typical stale-listing flexibility.
- 3 sale attempts; this cycle's ask has dropped $20k (9%) from the opening price — seller is motivated, your offer sets the floor, not the list.
- Current owner paid $60k; list at $195k implies a 228% gain — meaningful room to come down on a strong offer.
Risks & watch-outs
- Climate carrying-cost: major wildfire risk; extreme-heat days projected 7→18/yr by 2055 (HVAC capex compounding) — expect insurance premiums to compound above CPI over the hold.
Questions for the listing agent
- It's been on market 43 days. Have you received any prior offers? Is the seller open to a 3% concession, seller financing, or rate buy-down credit?
- Is there a deadline driving the sale (1031 exchange, divorce, estate, relocation)? That informs how much negotiation room exists.
- What's the average days-on-market for RENTAL listings here right now (not sales)? A rising rental-DOM trend means longer vacancies and softer asking-rent achievability than the comps imply.
- What's the recent tenant-quality profile in this submarket — average credit score on applications, eviction rate, late-payment / NSF rate, and stable-employment percentage? A property-management company in the area should have these aggregated.
- How much new for-sale + rental construction is in the pipeline within 1–3 miles? Heavy new supply typically softens prices + rents 12–24 months out; constrained supply supports both.
Investment metrics
- 1% rule
- 0.99% ✗
- Cap rate
- 8.02%
- Cash-on-cash
- 6.17%
- DSCR
- 1.27
- GRM
- 8.4
CMA / ARV
- ARV (on-the-fly)
- $228,852
- Comps found
- 2
Show comp detail 2 sales within ~0.75 mi
| Address | Dist | Beds/Ba | Sqft | Sold | Price | $/sf | Match |
|---|---|---|---|---|---|---|---|
| 18950 Skyridge Rd | 0.36mi | 3/2.0 | 1,404 (0%) | 17mo | $229,000 | $163 | 69 |
| 18251 Skyridge Rd | 0.24mi | 3/2.0 | 1,248 (-11%) | 5mo | $90,000 | $72 | 66 |
Match score weights: distance 35% · size 25% · config 20% · recency 20%. Top-matched comps best support the ARV.
Projected returns pro-forma
-3.0% appreciation · 3.0% rent growth · sell at horizon
- IRR
- -6.8%
- Equity multiple
- 0.75×
- Total profit
- $-13,749
- Equity at exit
- $29,075
- IRR
- 2.8%
- Equity multiple
- 1.20×
- Total profit
- $10,915
- Equity at exit
- $16,860
Cash invested: $54,600 (down + closing). Projections, not guarantees.
Landlord ↔ Tenant lean methodology
- Overall (STATE)
- 83 Strongly Landlord-Friendly
- State Oklahoma
- 83 Strongly Landlord-Friendly · R+20
- County
- — inherits STATE
- City
- — inherits STATE
ZIP-level market 74857
- Home prices YoY
- -10.6%
- Active inventory
- 96
- Price-to-rent
- 8.4×
Monthly cashflow live
- Estimated rent
- $1,930 medium interval (Pro) →
- Mortgage (P&I)
- −$1,023
- Tax from tax record
- −$140 /mo · $1,677/yr
- Insurance
- −$81
- HOA
- −$0
- Vacancy / Maint / Mgmt
- −$405
- Net cashflow
- $281
Break-even live
UW: 25.0% down · 7.5% · 30yr · 1.5% tax · 5.0% vac · 8.0% maint · 8.0% mgmt
Financing live
Cash to close
- Down payment
- $48,750
- Closing costs
- $5,850
- Reserves months
- —
- Total cash needed
- —
Loan-product check · same deal, 3 products live
Conventional
25% down · 7.5% · 30yr
- Down + closing
- —
- Monthly P&I
- —
- Monthly cashflow
- —
- DSCR
- —
- Eligible?
- —
Personal DTI + credit; lowest rate.
DSCR
20% down · 8.5% · 30yr
- Down + closing
- —
- Monthly P&I
- —
- Monthly cashflow
- —
- DSCR
- —
- Eligible?
- —
No personal income docs; deal must DSCR.
Hard money
10% down · 12.0% · 12mo
- Down + closing
- —
- Monthly P&I
- —
- Monthly cashflow
- —
- DSCR
- —
- Eligible?
- —
Short-term bridge; refi at stabilization.
Listing history 16 events
-
2026-05-08status Pending
-
2026-04-19price $195,000
-
2026-03-26$215,000 Active
-
2026-03-25historical
-
2026-03-17price $215,000
-
2026-03-03price $219,900
-
2026-01-06price $224,900
-
2025-12-09price $229,900
-
2025-11-13price $229,950
-
2025-10-21price $230,000
-
2025-09-25$235,000 Active
-
2025-09-25historical
-
2025-09-15price $323,500
-
2025-08-15$325,000 Active
-
2009-02-27soldstatus $59,500
-
1991-05-01soldstatus $18,000
ⓘ Source: listings_history table (triggers on properties + properties_extension) + one-shot
backfill from property_details.listing_events for pre-trigger history.
Tax reassessment forecast OK · Resets to sale price
- Current annual tax
- $1,677 · $140/mo
- Projected year-2 tax
- $1,755 · $146/mo
- Expected delta
- +$78/yr (+$6/mo · 4.7%)
ⓘ Screening estimate from a state-policy table — verify with the county assessor before closing.
Climate risk First Street
- Flood 1/10 Low FEMA zone X (unshaded) · 0% chance over 30 yrs
- Wildfire 6/10 Major
- Heat 5/10 Major 7 d/yr ≥109°F today · 18 d/yr by 30 yrs out
- Wind 3/10 Moderate 4% chance of damaging wind over 30 yrs
- Air quality 2/10 Low 1 unhealthy d/yr today · 1 by 30 yrs out
Nearby sold comps map
Loading sold comps map…
Walkable amenities ~0.75 mi
Loading nearby amenities…
Taxation est. · year 1
- Rental income
- $23,155
- − Mortgage interest
- −$10,923
- − Property taxes
- −$1,677
- − Insurance
- −$975
- − Repairs & maintenance
- −$1,852
- − Management
- −$1,852
- − Depreciation
- −$5,673
- Taxable income
- $203
- Est. tax owed @ 24.0%
- −$49
- After-tax cash flow
- $3,321/yr
For passive investors: Depreciation is non-cash, so a rental often shows a tax loss while cash-flowing — sheltering income. Rental losses are passive: they offset passive income freely, and up to $25,000/yr can offset ordinary (W-2) income if you actively participate and your MAGI is under $100k (phasing out to $0 by $150k); unused losses carry forward. On sale, claimed depreciation is recaptured at up to 25%, and gains may owe capital-gains tax (a 1031 exchange can defer both). Figures are a year-1 estimate at your 24.0% rate — not tax advice; consult a CPA.
Schools (NCES district)
- District
- Little Axe
- NCES district ID
- 4017880
- Math proficiency
- 10% ▼ -17.00%
- Reading proficiency
- 14% ▼ -13.00%
- Median HH income
- $51,174
- Composite
- 11.38/100
- National rank
- #9708
- State rank
- #236 of 270 in OK
Livability — Norman
- Score
- 85/100
- State rank
- #1
- US rank
- #557
Category grades
Schools grade is shown separately in the Schools card above.
Census & demographics
- City population
- 123,141
- Population (ZIP)
- 9,902
Population outlook (Cleveland County) Hauer SSP2
- Today (2025)
- 323,621 people
- By 2030
- 349,070 · +7.9%
- By 2040
- 400,168 · +23.7%
- By 2050
- 454,101 · +40.3%
- By 2075
- 602,926 · +86.3%
- By 2100
- 734,485 · +127.0%
Race, ethnicity, and origin ACS 2023
- Neighborhood character
- Predominantly White (79%)
- Race & ethnicity
- White 79% Two or more races 9% Native American 8% Hispanic / Latino 4% Black 2%
- Common ancestry
- Slovak 2% Iranian 2% Romanian 1%
- Foreign-born
- 1% · Canada
- Languages at home
- 96% English-only · Spanish 3%
Political lean MEDSL · Cleveland
- 2024 margin
- R (+14.9) · D 41.4% · R 56.4% · Other 2.2%
- 2008→2024 swing
- +9.1pp toward D · 2008: -24.0pp · 2024: -14.9pp
- All cycles
- 2024: R+14.9 2020: R+14.1 2016: R+21.7 2012: R+25.9 2008: R+24.0
Not yet ingested
- Civics
- —
Market trends
- HPI YoY
- ▼ -33.83%
- Current HPI
- 284.6727
- Rent YoY
- —
- Metro
- —
- State GDP YoY
- ▲ 1.55%
- F500 in state
- 6
Industry mix (Fortune 500 HQ in OK)
| Industry | F500 HQs | Revenue |
|---|---|---|
| Energy | 3 | $48B |
|
||
Price history
+983.3% since first listed16 events — show timeline
- 2026-05-08 Pending — MLSOK
- 2026-04-19 Price Changed $195,000 MLSOK
- 2026-03-26 Listed $215,000 MLSOK
- 2026-03-25 Listing Removed — MLSOK
- 2026-03-17 Price Changed $215,000 MLSOK
- 2026-03-03 Price Changed $219,900 MLSOK
- 2026-01-06 Price Changed $224,900 MLSOK
- 2025-12-09 Price Changed $229,900 MLSOK
- 2025-11-13 Price Changed $229,950 MLSOK
- 2025-10-21 Price Changed $230,000 MLSOK
- 2025-09-25 Listing Removed — MLSOK
- 2025-09-25 Listed $235,000 MLSOK
- 2025-09-15 Price Changed $323,500 MLSOK
- 2025-08-15 Listed $325,000 MLSOK
- 2009-02-27 Sold (Public Records) $59,500 Public Records
- 1991-05-01 Sold (Public Records) $18,000 Public Records
Property tax history
+9.3%/yrLatest (2024): $1,677 · +115.0% YoY. Source: county tax records.
Cash-flow waterfall
monthlySold comps — $/sqft
last 12 mo · ≤1 miLoading sold comps…