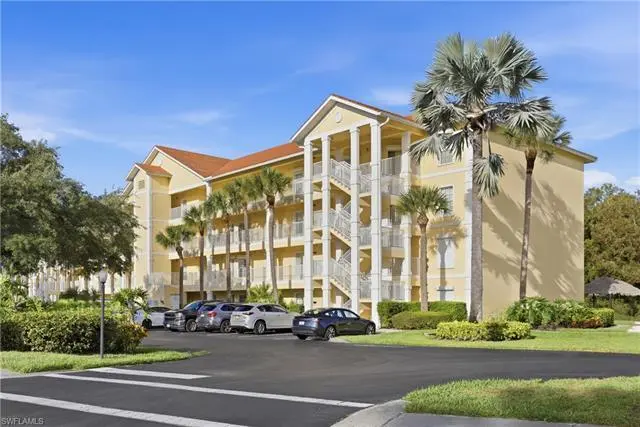
9175 Celeste Dr #204 · Lely Resort, FL
Flood risk 7/10 · Major
- FEMA flood zone
- AE
- Chance of flooding over 30 yrs
- 0.77%
- Est. flood insurance / yr
- $1,737 – $8,500
Fire risk 4/10 · Minor
- Est. fire insurance / yr
- $947 – $1,759
Heat risk 10/10 · Severe
- Hot days now (above 108°F)
- 7 days/yr
- Hot days in 30 yrs
- 26 days/yr
Wind risk 10/10 · Severe
- Chance of severe wind over 30 yrs
- 99.0%
Air-quality risk 2/10 · Minimal
- Unhealthy air days now
- 2 days/yr
- Unhealthy air days in 30 yrs
- 2 days/yr
Risk factors via First Street. Map © Google.
Why this score? — see what drove the C+ grade
The composite is a weighted blend of 9 inputs, each scored 0–100. Each bar is that input's sub-score; the figure is the points it added to the 100-point composite (weight × sub-score).
- Cash flow +24.9/30.0
- 1% rule +8.2/10.0
- DSCR +8.1/10.0
- ARV discount +7.5/15.0
- Schools +5.0/10.0
- Rent growth +3.9/5.0
- Livability +3.1/5.0
- Condition / age +2.5/5.0
- Appreciation +0.0/10.0
$349,900
🖨 Deal sheet 📄 Offer letter ✓ Due diligence
Listing remarks MLS
This hidden gem located in Lely resort is within walking distance to shops, restaurants and groceries. Minutes to Downtown Naples and Marco Island. This condo has 2 bedroom/ 2 bath with sleeper sofa comes fully furnished with stainless steel appliances and washer and dryer in unit. This complex has a pool, spa, chickee huts and common grill area. If you are looking to own a piece of paradise in SW Fl. there is no better time than now with interest rates at an all time low. If you are looking to invest this property has a history of rental income or if you are tired of renting this is an opportunity. Buyer has the option to join Players club and Spa that offers live entertainment, pool, fitness center, and tennis. Two public courses nearby.
Key facts
- $613 HOA
- Garage
- Community pool
Property features AI
Other
- Location: Subdivision: Coral Falls Resort (Sub condo name); Directions available
- Possession: Possession at closing
- Multi-unit information: 1 unit per floor; 64 units in the complex; 32 units in the building; 1 floor (building level count)
Finance
- HOA & community: Mandatory HOA (Condo/Hotel community); Professional management; Quarterly condo fee; Condo fee: $1,839 quarterly; Total annual recurring fees: $7,356; Total one-time fees: $650; HOA maintenance covers insurance, irrigation water, lawn/land maintenance, legal/accounting, manager, master association fee, exterior pest control, reserves, sewer, street lights, trash removal, water; Community amenities include BBQ/picnic area, bike and jog paths, bike storage, cabana, community pool, community room, community spa/hot tub, golf course (public), play area, sidewalks, streetlights
Exterior
- Parking: Common parking
- Security: Fire sprinklers; Smoke detectors
- Utilities: Water assessment paid; Central sewer; Cable available; Irrigation: central and lake/canal
- Home design: Residential property in a mid-rise (4-7) building; Contemporary style; Zero lot line; Rear exposure faces northwest; Located in Lely Resort / Coral Falls Resort
- Construction: Concrete block construction; Stucco exterior; Tile roof; Built in 2004
- Exterior features: Courtyard; Automatic sprinkler system; Screened balcony / screened lanai or porch; Landscaped area view; Pool/club view; Preserve view
Interior
- Kitchen: Pantry; Electric cooktop; Self-cleaning oven; Dishwasher; Disposal; Microwave; Refrigerator/freezer; Breakfast bar / eat-in kitchen
- Bedrooms: 2 bedrooms; Split bedroom floor plan
- Flooring: Tile flooring; Vinyl flooring
- Bathrooms: 2 full bathrooms; Master bath with dual sinks and shower (no tub)
- Heating & cooling: Central electric heat; Central electric air conditioning; Ceiling fans; Exhaust fan; Whole-house fan
- Interior features: Built-in cabinets; Cable prewire; Fire sprinkler system; Foyer; High-speed internet available; Pantry; Smoke detectors; Wheelchair access; Window coverings; Turnkey furnished; Common elevator; 4 ceiling fans
- Laundry & utility: Washer and dryer in residence; Guest bath/room included
Neighborhood map
What this means for you Summary
Snapshot
- This is a 2-bed/2.0-bath condo listed at $350k.
Deal economics
- At list price, monthly cash flow is $323 ($4k/yr) — positive.
- The deal already cash-flows at list — no discount required.
- Meets the 1% rule at list price ($5k rent vs $350k).
- Recommended offer: $329k (6.0% below list) — sets the bar for market timing.
Location & tenants
- Location reads 61/100 on livability (#786 in FL) — a middle-class / working-renter tenant base. Strengths: crime A+, employment A-; Watch: health & safety D, schools F, amenities F.
- Collier (suburban): math 60% / reading 56% proficiency, ranked #16 of 73 in FL (top 22%) — acceptable for families but not a draw, mixed tenant base, ~2y average lease.
- Market conditions: Rents rising fast (+5.6%/yr); 597 active listings in the ZIP; 40 comparable units currently listed for rent nearby; rentals at typical pace (median 24d on market — plan ~3-4 weeks tenant-placement turnaround); solid renter incomes; 3,520 units permitted in Collier County in 2024 (959 in 5+ unit buildings).
- At $4,611/mo this rent would consume 68% of the median local household income ($82k/yr) (locally 954% of renters already pay >50% of income on rent) — very limited rent-growth headroom before tenants either downsize or default.
Forward outlook
- Local home prices are declining (-3.0%/yr); year-one equity from $2k of loan paydown is wiped out by about $10k of value loss. Plan a longer hold.
- Collier County population projected at +30% by 2050 — long-run rental-demand tailwind backs the buy-and-hold thesis.
Negotiation context
- It's been on market 69 days — a 6% lower offer ($329k) is reasonable based on typical stale-listing flexibility.
- 2 sale attempts since 6y ago with the ask held roughly flat each time — persistent listings suggest the price (not the market) is what's stuck; bring a comps-based counter.
- Current owner paid $188k; list at $350k implies a 86% gain — meaningful room to come down on a strong offer.
Risks & watch-outs
- Watch-outs: flood insurance adds $427/mo.
- Climate carrying-cost: in FEMA flood zone AE (mandatory federal flood insurance); severe wind risk, 99% chance of damaging wind over 30y; extreme-heat days projected 7→26/yr by 2055 (HVAC capex compounding) — expect insurance premiums to compound above CPI over the hold.
Questions for the listing agent
- It's been on market 69 days. Have you received any prior offers? Is the seller open to a 6% concession, seller financing, or rate buy-down credit?
- What's the actual annual flood-insurance premium (NFIP or private), and is the property in a SFHA with mandatory coverage?
- What does the HOA fee cover, when was the last increase, and are there any pending special assessments or reserve-fund shortfalls?
- Any open or pending special assessments — roof, HVAC, plumbing, elevator, façade? What's the per-unit balance and payoff schedule, and is the seller paying it off at close or rolling it to the buyer?
- Why hasn't it sold? Are there any deal-killer items the seller is aware of (foundation, flood, title, zoning, code violations)?
- Is there a deadline driving the sale (1031 exchange, divorce, estate, relocation)? That informs how much negotiation room exists.
- Schools are F-rated, which usually means shorter tenancies and higher turnover. Who's the typical renter profile here, and what's been the actual vacancy rate?
- What's the average days-on-market for RENTAL listings here right now (not sales)? A rising rental-DOM trend means longer vacancies and softer asking-rent achievability than the comps imply.
- What's the recent tenant-quality profile in this submarket — average credit score on applications, eviction rate, late-payment / NSF rate, and stable-employment percentage? A property-management company in the area should have these aggregated.
- How much new apartment / multifamily construction is in the pipeline within 1–3 miles? Heavy new supply (>2% of stock underway) typically softens rents 12–24 months out; light construction supports rent growth.
Investment metrics
- 1% rule
- 1.32% ✓
- Cap rate
- 8.86%
- Cash-on-cash
- 9.18%
- DSCR
- 1.41
- GRM
- 6.3
CMA / ARV
No comps found within radius.
Projected returns pro-forma
-3.0% appreciation · 5.59% rent growth · sell at horizon
- IRR
- -6.2%
- Equity multiple
- 0.76×
- Total profit
- $-23,190
- Equity at exit
- $52,171
- IRR
- 7.3%
- Equity multiple
- 1.63×
- Total profit
- $62,152
- Equity at exit
- $30,253
Cash invested: $97,972 (down + closing). Projections, not guarantees.
Landlord ↔ Tenant lean methodology
- Overall (STATE)
- 87 Strongly Landlord-Friendly
- State Florida
- 87 Strongly Landlord-Friendly · R+3
- County
- — inherits STATE
- City
- — inherits STATE
ZIP-level market 34113
- Rents YoY
- 5.6%
- Active inventory
- 597
- Price-to-rent
- 6.3×
Monthly cashflow live
- Estimated rent
- $4,611 high interval (Pro) →
- Mortgage (P&I)
- −$1,835
- Tax from tax record
- −$299 /mo · $3,592/yr
- Insurance
- −$146
- Flood insurance flood zone
- −$427 /mo · $5,118/yr
- HOA
- −$613
- Vacancy / Maint / Mgmt
- −$968
- Net cashflow
- $323
Break-even live
UW: 25.0% down · 7.5% · 30yr · 1.5% tax · 5.0% vac · 8.0% maint · 8.0% mgmt
Financing live
Cash to close
- Down payment
- $87,475
- Closing costs
- $10,497
- Reserves months
- —
- Total cash needed
- —
Loan-product check · same deal, 3 products live
Conventional
25% down · 7.5% · 30yr
- Down + closing
- —
- Monthly P&I
- —
- Monthly cashflow
- —
- DSCR
- —
- Eligible?
- —
Personal DTI + credit; lowest rate.
DSCR
20% down · 8.5% · 30yr
- Down + closing
- —
- Monthly P&I
- —
- Monthly cashflow
- —
- DSCR
- —
- Eligible?
- —
No personal income docs; deal must DSCR.
Hard money
10% down · 12.0% · 12mo
- Down + closing
- —
- Monthly P&I
- —
- Monthly cashflow
- —
- DSCR
- —
- Eligible?
- —
Short-term bridge; refi at stabilization.
Rent comps 40 comps
| Address | Beds | Baths | Sqft | Rent | $/sqft | DOM | Units | Dist |
|---|---|---|---|---|---|---|---|---|
| 9175 Celeste Dr Unit 105 Naples, FL | 2.0 | 2.0 | 1000 | $2,000 | $2.00 | 23d | 1 | 0.03mi |
| 9187 Celeste Dr Unit 1073494P Naples, FL | 2.0 | 2.0 | 1399 | $2,979 | $2.13 | 14d | 1 | 0.04mi |
| 9165 Celeste Dr Unit 3-303 Naples, FL | 2.0 | 2.0 | 1000 | $6,500 | $6.50 | 23d | 1 | 0.09mi |
| 9115 Capistrano St S #8207 Naples, FL | 2.0 | 2.5 | 1494 | $6,000 | $4.02 | 23d | 1 | 0.32mi |
| 9111 Capistrano St S #8303 Naples, FL | 2.0 | 2.5 | 1432 | $7,500 | $5.24 | 23d | 1 | 0.32mi |
| 6590 Beach Resort Dr Unit 305 Naples, FL | 2.0 | 2.0 | 1351 | $4,500 | $3.33 | 14d | 1 | 0.32mi |
| 9092 Chula Vista St #11003 Naples, FL | 2.0 | 2.0 | 1404 | $6,850 | $4.88 | 23d | 1 | 0.36mi |
| 9088 Chula Vista St Unit 108-3 Naples, FL | 2.0 | 2.0 | 1404 | $5,700 | $4.06 | 23d | 1 | 0.38mi |
| 9081 Albion Ln S #6505 Naples, FL | 2.0 | 2.0 | 1225 | $7,500 | $6.12 | 23d | 1 | 0.45mi |
| 9071 Albion Ln N #5706 Naples, FL | 2.0 | 2.5 | 1441 | $2,200 | $1.53 | 23d | 1 | 0.51mi |
| 6650 Beach Resort Dr Unit 908 Naples, FL | 2.0 | 2.0 | 1351 | $4,600 | $3.40 | 14d | 1 | 0.52mi |
| 9082 Capistrano St N Unit 48-5 Naples, FL | 2.0 | 2.0 | 1227 | $6,500 | $5.30 | 23d | 1 | 0.54mi |
| 6750 Beach Resort Dr #7 Naples, FL | 2.0 | 2.0 | 1351 | $3,900 | $2.89 | 23d | 1 | 0.61mi |
| 6750 Beach Resort Dr Naples, FL | 2.0 | 2.0 | 1351 | $3,200 | $2.37 | 14d | 2 | 0.61mi |
| 9054 Capistrano St N #4003 Naples, FL | 2.0 | 2.0 | 1385 | $2,495 | $1.80 | 23d | 1 | 0.65mi |
| 6680 Beach Resort Dr Unit 1214 Naples, FL | 2.0 | 2.0 | 1351 | $4,500 | $3.33 | 14d | 1 | 0.67mi |
| 9022 Michael Cir Unit 2-205 Naples, FL | 2.0 | 2.0 | 1450 | $3,500 | $2.41 | 23d | 1 | 0.68mi |
| 8175 Celeste Dr Naples, FL | 2.0 | 2.0 | 1460 | $2,395 | $1.64 | 23d | 1 | 0.72mi |
| 8175 Celeste Dr #1230 Naples, FL | 2.0 | 2.0 | 1476 | $2,775 | $1.88 | 23d | 1 | 0.72mi |
| 8135 Celeste Dr #4218 Naples, FL | 2.0 | 2.0 | 1476 | $7,500 | $5.08 | 23d | 1 | 0.74mi |
| 8986 Cambria Cir Unit 22 Naples, FL | 2.0 | 2.0 | 1404 | $6,000 | $4.27 | 23d | 1 | 0.79mi |
| 8161 Twelve Oaks Cir #512 Naples, FL | 2.0 | 2.0 | 1066 | $5,000 | $4.69 | 23d | 1 | 0.81mi |
| 8085 Celeste Dr #812 Naples, FL | 2.0 | 2.0 | 1480 | $6,000 | $4.05 | 14d | 1 | 0.95mi |
| 8065 Tiger Cv #1604 Naples, FL | 2.0 | 2.0 | 1203 | $2,495 | $2.07 | 21d | 1 | 1.01mi |
| 8065 Tiger Cv Naples, FL | 2.0 | 2.0 | 1203 | $2,495 | $2.07 | 23d | 1 | 1.02mi |
| 8055 Tiger Cv Unit 6-606 Naples, FL | 2.0 | 2.0 | 1439 | $1,800 | $1.25 | 23d | 1 | 1.05mi |
| 1252 Henderson Creek Dr Naples, FL | 2.0 | 1.5 | 820 | $1,895 | $2.31 | 23d | 1 | 1.10mi |
| 8073 Panther Trl #1404 Naples, FL | 2.0 | 2.0 | 1450 | $5,500 | $3.79 | 23d | 1 | 1.11mi |
| 7955 Mahogany Run Ln #515 Naples, FL | 2.0 | 2.0 | 1244 | $8,925 | $7.17 | 23d | 1 | 1.11mi |
| 7955 Mahogany Run Ln Unit 1504173P Naples, FL | 3.0 | 2.0 | 1442 | $5,840 | $4.05 | 14d | 1 | 1.11mi |
| 7895 Mahogany Run Ln Unit 1504163P Naples, FL | 2.0 | 2.0 | 1237 | $4,125 | $3.33 | 21d | 1 | 1.11mi |
| 7895 Mahogany Run Ln Naples, FL | 2.0–3.0 | 2.0 | 1339 | $2,850 | $2.13 | 14d | 3 | 1.11mi |
| 7925 Mahogany Run Ln #924 Naples, FL | 2.0 | 2.0 | 1389 | $8,925 | $6.43 | 23d | 1 | 1.13mi |
| 7920 Mahogany Run Ln #1011 Naples, FL | 3.0 | 2.0 | 1454 | $10,395 | $7.15 | 23d | 1 | 1.16mi |
| 7885 Mahogany Run Ln Unit 1504180P Naples, FL | 2.0 | 2.0 | 1237 | $2,915 | $2.36 | 21d | 1 | 1.16mi |
| 7940 Mahogany Run Ln #623 Naples, FL | 2.0 | 2.0 | 1389 | $8,000 | $5.76 | 23d | 1 | 1.16mi |
| 7930 Mahogany Run Ln Unit 1504165P Naples, FL | 2.0 | 2.0 | 1237 | $4,053 | $3.28 | 14d | 1 | 1.16mi |
| 7930 Mahogany Run Ln Unit 1504168P Naples, FL | 2.0 | 2.0 | 1237 | $4,495 | $3.63 | 14d | 1 | 1.16mi |
| 7930 Mahogany Run Ln #826 Naples, FL | 3.0 | 2.0 | 1454 | $9,450 | $6.50 | 23d | 1 | 1.16mi |
| 8693 Querce Ct Naples, FL | 2.0 | 2.0 | 1415 | $5,000 | $3.53 | 23d | 1 | 1.17mi |
HOA detail condo
- Monthly dues
- $613 · $7,356/yr
- Likely covers
- poolgym
- Assessments
- None detected in remarks — confirm with the listing agent.
Listing history 12 events
-
2026-06-18days on market $349,900 Active 69 DOM
-
2026-06-17days on market $349,900 Active 68 DOM
-
2026-06-16days on market $349,900 Active 67 DOM
-
2026-06-15days on market $349,900 Active 66 DOM
-
2026-06-14days on market $349,900 Active 64 DOM
-
2026-06-10days on market $349,900 Active 61 DOM
-
2026-06-09days on market $349,900 Active 60 DOM
-
2026-06-08days on market $349,900 Active 59 DOM
-
2026-06-07days on market $349,900 Active 58 DOM
-
2026-06-03days on market $349,900 Active 54 DOM
-
2026-06-03remarks 695-char remark
-
2026-06-03$349,900 Active 53 DOM
ⓘ Source: listings_history table (triggers on properties + properties_extension) + one-shot
backfill from property_details.listing_events for pre-trigger history.
Tax reassessment forecast FL · Resets to sale price
- Current annual tax
- $3,592 · $299/mo
- Projected year-2 tax
- $3,592 · $299/mo
- Expected delta
- $0/yr ($0/mo · 0.0%)
ⓘ Screening estimate from a state-policy table — verify with the county assessor before closing.
Climate risk First Street
- Flood 7/10 Severe FEMA zone AE · 77% chance over 30 yrs
- Wildfire 4/10 Moderate
- Heat 10/10 Extreme 7 d/yr ≥108°F today · 26 d/yr by 30 yrs out
- Wind 10/10 Extreme 99% chance of damaging wind over 30 yrs
- Air quality 2/10 Low 2 unhealthy d/yr today · 2 by 30 yrs out
Nearby sold comps map
Loading sold comps map…
Walkable amenities ~0.75 mi
Loading nearby amenities…
Taxation est. · year 1
- Rental income
- $55,327
- − Mortgage interest
- −$19,600
- − Property taxes
- −$3,592
- − Insurance
- −$6,868
- − Repairs & maintenance
- −$4,426
- − Management
- −$4,426
- − HOA
- −$7,356
- − Depreciation
- −$10,179
- Taxable loss
- −$1,120
- Est. tax savings @ 24.0%
- +$269
- After-tax cash flow
- $4,142/yr
For passive investors: Depreciation is non-cash, so a rental often shows a tax loss while cash-flowing — sheltering income. Rental losses are passive: they offset passive income freely, and up to $25,000/yr can offset ordinary (W-2) income if you actively participate and your MAGI is under $100k (phasing out to $0 by $150k); unused losses carry forward. On sale, claimed depreciation is recaptured at up to 25%, and gains may owe capital-gains tax (a 1031 exchange can defer both). Figures are a year-1 estimate at your 24.0% rate — not tax advice; consult a CPA.
Schools (NCES district)
- District
- Collier
- NCES district ID
- 1200330
- Math proficiency
- 60% ▼ -4.00%
- Reading proficiency
- 56% ▼ -2.00%
- Median HH income
- $58,275
- Composite
- 50.23/100
- National rank
- #1892
- State rank
- #16 of 73 in FL
Livability — Lely Resort
- Score
- 61/100
- State rank
- #786
- US rank
- #17981
Category grades
Schools grade is shown separately in the Schools card above.
Census & demographics
- Census place
- Lely Resort, FL
- County
- Collier County · 396,295 people
- Metro
- Naples-Marco Island, FL
- Population (ZIP)
- 26,056
- Household income
- $81,674
- Rent vs Own
- Severe rent burden
- 954.0
Population outlook (Collier County) Hauer SSP2
- Today (2025)
- 420,858 people
- By 2030
- 450,054 · +6.9%
- By 2040
- 502,232 · +19.3%
- By 2050
- 544,932 · +29.5%
- By 2075
- 627,203 · +49.0%
- By 2100
- 659,015 · +56.6%
Race, ethnicity, and origin ACS 2023
- Neighborhood character
- Diverse neighborhood (Simpson 0.59)
- Race & ethnicity
- White 56% Hispanic / Latino 28% Black 12% Two or more races 11% Asian 2%
- Hispanic origin (detail)
- Mexican 17% Puerto Rican 3% Cuban 2%
- Common ancestry
- Hispanic 10% Romanian 3% Lithuanian 2%
- Foreign-born
- 26% · Canada, Jamaica, Vietnam
- Languages at home
- 63% English-only · Spanish 24% French/Haitian/Cajun 9% Other Indo-European 2%
Political lean MEDSL · Collier
- 2024 margin
- Solid R (+33.1) · D 33.1% · R 66.2%
- 2008→2024 swing
- -10.6pp toward R · 2008: -22.5pp · 2024: -33.1pp
- All cycles
- 2024: R+33.1 2020: R+24.7 2016: R+26.0 2012: R+30.1 2008: R+22.5
Not yet ingested
- Civics
- —
Market trends
- HPI YoY
- ▼ -194.86%
- Current HPI
- 279.4232
- Rent YoY
- ▲ 5.59%
- Metro
- Naples-Marco Island, FL
- State GDP YoY
- ▲ 3.28%
- F500 in state
- 36
Industry mix (Fortune 500 HQ in FL)
| Industry | F500 HQs | Revenue |
|---|---|---|
| Industrial Technology | 2 | $29B |
|
||
| Insurance | 2 | $17B |
|
||
| Retail | 1 | $60B |
|
||
| Technology Distribution | 1 | $58B |
|
||
| Homebuilding | 1 | $35B |
|
||
| Technology Manufacturing | 1 | $35B |
|
||
Price history
+144.9% since first listed7 events — show timeline
- 2026-04-10 Listed $349,900 NAPLESMLS
- 2020-12-09 Sold (Public Records) $188,000 Public Records
- 2020-12-04 Sold (MLS) $188,000 NAPLESMLS
- 2020-10-22 Pending — NAPLESMLS
- 2020-09-04 Listed $195,000 NAPLESMLS
- 2005-03-09 Sold (Public Records) $260,000 Public Records
- 2004-06-11 Sold (Public Records) $142,900 Public Records
Property tax history
+10.2%/yrLatest (2025): $3,592 · +4.2% YoY. Source: county tax records.
Cash-flow waterfall
monthlySold comps — $/sqft
last 12 mo · ≤1 miLoading sold comps…