 Duplex
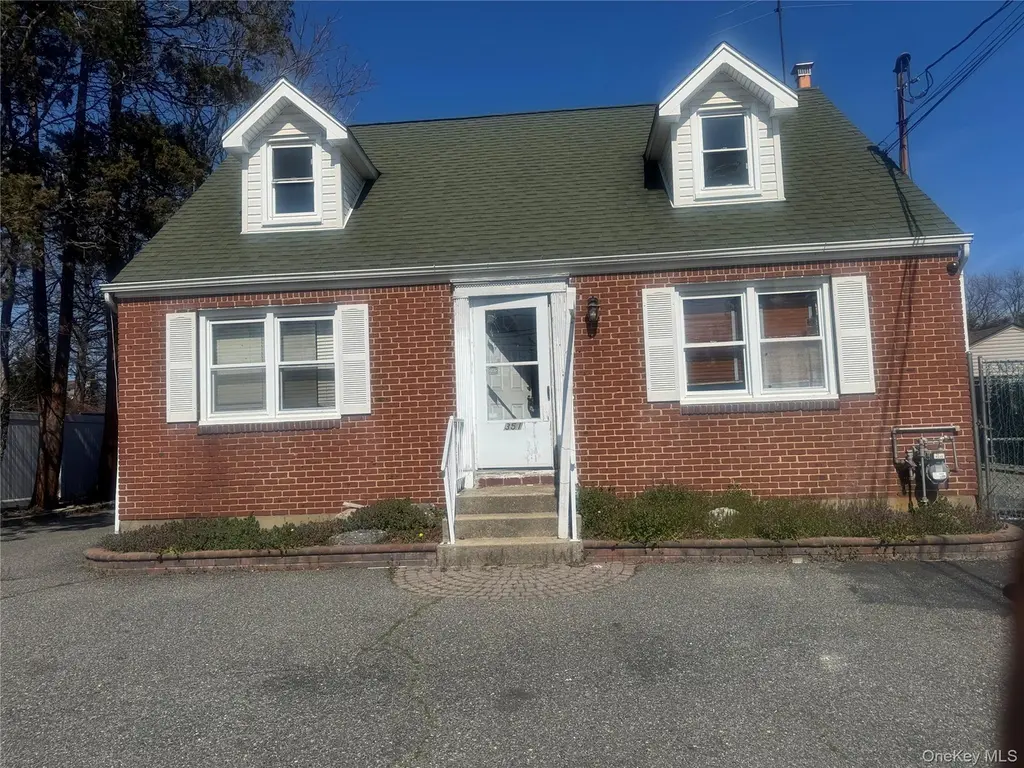
351 E Meadow Ave · East Meadow, NY
Flood risk 1/10 · Minimal
- FEMA flood zone
- X (unshaded)
- Chance of flooding over 30 yrs
- 0.0%
- Est. flood insurance / yr
- $473 – $860
Fire risk 1/10 · Minimal
- Est. fire insurance / yr
- $691 – $1,283
Heat risk 6/10 · Moderate
- Hot days now (above 96°F)
- 7 days/yr
- Hot days in 30 yrs
- 16 days/yr
Wind risk 6/10 · Moderate
- Chance of severe wind over 30 yrs
- 60.0%
Air-quality risk 4/10 · Minor
- Unhealthy air days now
- 5 days/yr
- Unhealthy air days in 30 yrs
- 8 days/yr
Risk factors via First Street. Map © Google.
Why this score? — see what drove the D grade
The composite is a weighted blend of 9 inputs, each scored 0–100. Each bar is that input's sub-score; the figure is the points it added to the 100-point composite (weight × sub-score).
- Cash flow +10.8/30.0
- ARV discount +7.5/15.0
- Schools +7.1/10.0
- Livability +4.3/5.0
- 1% rule +3.2/10.0
- DSCR +3.1/10.0
- Rent growth +2.5/5.0
- Condition / age +2.5/5.0
- Appreciation +0.0/10.0
$740,000
🖨 Deal sheet 📄 Offer letter ✓ Due diligence
Multi-family units
County records classify this as Multi-Family (2-4 Unit). Listing-text estimate: 2 units. confirmed
Listing remarks
Great opportunity to own a 4-bedroom, 2 full bath two-family home with low taxes! This property features a full basement with its own separate entrance, offering excellent potential for extended living space or added income. Conveniently located on a main road and close to shopping, transportation, and all amenities. Home requires updates and is perfect for buyers looking to customize or invest. Don’t miss the chance to make this property your own!
Key facts
- Separate entrance
- Full basement
- Close to amenities
Tags
Property features AI
Exterior
- Parking: Driveway
- Utilities: Public sewer; Electricity available; Natural gas available
- Home design: Duplex
- Construction: Brick construction
- Exterior features: Brick exterior; Not waterfront
Interior
- Bedrooms: Bedroom on the first floor
- Heating & cooling: Natural gas heating; No central cooling
- Interior features: First-floor bedroom; Full basement
Neighborhood map
What this means for you Summary
Snapshot
- This is a 2 × 2-bed/1-bath units multifamily listed at $740k.
Deal economics
- At list price, monthly cash flow is $-340 ($-4k/yr) — negative. Per door: $-170/mo.
- To cash-flow at today's rent, offer at most $680k (8.1% below list).
- To meet the 1% rule (rent ≥ 1% of price), the offer needs to be $603k (18.5% below list).
- Recommended offer: $603k (18.5% below list) — sets the bar for 1% rule.
- Cap rate 5.7% vs local median 3.0% in East Meadow — top-decile yield for the area; either an underpriced asset or a hidden risk that comps aren't pricing in. Stress-test before assuming the spread holds.
Location & tenants
- Location reads 86/100 on livability (#21 in NY, #388 nationally) — a professional / high-income tenant draw. Strengths: amenities A+, commute A+, employment A+; Watch: cost of living F.
- East Meadow Union Free School District (suburban): math 81% / reading 77% proficiency, ranked #48 of 590 in NY (top 8%) — strong family-tenant draw, lease renewals of 3-5y typical; only 12% free/reduced lunch — higher-income household profile.
- Zoned schools: Mcvey Elementary School (math 95% / reading 79%, grade A+, #69 of 2,108 statewide, top 4%, 817 students, 34% FRL); Woodland Middle School (math 62% / reading 71%, grade A-, #114 of 729 statewide, top 16%, 1,151 students, 26% FRL); East Meadow High School (math 98% / reading 98%, grade A+, #13 of 1,100 statewide, top 2%, 1,498 students, 28% FRL) — zoned schools average 29% FRL vs 12% district-wide (17 pts higher); higher-poverty schools than district average — tighter screening recommended.
- Market conditions: 145 active listings in the ZIP; 6 comparable units currently listed for rent nearby; rentals at typical pace (median 15d on market — plan ~3-4 weeks tenant-placement turnaround); high-income renter base; 824 units permitted in Nassau County in 2024 (153 in 5+ unit buildings).
- At $6,034/mo this rent would consume 54% of the median local household income ($134k/yr) (locally 491% of renters already pay >50% of income on rent) — very limited rent-growth headroom before tenants either downsize or default.
Forward outlook
- Local home prices are declining (-3.0%/yr); year-one equity from $5k of loan paydown is wiped out by about $22k of value loss. Plan a longer hold.
- Nassau County population projected at +7% by 2050 — modest demand growth; plan on rents tracking national, not racing it.
Negotiation context
- It's been on market 19 days — a 2% lower offer ($729k) is reasonable based on typical stale-listing flexibility.
- 3 sale attempts since 3y ago with the ask held roughly flat each time — persistent listings suggest the price (not the market) is what's stuck; bring a comps-based counter.
- Current owner paid $215k; list at $740k implies a 244% gain — meaningful room to come down on a strong offer.
Risks & watch-outs
- Watch-outs: built in 1946 — expect roof / HVAC / electrical / plumbing capex.
- Climate carrying-cost: major wind risk, 60% chance of damaging wind over 30y; extreme-heat days projected 7→16/yr by 2055 (HVAC capex compounding) — expect insurance premiums to compound above CPI over the hold.
Questions for the listing agent
- What do current leases actually rent for vs. the listed asking? Can we see a recent rent roll and the last 12 months of T-12 income?
- Can we see the unit-by-unit rent roll, current vacancy, and any below-market leases? What's the average tenancy length?
- What capital expenditures (roof, boiler, parking lot, exteriors) have been made in the last 5 years, and what's planned in the next 2?
- Built in 1946 — when were the roof, HVAC, electrical panel, plumbing, and water heater last replaced?
- Is there a deadline driving the sale (1031 exchange, divorce, estate, relocation)? That informs how much negotiation room exists.
- Schools are A-rated — typically a magnet for longer-tenancy family renters. What's the average tenant stay here, and is there a school-zone premium baked into asking?
- The area grade is low — what's the realistic commute time and amenity access for the typical tenant pool here? Any planned neighborhood developments (good or bad) we should know about?
- What's the average days-on-market for RENTAL listings here right now (not sales)? A rising rental-DOM trend means longer vacancies and softer asking-rent achievability than the comps imply.
- What's the recent tenant-quality profile in this submarket — average credit score on applications, eviction rate, late-payment / NSF rate, and stable-employment percentage? A property-management company in the area should have these aggregated.
- How much new apartment / multifamily construction is in the pipeline within 1–3 miles? Heavy new supply (>2% of stock underway) typically softens rents 12–24 months out; light construction supports rent growth.
Investment metrics
- 1% rule
- 0.82% ✗
- Cap rate
- 5.74%
- Cash-on-cash
- -1.97%
- DSCR
- 0.91
- GRM
- 10.2
CMA / ARV
No comps found within radius.
Projected returns pro-forma
-3.0% appreciation · 3.0% rent growth · sell at horizon
- IRR
- -19.5%
- Equity multiple
- 0.32×
- Total profit
- $-141,509
- Equity at exit
- $110,336
- IRR
- -12.3%
- Equity multiple
- 0.27×
- Total profit
- $-150,792
- Equity at exit
- $63,982
Cash invested: $207,200 (down + closing). Projections, not guarantees.
Landlord ↔ Tenant lean methodology
- Overall (STATE)
- 15 Strongly Tenant-Friendly
- State New York
- 15 Strongly Tenant-Friendly · D+10
- County
- — inherits STATE
- City
- — inherits STATE
ZIP-level market 11554
- Active inventory
- 145
- Price-to-rent
- 20.4×
Monthly cashflow live
- Estimated rent
- $6,034 medium interval (Pro) →
- Mortgage (P&I)
- −$3,881
- Tax from tax record
- −$918 /mo · $11,020/yr
- Insurance
- −$308
- HOA
- −$0
- Vacancy / Maint / Mgmt
- −$1,267
- Net cashflow
- $-340
Break-even live
2-unit breakdown (identical units grouped — click to expand)
| Units | Beds | Baths | Est. rent |
|---|---|---|---|
| 2× units | 2 | 1 | $6,034 |
| #1 | 2 | 1 | $3,017 |
| #2 | 2 | 1 | $3,017 |
| Total (2 units) | $6,034 | ||
UW: 25.0% down · 7.5% · 30yr · 1.5% tax · 5.0% vac · 8.0% maint · 8.0% mgmt
Financing live
Cash to close
- Down payment
- $185,000
- Closing costs
- $22,200
- Reserves months
- —
- Total cash needed
- —
Loan-product check · same deal, 3 products live
Conventional
25% down · 7.5% · 30yr
- Down + closing
- —
- Monthly P&I
- —
- Monthly cashflow
- —
- DSCR
- —
- Eligible?
- —
Personal DTI + credit; lowest rate.
DSCR
20% down · 8.5% · 30yr
- Down + closing
- —
- Monthly P&I
- —
- Monthly cashflow
- —
- DSCR
- —
- Eligible?
- —
No personal income docs; deal must DSCR.
Hard money
10% down · 12.0% · 12mo
- Down + closing
- —
- Monthly P&I
- —
- Monthly cashflow
- —
- DSCR
- —
- Eligible?
- —
Short-term bridge; refi at stabilization.
Rent comps 6 comps
| Address | Beds | Baths | Sqft | Rent | $/sqft | DOM | Units | Dist |
|---|---|---|---|---|---|---|---|---|
| 542 E Meadow Ave East Meadow, NY | 3.0 | 1.0 | 900 | $3,600 | $4.00 | 17d | 1 | 0.35mi |
| 425 Newbridge Rd East Meadow, NY | 1.0–2.0 | 1.0 | 675 | $3,445 | $5.10 | 1d | 1 | 0.85mi |
| 59 Taylor Ave East Meadow, NY | 3.0 | 1.0 | 979 | $4,000 | $4.09 | 15d | 1 | 1.14mi |
| 402 Leslie Ln Uniondale, NY | 3.0 | 2.0 | 1208 | $4,800 | $3.97 | 43d | 1 | 1.25mi |
| 402 Leslie Ln Uniondale, NY | 3.0 | 2.0 | 1206 | $4,800 | $3.98 | 1d | 1 | 1.25mi |
| 965 Merrick Ave Unit 1st floor Merrick, NY | 3.0 | 1.0 | 1200 | $4,200 | $3.50 | 3d | 1 | 1.25mi |
Listing history 13 events
-
2026-04-28status Pending
-
2026-04-09$740,000 Active
-
2026-02-14historical
-
2025-08-13$750,000 Active
-
2023-11-28price $550,000
-
2023-11-28status Pending
-
2023-11-16historical
-
2023-11-15price $650,000
-
2023-11-15price $550,000
-
2023-11-15$450,000 Active
-
2001-01-30soldstatus $215,000
-
1988-04-08soldstatus $220,000
-
1988-02-16soldstatus $185,000
ⓘ Source: listings_history table (triggers on properties + properties_extension) + one-shot
backfill from property_details.listing_events for pre-trigger history.
Tax reassessment forecast NY · Partial reset (capped growth)
- Current annual tax
- $11,020 · $918/mo
- Projected year-2 tax
- $11,763 · $980/mo
- Expected delta
- +$743/yr (+$62/mo · 6.7%)
ⓘ Screening estimate from a state-policy table — verify with the county assessor before closing.
Climate risk First Street
- Flood 1/10 Low FEMA zone X (unshaded) · 0% chance over 30 yrs
- Wildfire 1/10 Low
- Heat 6/10 Major 7 d/yr ≥96°F today · 16 d/yr by 30 yrs out
- Wind 6/10 Major 60% chance of damaging wind over 30 yrs
- Air quality 4/10 Moderate 5 unhealthy d/yr today · 8 by 30 yrs out
Nearby sold comps map
Loading sold comps map…
Walkable amenities ~0.75 mi
Loading nearby amenities…
Taxation est. · year 1
- Rental income
- $72,408
- − Mortgage interest
- −$41,452
- − Property taxes
- −$11,020
- − Insurance
- −$3,700
- − Repairs & maintenance
- −$5,793
- − Management
- −$5,793
- − Depreciation
- −$21,527
- Taxable loss
- −$16,876
- Est. tax savings @ 24.0%
- +$4,050
- After-tax cash flow
- $-35/yr
For passive investors: Depreciation is non-cash, so a rental often shows a tax loss while cash-flowing — sheltering income. Rental losses are passive: they offset passive income freely, and up to $25,000/yr can offset ordinary (W-2) income if you actively participate and your MAGI is under $100k (phasing out to $0 by $150k); unused losses carry forward. On sale, claimed depreciation is recaptured at up to 25%, and gains may owe capital-gains tax (a 1031 exchange can defer both). Figures are a year-1 estimate at your 24.0% rate — not tax advice; consult a CPA.
Schools (NCES district)
- District
- East Meadow Union Free School District
- NCES district ID
- 3609840
- Math proficiency
- 81% ▼ -7.00%
- Reading proficiency
- 77% ▬ 0.00%
- Median HH income
- $95,203
- Composite
- 71.17/100
- National rank
- #236
- State rank
- #48 of 590 in NY
Livability — East Meadow
- Score
- 86/100
- State rank
- #21
- US rank
- #388
Category grades
Schools grade is shown separately in the Schools card above.
Census & demographics
- Census place
- East Meadow, NY
- County
- Nassau County · 653,051 people
- City population
- 36,821
- Metro
- New York-Newark-Jersey City, NY-NJ-PA
- Population (ZIP)
- 36,821
- Household income
- $133,971
- Rent vs Own
- Severe rent burden
- 491.0
Population outlook (Nassau County) Hauer SSP2
- Today (2025)
- 1,409,302 people
- By 2030
- 1,431,482 · +1.6%
- By 2040
- 1,471,607 · +4.4%
- By 2050
- 1,502,845 · +6.6%
- By 2075
- 1,575,403 · +11.8%
- By 2100
- 1,554,356 · +10.3%
Race, ethnicity, and origin ACS 2023
- Neighborhood character
- Diverse neighborhood (Simpson 0.57)
- Race & ethnicity
- White 61% Asian 19% Hispanic / Latino 14% Two or more races 6% Black 4%
- Hispanic origin (detail)
- Mexican 1% Puerto Rican 2% Dominican 3%
- Common ancestry
- Romanian 6% Scotch-Irish 4% Russian 1%
- Foreign-born
- 20% · Canada, China, South Korea
- Languages at home
- 68% English-only · Other Indo-European 12% Spanish 9% Russian/Polish/Slavic 3%
Political lean MEDSL · Nassau
- 2024 margin
- Toss-up / Even · D 47.9% · R 52.1%
- 2008→2024 swing
- -12.6pp toward R · 2008: 8.4pp · 2024: -4.2pp
- All cycles
- 2024: R+4.2 2020: D+9.5 2016: D+5.3 2012: D+6.7 2008: D+8.4
Not yet ingested
- Civics
- —
Market trends
- HPI YoY
- ▼ -721.13%
- Current HPI
- 323.32
- Rent YoY
- —
- Metro
- New York-Newark-Jersey City, NY-NJ-PA
- State GDP YoY
- ▲ 2.60%
- F500 in state
- 92
Industry mix (Fortune 500 HQ in NY)
| Industry | F500 HQs | Revenue |
|---|---|---|
| Financial Services | 10 | $950B |
|
||
| Consumer Goods | 9 | $162B |
|
||
| Insurance | 4 | $225B |
|
||
| Telecommunications | 2 | $144B |
|
||
| Pharmaceuticals | 2 | $112B |
|
||
| Media / Entertainment | 2 | $69B |
|
||
Price history
+300.0% since first listed13 events — show timeline
- 2026-04-28 Pending — OneKey® MLS as Distributed by MLS Grid
- 2026-04-09 Listed $740,000 OneKey® MLS as Distributed by MLS Grid
- 2026-02-14 Listing Removed — OneKey® MLS as Distributed by MLS Grid
- 2025-08-13 Listed $750,000 OneKey® MLS as Distributed by MLS Grid
- 2023-11-28 Price Changed $550,000 OneKey® MLS as Distributed by MLS Grid
- 2023-11-28 Pending — OneKey® MLS as Distributed by MLS Grid
- 2023-11-16 Listing Removed — OneKey® MLS as Distributed by MLS Grid
- 2023-11-15 Price Changed $650,000 OneKey® MLS as Distributed by MLS Grid
- 2023-11-15 Price Changed $550,000 OneKey® MLS as Distributed by MLS Grid
- 2023-11-15 Listed $450,000 OneKey® MLS as Distributed by MLS Grid
- 2001-01-30 Sold (Public Records) $215,000 Public Records
- 1988-04-08 Sold (Public Records) $220,000 Public Records
- 1988-02-16 Sold (Public Records) $185,000 Public Records
Property tax history
+1.8%/yrLatest (2024): $11,020 · -0.5% YoY. Source: county tax records.
Cash-flow waterfall
monthlySold comps — $/sqft
last 12 mo · ≤1 miLoading sold comps…