 🌊 Lakefront
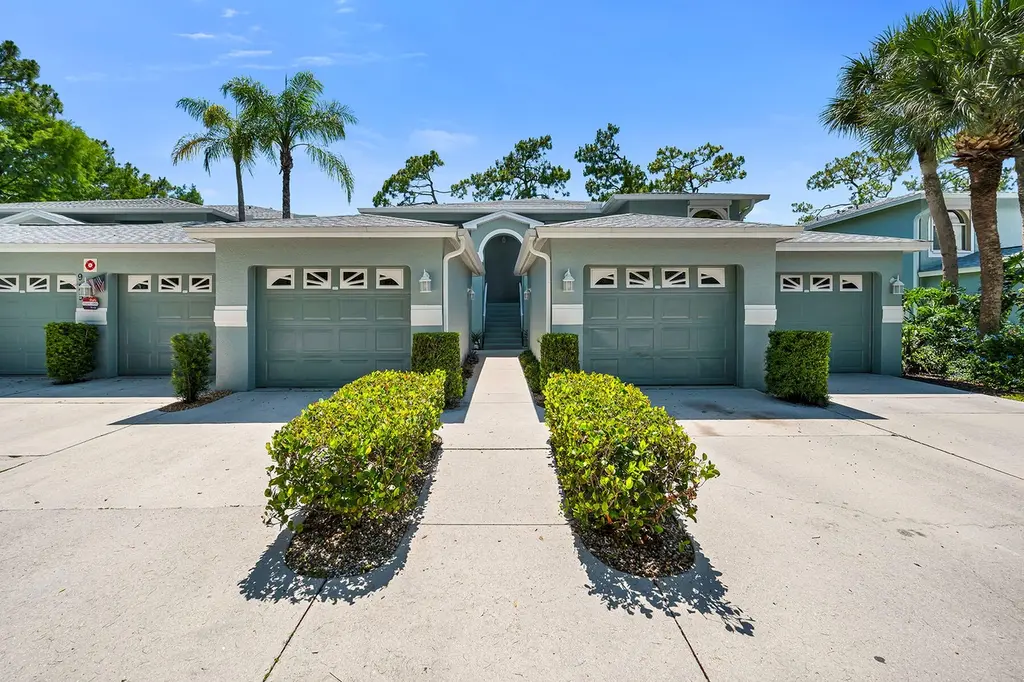
925 New Waterford Dr #104 · Berkshire Lakes, FL
Flood risk 5/10 · Moderate
- FEMA flood zone
- X (shaded)
- Chance of flooding over 30 yrs
- 0.26%
- Est. flood insurance / yr
- $507 – $1,088
Fire risk 1/10 · Minimal
- Est. fire insurance / yr
- $947 – $1,759
Heat risk 10/10 · Severe
- Hot days now (above 107°F)
- 7 days/yr
- Hot days in 30 yrs
- 29 days/yr
Wind risk 10/10 · Severe
- Chance of severe wind over 30 yrs
- 99.0%
Air-quality risk 2/10 · Minimal
- Unhealthy air days now
- 2 days/yr
- Unhealthy air days in 30 yrs
- 2 days/yr
Risk factors via First Street. Map © Google.
Why this score? — see what drove the D grade
The composite is a weighted blend of 9 inputs, each scored 0–100. Each bar is that input's sub-score; the figure is the points it added to the 100-point composite (weight × sub-score).
- Cash flow +14.0/30.0
- ARV discount +7.5/15.0
- 1% rule +5.1/10.0
- Schools +5.0/10.0
- DSCR +4.2/10.0
- Livability +2.5/5.0
- Condition / age +2.5/5.0
- Rent growth +2.2/5.0
- Appreciation +0.0/10.0
$329,000
🖨 Deal sheet (PDF) 📄 Offer letter ✓ Due diligence
Listing remarks MLS
Enjoy sweeping lake views and coveted western exposure from this beautifully positioned corner residence, where natural light fills the living spaces and stunning sunset vistas create a picturesque backdrop for everyday living. Offering a desirable 3-bedroom, 2-bath floor plan with a 1-car garage, this inviting home blends comfort, functionality, and a serene waterfront setting. Sliding glass doors open to a screened lanai with a ceiling fan, providing the perfect place to relax, dine, or entertain while taking in the tranquil water views. Inside, the thoughtfully designed layout features tile flooring throughout, creating a cohesive look and easy maintenance. The spacious living and dining area flows seamlessly together, offering an open and welcoming atmosphere. The living room is enhanced by a ceiling fan and direct access to the lanai, creating an effortless indoor-outdoor connection. The kitchen is equipped with GE stainless steel appliances, including a dishwasher, microwave, range, and refrigerator with freezer and icemaker. A convenient pantry provides additional storage, and the breakfast bar overlooks the dining and living areas, making it ideal for both casual meals and entertaining. The primary suite serves as a peaceful retreat, filled with bright natural light and featuring tile flooring, a ceiling fan, and a generous walk-in closet. The ensuite bath offers dual sinks and a glass walk-in shower. Two guest bedrooms each include tile flooring, ceiling fans, and closet space, while the full guest bath located off the hallway features a shower/tub combination. A dedicated laundry room is complete with a GE washer and dryer for added convenience. Residents enjoy access to an array of community amenities, including a sparkling community pool, bocce courts, and tennis courts. Combining desirable lakefront views, western exposure, a sought-after corner location, and a functional floor plan, this residence offers an exceptional opportunity to enjoy the best of Florida living.
Key facts
- Ceiling fan
- Lake views
- Western exposure
Tags
Property features AI
Finance
- Other: Complex contains 168 units; 8 units in building; 1 unit per floor; single-story units
- HOA & community: Mandatory HOA; Annual HOA fee of $630; Quarterly condo fee of $1,275; Maintenance covers cable, internet/Wi-Fi, lawn/land maintenance, legal/accounting, recreation facilities, street lights, and street maintenance; Condo-managed community; Community amenities include clubhouse, community pool, tennis courts, pickleball, fishing pier, bike and jog path, sidewalks; Non-gated community; Total annual recurring fees: $5,730; Total one-time fees: $150
Exterior
- Parking: 1 assigned covered deeded parking space; Detached garage; Guest parking available
- Utilities: Central water; Central sewer; Cable available
- Home design: Residential property; Low-rise (1–3) building; End-unit; Rear exposure faces west; Located in Berkshire Lakes / New Waterford community
- Construction: Built in 1992; Concrete block construction; Stucco exterior; Shingle roof; Single-hung windows
- Exterior features: Screened lanai/porch; Patio; Lake and landscaped area views; Central irrigation
Interior
- Kitchen: Pantry; Dishwasher; Disposal; Microwave; Range; Self-cleaning oven; Refrigerator / Freezer; Refrigerator with icemaker
- Bedrooms: 3 bedrooms; Master bedroom on ground level
- Flooring: Tile
- Bathrooms: 2 full bathrooms; Master bath with dual sinks and shower (no tub)
- Heating & cooling: Central electric heat; Central electric cooling; Ceiling fans
- Interior features: Built-in cabinets; Cable prewire; Pantry; Walk-in closet; Great room floor plan; Partially furnished
- Laundry & utility: Washer; Dryer; Laundry in residence; Auto garage door; Smoke detector
Neighborhood map
What this means for you Summary
Snapshot
- This is a 3-bed/2.0-bath condo listed at $329k.
Deal economics
- At list price, monthly cash flow is $42 ($505/yr) — positive.
- The deal already cash-flows at list — no discount required.
- Meets the 1% rule at list price ($3k rent vs $329k).
- Recommended offer: $324k (1.5% below list) — sets the bar for market timing.
Location & tenants
- Location reads: area grade D — affects rentability + tenant quality, not the cash-flow math above.
- Collier (suburban): math 60% / reading 56% proficiency, ranked #16 of 73 in FL (top 22%) — acceptable for families but not a draw, mixed tenant base, ~2y average lease.
- Zoned schools: Calusa Park Elementary School (math 59% / reading 56%, grade C+, #764 of 2,144 statewide, top 36%, 707 students, 62% FRL); East Naples Middle School (math 56% / reading 44%, grade C, #254 of 571 statewide, top 45%, 854 students, 63% FRL); Lely High School (math 40% / reading 39%, grade F, #304 of 667 statewide, top 47%, 1,504 students, 54% FRL) — zoned schools at 60% FRL track the district average.
- Market conditions: Rents soft (-1.1%/yr); 438 active listings in the ZIP; 40 comparable units currently listed for rent nearby; rentals at typical pace (median 23d on market — plan ~3-4 weeks tenant-placement turnaround); 3,520 units permitted in Collier County in 2024 (959 in 5+ unit buildings).
- At $3,325/mo this rent would consume 56% of the median local household income ($72k/yr) (locally 1423% of renters already pay >50% of income on rent) — very limited rent-growth headroom before tenants either downsize or default.
Forward outlook
- Local home prices are declining (-3.0%/yr); year-one equity from $2k of loan paydown is wiped out by about $10k of value loss. Plan a longer hold.
- Collier County population projected at +30% by 2050 — long-run rental-demand tailwind backs the buy-and-hold thesis.
Negotiation context
- It's been on market 17 days — a 2% lower offer ($324k) is reasonable based on typical stale-listing flexibility.
- 2 sale attempts with the ask held roughly flat each time — persistent listings suggest the price (not the market) is what's stuck; bring a comps-based counter.
Risks & watch-outs
- Climate carrying-cost: moderate flood risk; severe wind risk, 99% chance of damaging wind over 30y; extreme-heat days projected 7→29/yr by 2055 (HVAC capex compounding) — expect insurance premiums to compound above CPI over the hold.
Questions for the listing agent
- What does the HOA fee cover, when was the last increase, and are there any pending special assessments or reserve-fund shortfalls?
- Any open or pending special assessments — roof, HVAC, plumbing, elevator, façade? What's the per-unit balance and payoff schedule, and is the seller paying it off at close or rolling it to the buyer?
- Is there a deadline driving the sale (1031 exchange, divorce, estate, relocation)? That informs how much negotiation room exists.
- The area grade is low — what's the realistic commute time and amenity access for the typical tenant pool here? Any planned neighborhood developments (good or bad) we should know about?
- This sits on a lake — are riparian / water-frontage rights deeded with the parcel? Any dock permits, shoreline easements, or HOA water-use restrictions?
- What's the documented flood / surge / shoreline-erosion history here (FEMA AND non-FEMA — e.g., storm surge, creek backup, septic-field saturation)?
- Any water-quality or seasonal algae-bloom issues that affect tenant satisfaction or short-term-rental demand?
- What's the average days-on-market for RENTAL listings here right now (not sales)? A rising rental-DOM trend means longer vacancies and softer asking-rent achievability than the comps imply.
- What's the recent tenant-quality profile in this submarket — average credit score on applications, eviction rate, late-payment / NSF rate, and stable-employment percentage? A property-management company in the area should have these aggregated.
- How much new apartment / multifamily construction is in the pipeline within 1–3 miles? Heavy new supply (>2% of stock underway) typically softens rents 12–24 months out; light construction supports rent growth.
Investment metrics
- 1% rule
- 1.01% ✓
- Cap rate
- 6.45%
- Cash-on-cash
- 0.55%
- DSCR
- 1.02
- GRM
- 8.2
CMA / ARV
No comps found within radius.
Projected returns pro-forma
-3.0% appreciation · 0.0% rent growth · sell at horizon
- IRR
- -19.2%
- Equity multiple
- 0.35×
- Total profit
- $-60,134
- Equity at exit
- $49,055
- IRR
- -21.2%
- Equity multiple
- 0.07×
- Total profit
- $-85,588
- Equity at exit
- $28,446
Cash invested: $92,120 (down + closing). Projections, not guarantees.
Landlord ↔ Tenant lean methodology
- Overall (STATE)
- 87 Strongly Landlord-Friendly
- State Florida
- 87 Strongly Landlord-Friendly · R+3
- County
- — inherits STATE
- City
- — inherits STATE
ZIP-level market 34104
- Rents YoY
- -1.1%
- Active inventory
- 438
- Price-to-rent
- 8.2×
Monthly cashflow live
- Estimated rent
- $3,325 high interval (Pro) →
- Mortgage (P&I)
- −$1,725
- Tax from tax record
- −$245 /mo · $2,942/yr
- Insurance
- −$137
- HOA
- −$477
- Vacancy / Maint / Mgmt
- −$698
- Net cashflow
- $42
Break-even live
Sensitivity live
| Price | -10% $228 | -5% $135 | +0% $42 | +5% $-51 | +10% $-144 |
|---|---|---|---|---|---|
| Rent | -10% $-221 | -5% $-89 | +0% $42 | +5% $173 | +10% $305 |
| Rate | -1.0pp $208 | -0.5pp $126 | base $42 | +0.5pp $-43 | +1.0pp $-130 |
UW: 25.0% down · 7.5% · 30yr · 1.5% tax · 5.0% vac · 8.0% maint · 8.0% mgmt
Financing live
Cash to close
- Down payment
- $82,250
- Closing costs
- $9,870
- Reserves months
- —
- Total cash needed
- —
Loan-product check · same deal, 3 products live
Conventional
25% down · 7.5% · 30yr
- Down + closing
- —
- Monthly P&I
- —
- Monthly cashflow
- —
- DSCR
- —
- Eligible?
- —
Personal DTI + credit; lowest rate.
DSCR
20% down · 8.5% · 30yr
- Down + closing
- —
- Monthly P&I
- —
- Monthly cashflow
- —
- DSCR
- —
- Eligible?
- —
No personal income docs; deal must DSCR.
Hard money
10% down · 12.0% · 12mo
- Down + closing
- —
- Monthly P&I
- —
- Monthly cashflow
- —
- DSCR
- —
- Eligible?
- —
Short-term bridge; refi at stabilization.
Rent comps 40 comps
| Address | Beds | Baths | Sqft | Rent | $/sqft | DOM | Units | Dist |
|---|---|---|---|---|---|---|---|---|
| 915 New Waterford Dr Unit H201 Naples, FL | 2.0 | 2.0 | 1362 | $4,150 | $3.05 | 15d | 1 | 0.05mi |
| 717 Landover Cir #103 Naples, FL | 2.0 | 2.0 | 1300 | $3,800 | $2.92 | 25d | 1 | 0.09mi |
| 800 New Waterford Dr #201 Naples, FL | 2.0 | 2.0 | 1362 | $2,440 | $1.79 | 23d | 1 | 0.09mi |
| 636 Windsor Sq #102 Naples, FL | 2.0 | 2.0 | 1191 | $3,750 | $3.15 | 25d | 1 | 0.09mi |
| 716 Landover Cir #102 Naples, FL | 2.0 | 2.0 | 1300 | $3,200 | $2.46 | 25d | 1 | 0.09mi |
| 613 Windsor Sq #101 Naples, FL | 2.0 | 2.0 | 1316 | $3,800 | $2.89 | 25d | 1 | 0.14mi |
| 565 Windsor Sq #201 Naples, FL | 3.0 | 2.0 | 1421 | $3,800 | $2.67 | 23d | 1 | 0.18mi |
| 661 Squire Cir #101 Naples, FL | 3.0 | 2.0 | 1450 | $2,095 | $1.44 | 15d | 1 | 0.20mi |
| 505 Windsor Sq #201 Naples, FL | 3.0 | 2.0 | 1191 | $2,365 | $1.99 | 15d | 1 | 0.21mi |
| 541 Windsor Sq Unit 9 Naples, FL | 2.0 | 2.0 | 1421 | $2,500 | $1.76 | 15d | 1 | 0.21mi |
| 1220 Commonwealth Cir Unit M106 Naples, FL | 2.0 | 2.0 | 1245 | $2,100 | $1.69 | 25d | 1 | 0.26mi |
| 1130 Partridge Cir Unit Annual Naples, FL | 2.0 | 2.0 | 1191 | $1,950 | $1.64 | 25d | 1 | 0.27mi |
| 1130 Partridge Cir Ofc Season Naples, FL | 2.0 | 2.0 | 1191 | $1,800 | $1.51 | 25d | 1 | 0.27mi |
| 1130 Partridge Cir #102 Naples, FL | 2.0 | 2.0 | 1191 | $3,800 | $3.19 | 25d | 1 | 0.27mi |
| 1095 Partridge Cir #201 Naples, FL | 2.0 | 2.0 | 1402 | $1,800 | $1.28 | 23d | 1 | 0.28mi |
| 1228 Commonwealth Cir Unit O203 Naples, FL | 2.0 | 2.0 | 1245 | $2,100 | $1.69 | 15d | 1 | 0.29mi |
| 1200 Commonwealth Cir #103 Naples, FL | 2.0 | 2.0 | 1245 | $1,875 | $1.51 | 15d | 1 | 0.31mi |
| 529 Mardel Dr #311 Naples, FL | 2.0 | 2.0 | 1093 | $3,500 | $3.20 | 25d | 1 | 0.32mi |
| 920 Belville Blvd Naples, FL | 3.0 | 2.0 | 1606 | $6,000 | $3.74 | 25d | 1 | 0.37mi |
| 322 Melrose Pl #31 Naples, FL | 2.0 | 2.0 | 1757 | $4,500 | $2.56 | 25d | 1 | 0.43mi |
| 6643 Craven Hill Way Naples, FL | 3.0 | 2.0 | 1384 | $2,900 | $2.10 | 15d | 1 | 0.50mi |
| 333 Wentworth Ct Naples, FL | 3.0 | 2.0 | 1807 | $7,000 | $3.87 | 25d | 1 | 0.51mi |
| 191 Bennington Dr Unit 12-6 Naples, FL | 2.0 | 2.0 | 1240 | $1,450 | $1.17 | 25d | 1 | 0.53mi |
| 1357 Churchill Cir Unit G202 Naples, FL | 2.0 | 2.0 | 1200 | $1,995 | $1.66 | 15d | 1 | 0.54mi |
| 242 Belville Blvd Naples, FL | 3.0 | 2.0 | 1875 | $9,000 | $4.80 | 23d | 1 | 0.57mi |
| 1392 Churchill Cir Unit O101 Naples, FL | 3.0 | 2.0 | 1350 | $2,300 | $1.70 | 15d | 1 | 0.58mi |
| 589 Lambton Ln Naples, FL | 3.0 | 2.0 | 1823 | $7,750 | $4.25 | 25d | 1 | 0.59mi |
| 1448 Churchill Cir #103 Naples, FL | 2.0 | 2.0 | 1200 | $1,900 | $1.58 | 15d | 1 | 0.60mi |
| 6726 Sloane Pl Unit 1049716P Naples, FL | 3.0 | 2.0 | 1872 | $5,748 | $3.07 | 15d | 1 | 0.70mi |
| 1600 Wellesley Cir Naples, FL | 1.0–2.0 | 1.0–2.0 | 950 | $1,900 | $2.00 | 15d | 12 | 0.75mi |
| 92 Glen Eagle Cir Naples, FL | 3.0 | 2.0 | 1562 | $12,000 | $7.68 | 23d | 1 | 0.76mi |
| 7832 Meridan Ct Naples, FL | 2.0 | 2.0 | 1567 | $4,500 | $2.87 | 25d | 1 | 0.85mi |
| 6871 Sterling Greens Dr #202 Naples, FL | 2.0 | 2.0 | 1727 | $5,500 | $3.18 | 15d | 1 | 0.86mi |
| 7753 Haverhill Ct Naples, FL | 2.0 | 2.0 | 1840 | $2,800 | $1.52 | 25d | 1 | 0.87mi |
| 6854 Sterling Greens Dr #201 Naples, FL | 3.0 | 2.0 | 1727 | $4,500 | $2.61 | 15d | 1 | 0.94mi |
| 7320 Glenmoor Ln Unit 2206 Naples, FL | 2.0 | 2.0 | 1053 | $6,000 | $5.70 | 15d | 1 | 0.95mi |
| 7790 Woodbrook Cir #2603 Naples, FL | 3.0 | 2.5 | 1406 | $4,500 | $3.20 | 25d | 1 | 0.95mi |
| 3536 Winifred Row Ln Naples, FL | 3.0 | 2.5 | 1300 | $2,350 | $1.81 | 15d | 10 | 0.95mi |
| 2026 Terrazzo Ln Naples, FL | 3.0 | 2.0 | 1856 | $9,000 | $4.85 | 25d | 1 | 0.96mi |
| 1499 Vintage Ln Naples, FL | 3.0 | 2.0 | 1754 | $9,000 | $5.13 | 25d | 1 | 0.98mi |
HOA detail condo
- Monthly dues
- $477 · $5,724/yr
- Likely covers
- waterpool
- Assessments
- None detected in remarks — confirm with the listing agent.
Listing history 11 events
-
2026-06-21days on market $329,000 Active 17 DOM
-
2026-06-18days on market $329,000 Active 14 DOM
-
2026-06-17days on market $329,000 Active 13 DOM
-
2026-06-16days on market $329,000 Active 12 DOM
-
2026-06-15days on market $329,000 Active 11 DOM
-
2026-06-14days on market $329,000 Active 9 DOM
-
2026-06-10days on market $329,000 Active 6 DOM
-
2026-06-09days on market $329,000 Active 5 DOM
-
2026-06-08days on market $329,000 Active 4 DOM
-
2026-06-07remarks 699-char remark
-
2026-06-07$329,000 Active 3 DOM
ⓘ Source: listings_history table (triggers on properties + properties_extension) + one-shot
backfill from property_details.listing_events for pre-trigger history.
Tax reassessment forecast FL · Resets to sale price
- Current annual tax
- $2,942 · $245/mo
- Projected year-2 tax
- $2,942 · $245/mo
- Expected delta
- $0/yr ($0/mo · 0.0%)
ⓘ Screening estimate from a state-policy table — verify with the county assessor before closing.
Climate risk First Street
- Flood 5/10 Major FEMA zone X (shaded) · 26% chance over 30 yrs
- Wildfire 1/10 Low
- Heat 10/10 Extreme 7 d/yr ≥107°F today · 29 d/yr by 30 yrs out
- Wind 10/10 Extreme 99% chance of damaging wind over 30 yrs
- Air quality 2/10 Low 2 unhealthy d/yr today · 2 by 30 yrs out
Nearby sold comps map
Loading sold comps map…
Walkable amenities ~0.75 mi
Loading nearby amenities…
Taxation est. · year 1
- Rental income
- $39,898
- − Mortgage interest
- −$18,429
- − Property taxes
- −$2,942
- − Insurance
- −$1,645
- − Repairs & maintenance
- −$3,192
- − Management
- −$3,192
- − HOA
- −$5,724
- − Depreciation
- −$9,571
- Taxable loss
- −$4,796
- Est. tax savings @ 24.0%
- +$1,151
- After-tax cash flow
- $1,656/yr
For passive investors: Depreciation is non-cash, so a rental often shows a tax loss while cash-flowing — sheltering income. Rental losses are passive: they offset passive income freely, and up to $25,000/yr can offset ordinary (W-2) income if you actively participate and your MAGI is under $100k (phasing out to $0 by $150k); unused losses carry forward. On sale, claimed depreciation is recaptured at up to 25%, and gains may owe capital-gains tax (a 1031 exchange can defer both). Figures are a year-1 estimate at your 24.0% rate — not tax advice; consult a CPA.
Schools (NCES district)
- District
- Collier
- NCES district ID
- 1200330
- Math proficiency
- 60% ▼ -4.00%
- Reading proficiency
- 56% ▼ -2.00%
- Median HH income
- $58,275
- Composite
- 50.23/100
- National rank
- #1892
- State rank
- #16 of 73 in FL
Livability — Berkshire Lakes
No livability data for this city. (Only ~50 U.S. cities are tracked.)
Census & demographics
- Census place
- Berkshire Lakes, FL
- County
- Collier County · 396,295 people
- Metro
- Naples-Marco Island, FL
- Population (ZIP)
- 26,408
- Household income
- $71,686
- Rent vs Own
- Severe rent burden
- 1423.0
Population outlook (Collier County) Hauer SSP2
- Today (2025)
- 420,858 people
- By 2030
- 450,054 · +6.9%
- By 2040
- 502,232 · +19.3%
- By 2050
- 544,932 · +29.5%
- By 2075
- 627,203 · +49.0%
- By 2100
- 659,015 · +56.6%
Race, ethnicity, and origin ACS 2023
- Neighborhood character
- Majority White (62%)
- Race & ethnicity
- White 62% Hispanic / Latino 30% Two or more races 19% Black 4% Asian 2%
- Hispanic origin (detail)
- Mexican 7% Puerto Rican 3% Cuban 6% Dominican 1%
- Common ancestry
- Lithuanian 6% Romanian 3% Hispanic 2%
- Foreign-born
- 30% · Canada, Jamaica, Dominican Republic
- Languages at home
- 66% English-only · Spanish 24% French/Haitian/Cajun 5% Russian/Polish/Slavic 1%
Political lean MEDSL · Collier
- 2024 margin
- Solid R (+33.1) · D 33.1% · R 66.2%
- 2008→2024 swing
- -10.6pp toward R · 2008: -22.5pp · 2024: -33.1pp
- All cycles
- 2024: R+33.1 2020: R+24.7 2016: R+26.0 2012: R+30.1 2008: R+22.5
Not yet ingested
- Civics
- —
Market trends
- HPI YoY
- ▼ -252.48%
- Current HPI
- 259.3498
- Rent YoY
- ▼ -1.10%
- Metro
- Naples-Marco Island, FL
- State GDP YoY
- ▲ 3.28%
- F500 in state
- 36
Industry mix (Fortune 500 HQ in FL)
| Industry | F500 HQs | Revenue |
|---|---|---|
| Industrial Technology | 2 | $29B |
|
||
| Insurance | 2 | $17B |
|
||
| Retail | 1 | $60B |
|
||
| Technology Distribution | 1 | $58B |
|
||
| Homebuilding | 1 | $35B |
|
||
| Technology Manufacturing | 1 | $35B |
|
||
Price history
+239.2% since first listed8 events — show timeline
- 2026-06-04 Listed $329,000 MIML
- 2026-06-04 Listed $329,000 NAPLESMLS
- 2022-06-30 Sold (Public Records) $380,000 Public Records
- 2018-01-02 Sold (Public Records) $170,000 Public Records
- 2017-07-13 Price Changed $199,900 BEARMLS
- 2017-05-02 Price Changed $209,900 BEARMLS
- 2001-09-10 Sold (Public Records) $124,900 Public Records
- 1995-07-06 Sold (Public Records) $97,000 Public Records
Property tax history
+5.9%/yrLatest (2025): $2,942 · +5.3% YoY. Source: county tax records.
Cash-flow waterfall
monthlySold comps — $/sqft
last 12 mo · ≤1 miLoading sold comps…