651 Willow Bend Ln · Rock Creek, AL
Flood risk 1/10 · Minimal
- FEMA flood zone
- X (unshaded)
- Chance of flooding over 30 yrs
- 0.0%
- Est. flood insurance / yr
- $507 – $1,088
Fire risk 5/10 · Moderate
- Est. fire insurance / yr
- $916 – $1,700
Heat risk 6/10 · Moderate
- Hot days now (above 108°F)
- 7 days/yr
- Hot days in 30 yrs
- 20 days/yr
Wind risk 6/10 · Moderate
- Chance of severe wind over 30 yrs
- 44.0%
Air-quality risk 3/10 · Minor
- Unhealthy air days now
- 2 days/yr
- Unhealthy air days in 30 yrs
- 4 days/yr
Risk factors via First Street. Map © Google.
Why this score? — see what drove the D+ grade
The composite is a weighted blend of 9 inputs, each scored 0–100. Each bar is that input's sub-score; the figure is the points it added to the 100-point composite (weight × sub-score).
- Cash flow +18.2/30.0
- DSCR +5.7/10.0
- ARV discount +5.5/15.0
- Appreciation +4.7/10.0
- 1% rule +3.6/10.0
- Rent growth +2.9/5.0
- Livability +2.9/5.0
- Condition / age +2.5/5.0
- Schools +1.8/10.0
$169,900
🖨 Deal sheet 📄 Offer letter ✓ Due diligence
Listing remarks MLS
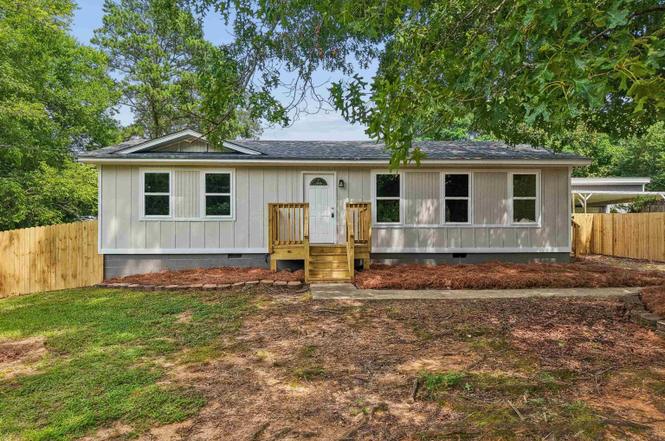
Welcome to this updated 3-bedroom, 1 full bathroom home located in the desirable Oak Grove School District and nestled in the Willow Bend community. Move-in ready and full of updates, this home offers a comfortable layout with updated finishes throughout. The kitchen features brand-new cabinetry, new countertops, and a stainless appliance package, creating a fresh and functional space for everyday living. Outside, you’ll find a large insulated storage building that provides excellent space for storage, hobbies, or workshop use. Conveniently located near schools, shopping, dining, and everyday conveniences, this home offers an affordable opportunity to own a well-maintained property in a great location. Don’t miss your chance to make this one yours!
Key facts
- Updated finishes
- New countertops
- Brand-new cabinetry
Tags
Neighborhood map
What this means for you Summary
Snapshot
- This is a 3-bed/1.0-bath single-family listed at $170k.
Deal economics
- At list price, monthly cash flow is $154 ($2k/yr) — positive.
- The deal already cash-flows at list — no discount required.
- To meet the 1% rule (rent ≥ 1% of price), the offer needs to be $147k (13.7% below list).
- Recommended offer: $147k (13.7% below list) — sets the bar for 1% rule.
Location & tenants
- Location reads 57/100 on livability (#401 in AL) — a working-class tenant base; expect higher turnover. Strengths: crime A+, cost of living A+, housing A-; Watch: employment D, schools F, amenities F.
- Jefferson County (suburban): math 9% / reading 32% proficiency, ranked #104 of 129 in AL (top 81%) — low school quality limits family demand, transient renter base, plan for 1-2y turnover.
- Market conditions: Rents rising (+1.6%/yr); 250 active listings in the ZIP; 1 comparable units currently listed for rent nearby; 2,114 units permitted in Jefferson County in 2024 (556 in 5+ unit buildings).
Forward outlook
- In year one you build about $156 of equity ($1k loan paydown + $-1k appreciation (-0.6% local appreciation)).
- Jefferson County population projected to shrink 4% by 2050 — rents likely to lag national; underwrite the cash flow, not the appreciation.
Negotiation context
- Only 5 days on market — expect competitive offers; lowballing is unlikely to land.
- Current owner paid $113k; list at $170k implies a 50% gain — meaningful room to come down on a strong offer.
Risks & watch-outs
- Climate carrying-cost: major wind risk, 44% chance of damaging wind over 30y; moderate wildfire risk; extreme-heat days projected 7→20/yr by 2055 (HVAC capex compounding) — expect insurance premiums to compound above CPI over the hold.
Questions for the listing agent
- Is there a deadline driving the sale (1031 exchange, divorce, estate, relocation)? That informs how much negotiation room exists.
- Schools are F-rated, which usually means shorter tenancies and higher turnover. Who's the typical renter profile here, and what's been the actual vacancy rate?
- The area grade is low — what's the realistic commute time and amenity access for the typical tenant pool here? Any planned neighborhood developments (good or bad) we should know about?
- What's the average days-on-market for RENTAL listings here right now (not sales)? A rising rental-DOM trend means longer vacancies and softer asking-rent achievability than the comps imply.
- What's the recent tenant-quality profile in this submarket — average credit score on applications, eviction rate, late-payment / NSF rate, and stable-employment percentage? A property-management company in the area should have these aggregated.
- How much new for-sale + rental construction is in the pipeline within 1–3 miles? Heavy new supply typically softens prices + rents 12–24 months out; constrained supply supports both.
Investment metrics
- 1% rule
- 0.86% ✗
- Cap rate
- 7.38%
- Cash-on-cash
- 3.88%
- DSCR
- 1.17
- GRM
- 9.7
CMA / ARV
- ARV (on-the-fly)
- $162,624
- Comps found
- 7
Show comp detail 7 sales within ~0.75 mi
| Address | Dist | Beds/Ba | Sqft | Sold | Price | $/sf | Match |
|---|---|---|---|---|---|---|---|
| 630 Willow Bend Ln | 0.05mi | 3/1.0 | 1,136 (+8%) | 1mo | $95,000 | $84 | 84 |
| 807 Bahia Ln | 0.25mi | 3/1.0 | 1,010 (-4%) | 16mo | $160,000 | $158 | 68 |
| 841 Willow Bend Ln | 0.28mi | 3/1.0 | 1,008 (-4%) | 15mo | $165,900 | $165 | 67 |
| 823 Bahia Ln | 0.32mi | 3/2.0 | 1,036 (-2%) | 13mo | $160,000 | $154 | 67 |
| 1536 Old Rock Creek Rd | 0.42mi | 3/2.0 | 1,072 (+2%) | 11mo | $173,000 | $161 | 65 |
| 741 Willow Bend Ln | 0.15mi | 2/1.0 (-1) | 1,173 (+11%) | 19mo | $160,000 | $136 | 53 |
| 832 Bahia Ln | 0.35mi | 3/2.0 | 1,175 (+11%) | 10mo | $135,000 | $115 | 52 |
Match score weights: distance 35% · size 25% · config 20% · recency 20%. Top-matched comps best support the ARV.
Projected returns pro-forma
-0.6% appreciation · 1.6% rent growth · sell at horizon
- IRR
- -1.0%
- Equity multiple
- 0.96×
- Total profit
- $-2,035
- Equity at exit
- $44,298
- IRR
- 4.2%
- Equity multiple
- 1.41×
- Total profit
- $19,456
- Equity at exit
- $49,378
Cash invested: $47,572 (down + closing). Projections, not guarantees.
Landlord ↔ Tenant lean methodology
- Overall (STATE)
- 90 Strongly Landlord-Friendly
- State Alabama
- 90 Strongly Landlord-Friendly · R+15
- County
- — inherits STATE
- City
- — inherits STATE
ZIP-level market 35023
- Home prices YoY
- -0.1%
- Rents YoY
- 1.6%
- Active inventory
- 250
- Price-to-rent
- 9.7×
Monthly cashflow live
- Estimated rent
- $1,466 medium interval (Pro) →
- Mortgage (P&I)
- −$891
- Tax from tax record
- −$43 /mo · $512/yr
- Insurance
- −$71
- HOA
- −$0
- Vacancy / Maint / Mgmt
- −$308
- Net cashflow
- $154
Break-even live
UW: 25.0% down · 7.5% · 30yr · 1.5% tax · 5.0% vac · 8.0% maint · 8.0% mgmt
Financing live
Cash to close
- Down payment
- $42,475
- Closing costs
- $5,097
- Reserves months
- —
- Total cash needed
- —
Loan-product check · same deal, 3 products live
Conventional
25% down · 7.5% · 30yr
- Down + closing
- —
- Monthly P&I
- —
- Monthly cashflow
- —
- DSCR
- —
- Eligible?
- —
Personal DTI + credit; lowest rate.
DSCR
20% down · 8.5% · 30yr
- Down + closing
- —
- Monthly P&I
- —
- Monthly cashflow
- —
- DSCR
- —
- Eligible?
- —
No personal income docs; deal must DSCR.
Hard money
10% down · 12.0% · 12mo
- Down + closing
- —
- Monthly P&I
- —
- Monthly cashflow
- —
- DSCR
- —
- Eligible?
- —
Short-term bridge; refi at stabilization.
Rent comps 1 comps
| Address | Beds | Baths | Sqft | Rent | $/sqft | DOM | Units | Dist |
|---|---|---|---|---|---|---|---|---|
| 707 Bahia Ln Bessemer, AL | 3.0 | 1.0 | 1100 | $1,410 | $1.28 | 1d | 1 | 0.21mi |
Listing history 5 events
-
2026-06-18days on market $169,900 Coming Soon 5 DOM
-
2026-06-17days on market $169,900 Coming Soon 4 DOM
-
2026-06-16days on market $169,900 Coming Soon 3 DOM
-
2026-06-15remarks 693-char remark
-
2026-06-15$169,900 Coming Soon 2 DOM
ⓘ Source: listings_history table (triggers on properties + properties_extension) + one-shot
backfill from property_details.listing_events for pre-trigger history.
Tax reassessment forecast AL · Resets to sale price
- Current annual tax
- $512 · $43/mo
- Projected year-2 tax
- $697 · $58/mo
- Expected delta
- +$184/yr (+$15/mo · 36.0%)
ⓘ Screening estimate from a state-policy table — verify with the county assessor before closing.
Climate risk First Street
- Flood 1/10 Low FEMA zone X (unshaded) · 0% chance over 30 yrs
- Wildfire 5/10 Major
- Heat 6/10 Major 7 d/yr ≥108°F today · 20 d/yr by 30 yrs out
- Wind 6/10 Major 44% chance of damaging wind over 30 yrs
- Air quality 3/10 Moderate 2 unhealthy d/yr today · 4 by 30 yrs out
Nearby sold comps map
Loading sold comps map…
Walkable amenities ~0.75 mi
Loading nearby amenities…
Taxation est. · year 1
- Rental income
- $17,592
- − Mortgage interest
- −$9,517
- − Property taxes
- −$512
- − Insurance
- −$850
- − Repairs & maintenance
- −$1,407
- − Management
- −$1,407
- − Depreciation
- −$4,943
- Taxable loss
- −$1,044
- Est. tax savings @ 24.0%
- +$251
- After-tax cash flow
- $2,095/yr
For passive investors: Depreciation is non-cash, so a rental often shows a tax loss while cash-flowing — sheltering income. Rental losses are passive: they offset passive income freely, and up to $25,000/yr can offset ordinary (W-2) income if you actively participate and your MAGI is under $100k (phasing out to $0 by $150k); unused losses carry forward. On sale, claimed depreciation is recaptured at up to 25%, and gains may owe capital-gains tax (a 1031 exchange can defer both). Figures are a year-1 estimate at your 24.0% rate — not tax advice; consult a CPA.
Schools (NCES district)
- District
- Jefferson County
- NCES district ID
- 0101920
- Math proficiency
- 9% ▼ -24.00%
- Reading proficiency
- 32% ▼ -5.00%
- Median HH income
- $51,712
- Composite
- 18.4/100
- National rank
- #8937
- State rank
- #104 of 129 in AL
Livability — Rock Creek
- Score
- 57/100
- State rank
- #401
- US rank
- #22317
Category grades
Schools grade is shown separately in the Schools card above.
Census & demographics
- Census place
- Rock Creek, AL
- County
- Jefferson County · 527,445 people
- Metro
- Birmingham-Hoover, AL
- Population (ZIP)
- 25,533
- Household income
- $69,863
- Rent vs Own
- Severe rent burden
- 247.0
Population outlook (Jefferson County) Hauer SSP2
- Today (2025)
- 669,185 people
- By 2030
- 669,694 · +0.1%
- By 2040
- 661,388 · -1.2%
- By 2050
- 643,086 · -3.9%
- By 2075
- 577,267 · -13.7%
- By 2100
- 474,758 · -29.1%
Race, ethnicity, and origin ACS 2023
- Neighborhood character
- Diverse neighborhood (Simpson 0.56)
- Race & ethnicity
- White 58% Black 30% Hispanic / Latino 7% Two or more races 3%
- Hispanic origin (detail)
- Mexican 5%
- Common ancestry
- Slovak 1% Lithuanian 1% Serbian 1%
- Foreign-born
- 4% · Canada
- Languages at home
- 93% English-only · Spanish 7%
Political lean MEDSL · Jefferson
- 2024 margin
- D (+10.4) · D 54.6% · R 44.2% · Other 1.2%
- 2008→2024 swing
- +5.4pp toward D · 2008: 5.1pp · 2024: 10.4pp
- All cycles
- 2024: D+10.4 2020: D+13.2 2016: D+7.2 2012: D+6.0 2008: D+5.1
Not yet ingested
- Civics
- —
Market trends
- HPI YoY
- ▼ -0.60%
- Current HPI
- 389.38
- Rent YoY
- ▲ 1.60%
- Metro
- Birmingham-Hoover, AL
- State GDP YoY
- ▲ 2.94%
- F500 in state
- 4
Industry mix (Fortune 500 HQ in AL)
| Industry | F500 HQs | Revenue |
|---|---|---|
| Financial Services | 1 | $8B |
|
||
| Healthcare | 1 | $5B |
|
||
Price history
+330.1% since first listed6 events — show timeline
- 2026-06-14 Coming Soon $169,900 Greater Alabama MLS
- 2026-01-12 Sold (Public Records) $113,000 Public Records
- 2008-03-20 Sold (Public Records) $81,000 Public Records
- 2006-04-28 Sold (Public Records) $87,500 Public Records
- 1999-05-21 Sold (Public Records) $68,700 Public Records
- 1993-05-21 Sold (Public Records) $39,500 Public Records
Property tax history
-2.0%/yrLatest (2025): $512 · +2.0% YoY. Source: county tax records.
Cash-flow waterfall
monthlySold comps — $/sqft
last 12 mo · ≤1 miLoading sold comps…