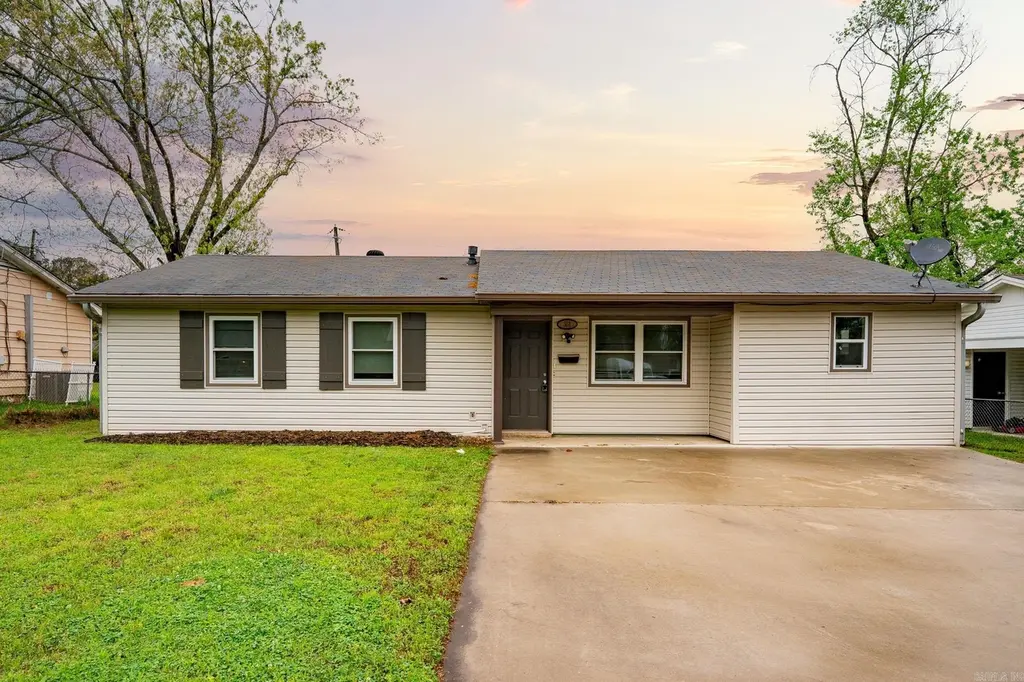
301 Janice St · Jacksonville, AR
Flood risk 1/10 · Minimal
- FEMA flood zone
- X (unshaded)
- Chance of flooding over 30 yrs
- 0.0%
- Est. flood insurance / yr
- $507 – $1,088
Fire risk 3/10 · Minor
- Est. fire insurance / yr
- $1,499 – $2,785
Heat risk 7/10 · Major
- Hot days now (above 110°F)
- 7 days/yr
- Hot days in 30 yrs
- 18 days/yr
Wind risk 3/10 · Minor
- Chance of severe wind over 30 yrs
- 8.0%
Air-quality risk 2/10 · Minimal
- Unhealthy air days now
- 1 days/yr
- Unhealthy air days in 30 yrs
- 2 days/yr
Risk factors via First Street. Map © Google.
Why this score? — see what drove the D+ grade
The composite is a weighted blend of 9 inputs, each scored 0–100. Each bar is that input's sub-score; the figure is the points it added to the 100-point composite (weight × sub-score).
- Cash flow +16.8/30.0
- ARV discount +11.1/15.0
- DSCR +5.2/10.0
- 1% rule +3.6/10.0
- Rent growth +3.3/5.0
- Livability +3.1/5.0
- Condition / age +2.5/5.0
- Schools +1.7/10.0
- Appreciation +0.0/10.0
$149,900
🖨 Deal sheet (PDF) 📄 Offer letter ✓ Due diligence
Listing remarks
Fantastic 3 bed 1.5 bath home. This home features lvt, stainless appliances, nice deck, neutral paint and much more. Super clean and move in ready!
Key facts
- 8,276 sq ft lot
- Built 1968
- Listed 6 days
Property features AI
Finance
- Financial info: Financing available: conventional loan or cash
Exterior
- Utilities: Public water; Public sewer
- Home design: Single-family residential zoning
- Construction: Architectural shingle roof; Slab foundation
- Exterior features: Level lot; Road surface: see remarks; Exterior: see remarks
Interior
- Kitchen: Electric range; Dishwasher
- Flooring: Carpet; Vinyl
- Bathrooms: One full bathroom; One half bathroom
- Heating & cooling: Electric central heat; Central cooling
- Interior features: Carpet and vinyl flooring
Neighborhood map
What this means for you Summary
Snapshot
- This is a 3-bed/1.5-bath single-family listed at $150k.
Deal economics
- At list price, monthly cash flow is $95 ($1k/yr) — positive.
- The deal already cash-flows at list — no discount required.
- To meet the 1% rule (rent ≥ 1% of price), the offer needs to be $129k (14.2% below list).
- Recommended offer: $129k (14.2% below list) — sets the bar for 1% rule.
- Cap rate 7.1% vs local median 5.0% in Jacksonville — top-decile yield for the area; either an underpriced asset or a hidden risk that comps aren't pricing in. Stress-test before assuming the spread holds.
Location & tenants
- Location reads 61/100 on livability (#231 in AR) — a middle-class / working-renter tenant base. Strengths: cost of living A+, housing A+, health & safety A+; Watch: crime F, amenities F, commute F.
- Jacksonville North Pulaski School District (suburban): math 18% / reading 20% proficiency, ranked #211 of 238 in AR (top 89%) — low school quality limits family demand, transient renter base, plan for 1-2y turnover; 66% free/reduced lunch — lower-income household profile, screen leases tightly.
- Zoned schools: Joe T. Robinson Middle School (math 40% / reading 49%, grade D, #61 of 201 statewide, top 32%, 544 students, 96% FRL); Joe T. Robinson High School (math 23% / reading 37%, grade F, #138 of 292 statewide, top 48%, 783 students, 24% FRL).
- Zoned-school proficiency averages 37% at this address vs 19% district-wide (+18 pts) — the actual schools serving this property are materially stronger than the Jacksonville North Pulaski School District average implies; a family-tenant draw the district grade alone would hide.
- Market conditions: Rents rising (+3.1%/yr); 163 active listings in the ZIP; 40 comparable units currently listed for rent nearby; rentals at typical pace (median 26d on market — plan ~3-4 weeks tenant-placement turnaround); 40% of comp listings sitting > 30 days — soft ceiling on asking rent; 1,006 units permitted in Pulaski County in 2024 (0 in 5+ unit buildings).
Forward outlook
- Local home prices are declining (-3.0%/yr); year-one equity from $1k of loan paydown is wiped out by about $4k of value loss. Plan a longer hold.
- Pulaski County population projected at +6% by 2050 — modest demand growth; plan on rents tracking national, not racing it.
Negotiation context
- Only 6 days on market — expect competitive offers; lowballing is unlikely to land.
- 2 sale attempts with the ask held roughly flat each time — persistent listings suggest the price (not the market) is what's stuck; bring a comps-based counter.
- Current owner paid $65k; list at $150k implies a 131% gain — meaningful room to come down on a strong offer.
Risks & watch-outs
- Climate carrying-cost: extreme-heat days projected 7→18/yr by 2055 (HVAC capex compounding) — expect insurance premiums to compound above CPI over the hold.
Questions for the listing agent
- Built in 1968 — when were the roof, HVAC, electrical panel, plumbing, and water heater last replaced?
- Is there a deadline driving the sale (1031 exchange, divorce, estate, relocation)? That informs how much negotiation room exists.
- Schools are F-rated, which usually means shorter tenancies and higher turnover. Who's the typical renter profile here, and what's been the actual vacancy rate?
- Crime grade is F in this area — have there been break-ins, vandalism, or insurance claims at this property in the last 3 years? What carrier currently insures it and at what premium?
- The area grade is low — what's the realistic commute time and amenity access for the typical tenant pool here? Any planned neighborhood developments (good or bad) we should know about?
- What's the average days-on-market for RENTAL listings here right now (not sales)? A rising rental-DOM trend means longer vacancies and softer asking-rent achievability than the comps imply.
- What's the recent tenant-quality profile in this submarket — average credit score on applications, eviction rate, late-payment / NSF rate, and stable-employment percentage? A property-management company in the area should have these aggregated.
- How much new for-sale + rental construction is in the pipeline within 1–3 miles? Heavy new supply typically softens prices + rents 12–24 months out; constrained supply supports both.
Investment metrics
- 1% rule
- 0.86% ✗
- Cap rate
- 7.06%
- Cash-on-cash
- 2.73%
- DSCR
- 1.12
- GRM
- 9.7
CMA / ARV
- ARV (on-the-fly)
- $162,814
- Comps found
- 12
Show comp detail 12 sales within ~0.75 mi
| Address | Dist | Beds/Ba | Sqft | Sold | Price | $/sf | Match |
|---|---|---|---|---|---|---|---|
| 301 Janice St | 0.00mi | 3/1.5 | 1,282 (0%) | 1mo | $153,650 | $120 | 99 |
| 202 Spruce St | 0.27mi | 3/2.0 | 1,251 (-2%) | 6mo | $228,000 | $182 | 76 |
| 108 Spruce St | 0.24mi | 3/2.0 | 1,159 (-10%) | 0mo | $172,934 | $149 | 70 |
| 813 Lehman Dr | 0.59mi | 3/1.5 | 1,344 (+5%) | 3mo | $170,750 | $127 | 62 |
| 203 Boston St | 0.57mi | 3/2.0 | 1,195 (-7%) | 2mo | $173,875 | $146 | 59 |
| 32 Ross Cir | 0.50mi | 3/1.5 | 1,400 (+9%) | 3mo | $95,000 | $68 | 59 |
| 305 Smart St | 0.57mi | 3/1.0 | 1,200 (-6%) | 6mo | $95,000 | $79 | 56 |
| 307 Boston St | 0.62mi | 3/2.0 | 1,174 (-8%) | 2mo | $184,000 | $157 | 53 |
| 105 Smart St | 0.70mi | 3/1.0 | 1,200 (-6%) | 2mo | $125,000 | $104 | 53 |
| 600 Sorrells Dr | 0.48mi | 3/1.5 | 1,109 (-14%) | 4mo | $125,000 | $113 | 52 |
| 1117 Sorrells Dr | 0.67mi | 3/1.5 | 1,397 (+9%) | 4mo | $85,000 | $61 | 50 |
| 1507 Pine View Dr | 0.53mi | 3/2.0 | 1,456 (+14%) | 0mo | $200,000 | $137 | 50 |
Match score weights: distance 35% · size 25% · config 20% · recency 20%. Top-matched comps best support the ARV.
Projected returns pro-forma
-3.0% appreciation · 3.07% rent growth · sell at horizon
- IRR
- -12.0%
- Equity multiple
- 0.57×
- Total profit
- $-18,170
- Equity at exit
- $22,351
- IRR
- -2.8%
- Equity multiple
- 0.81×
- Total profit
- $-7,828
- Equity at exit
- $12,961
Cash invested: $41,972 (down + closing). Projections, not guarantees.
Landlord ↔ Tenant lean methodology
- Overall (STATE)
- 92 Strongly Landlord-Friendly
- State Arkansas
- 92 Strongly Landlord-Friendly · R+14
- County
- — inherits STATE
- City
- — inherits STATE
ZIP-level market 72076
- Home prices YoY
- -30.3%
- Rents YoY
- 3.1%
- Active inventory
- 163
- Price-to-rent
- 9.7×
Monthly cashflow live
- Estimated rent
- $1,286 high interval (Pro) →
- Mortgage (P&I)
- −$786
- Tax from tax record
- −$72 /mo · $861/yr
- Insurance
- −$62
- HOA
- −$0
- Lot rent
- −$0
- Vacancy / Maint / Mgmt
- −$270
- Net cashflow
- $95
Break-even live
Sensitivity live
| Price | -10% $180 | -5% $138 | +0% $95 | +5% $53 | +10% $11 |
|---|---|---|---|---|---|
| Rent | -10% $-6 | -5% $45 | +0% $95 | +5% $146 | +10% $197 |
| Rate | -1.0pp $171 | -0.5pp $134 | base $95 | +0.5pp $57 | +1.0pp $17 |
UW: 25.0% down · 7.5% · 30yr · 1.5% tax · 5.0% vac · 8.0% maint · 8.0% mgmt
Financing live
Cash to close
- Down payment
- $37,475
- Closing costs
- $4,497
- Reserves months
- —
- Total cash needed
- —
Loan-product check · same deal, 3 products live
Conventional
25% down · 7.5% · 30yr
- Down + closing
- —
- Monthly P&I
- —
- Monthly cashflow
- —
- DSCR
- —
- Eligible?
- —
Personal DTI + credit; lowest rate.
DSCR
20% down · 8.5% · 30yr
- Down + closing
- —
- Monthly P&I
- —
- Monthly cashflow
- —
- DSCR
- —
- Eligible?
- —
No personal income docs; deal must DSCR.
Hard money
10% down · 12.0% · 12mo
- Down + closing
- —
- Monthly P&I
- —
- Monthly cashflow
- —
- DSCR
- —
- Eligible?
- —
Short-term bridge; refi at stabilization.
Rent comps 40 comps
| Address | Beds | Baths | Sqft | Rent | $/sqft | DOM | Units | Dist |
|---|---|---|---|---|---|---|---|---|
| 873 Jane Dr Jacksonville, AR | 2.0 | 1.0 | 971 | $1,050 | $1.08 | 46d | 1 | 0.12mi |
| 212 Wright Cv Jacksonville, AR | 3.0 | 1.5 | 1326 | $1,350 | $1.02 | 25d | 1 | 0.20mi |
| 107 Pike Ave Jacksonville, AR | 3.0 | 1.0 | 1092 | $995 | $0.91 | 46d | 1 | 0.23mi |
| 66 Wright Cir Jacksonville, AR | 3.0 | 2.0 | 1246 | $1,595 | $1.28 | 25d | 1 | 0.27mi |
| 58 Wright Cir Jacksonville, AR | 4.0 | 2.5 | 1468 | $1,450 | $0.99 | 16d | 1 | 0.27mi |
| 1115 Ray Rd Jacksonville, AR | 4.0 | 1.5 | 1495 | $1,495 | $1.00 | 16d | 1 | 0.29mi |
| 1501 Angie Ct Jacksonville, AR | 3.0 | 2.0 | 1296 | $1,595 | $1.23 | 23d | 1 | 0.30mi |
| 1112 Ray Rd Jacksonville, AR | 3.0 | 1.0 | 1166 | $895 | $0.77 | 46d | 1 | 0.32mi |
| 300 Redbud Ct Jacksonville, AR | 4.0 | 2.0 | 1559 | $1,995 | $1.28 | 25d | 1 | 0.33mi |
| 302 Redbud Ct Jacksonville, AR | 4.0 | 2.0 | 1559 | $1,995 | $1.28 | 25d | 1 | 0.33mi |
| 131 Galloway Cir Jacksonville, AR | 3.0 | 1.0 | 912 | $895 | $0.98 | 46d | 1 | 0.34mi |
| 144 Pike Ave Jacksonville, AR | 2.0 | 1.0 | 1050 | $800 | $0.76 | 46d | 1 | 0.35mi |
| 633 Smart St Jacksonville, AR | 3.0 | 1.5 | 936 | $995 | $1.06 | 25d | 1 | 0.36mi |
| 1409 Southern St Jacksonville, AR | 3.0 | 1.0 | 1050 | $1,050 | $1.00 | 46d | 1 | 0.38mi |
| 172 Roosevelt Rd Jacksonville, AR | 2.0 | 1.0 | 1000 | $800 | $0.80 | 23d | 1 | 0.39mi |
| 215 N Elm St Unit 215 Jacksonville, AR | 3.0 | 2.5 | 1600 | $1,475 | $0.92 | 25d | 1 | 0.46mi |
| 609 Sorrells Dr Jacksonville, AR | 3.0 | 1.0 | 1133 | $1,195 | $1.05 | 16d | 1 | 0.46mi |
| 89 Belair Loop Jacksonville, AR | 3.0 | 2.0 | 1093 | $1,450 | $1.33 | 23d | 1 | 0.48mi |
| 130 Joiner Ave Jacksonville, AR | 4.0 | 2.0 | 1223 | $1,550 | $1.27 | 23d | 1 | 0.48mi |
| 428 N Oak St Jacksonville, AR | 3.0 | 1.5 | 996 | $1,325 | $1.33 | 46d | 1 | 0.50mi |
| 197 Roosevelt Rd Jacksonville, AR | 3.0 | 1.0 | 1300 | $1,195 | $0.92 | 21d | 1 | 0.51mi |
| 1301 Liberty Dr Jacksonville, AR | 3.0 | 2.0 | 1014 | $1,295 | $1.28 | 16d | 1 | 0.54mi |
| 105 Victory Cir Jacksonville, AR | 4.0 | 2.0 | 1157 | $1,550 | $1.34 | 46d | 1 | 0.55mi |
| 1811 Neely St Unit 1811 Jacksonville, AR | 3.0 | 1.0 | 996 | $825 | $0.83 | 46d | 1 | 0.56mi |
| 708 Lehman Dr Jacksonville, AR | 3.0 | 1.5 | 1075 | $1,150 | $1.07 | 16d | 1 | 0.57mi |
| 1101 Lehman Dr Jacksonville, AR | 3.0 | 1.5 | 1344 | $1,200 | $0.89 | 16d | 1 | 0.67mi |
| 950 Military Rd Jacksonville, AR | 1.0–3.0 | 1.0–2.0 | 867 | $1,015 | $1.17 | 16d | 13 | 0.67mi |
| 124 Karen Cv Jacksonville, AR | 4.0 | 1.5 | 1000 | $1,050 | $1.05 | 46d | 1 | 0.74mi |
| 622 S Oak St Unit 620 Jacksonville, AR | 2.0 | 1.5 | 1015 | $725 | $0.71 | 25d | 1 | 0.86mi |
| 4 Georgeann Cir Jacksonville, AR | 3.0 | 1.5 | 1479 | $1,250 | $0.85 | 16d | 1 | 0.88mi |
| 714 S Spring St Unit 718 Jacksonville, AR | 2.0 | 2.0 | 1000 | $1,150 | $1.15 | 25d | 1 | 0.89mi |
| 103 Overland Trl Jacksonville, AR | 3.0 | 1.5 | 960 | $1,195 | $1.24 | 21d | 1 | 0.89mi |
| 516 Hill St Jacksonville, AR | 3.0 | 1.5 | 1380 | $1,175 | $0.85 | 46d | 1 | 1.19mi |
| 1024 Colonial Dr Jacksonville, AR | 3.0 | 2.0 | 1640 | $1,400 | $0.85 | 25d | 1 | 1.19mi |
| 7 Davis Ct Jacksonville, AR | 3.0 | 1.5 | 1080 | $925 | $0.86 | 46d | 1 | 1.20mi |
| 712 W Martin St Jacksonville, AR | 2.0 | 1.0 | 936 | $995 | $1.06 | 46d | 1 | 1.25mi |
| 1516 S Bailey St Jacksonville, AR | 3.0 | 2.0 | 1400 | $1,395 | $1.00 | 46d | 1 | 1.28mi |
| 620 Neal St Jacksonville, AR | 3.0 | 1.0 | 900 | $895 | $0.99 | 46d | 1 | 1.29mi |
| 1515 Stamps St Unit 1 Jacksonville, AR | 3.0 | 2.0 | 1404 | $1,395 | $0.99 | 46d | 1 | 1.32mi |
| 815 Ellis St Unit 817 Jacksonville, AR | 3.0 | 2.0 | 1550 | $1,395 | $0.90 | 25d | 1 | 1.39mi |
Listing history 5 events
-
2026-05-19status Under Contract
-
2026-05-19status Back on Market
-
2026-04-13status Under Contract
-
2026-04-07$149,900 New Listing
-
2007-02-21soldstatus $65,000
ⓘ Source: listings_history table (triggers on properties + properties_extension) + one-shot
backfill from property_details.listing_events for pre-trigger history.
Tax reassessment forecast AR · Resets to sale price
- Current annual tax
- $861 · $72/mo
- Projected year-2 tax
- $959 · $80/mo
- Expected delta
- +$99/yr (+$8/mo · 11.4%)
ⓘ Screening estimate from a state-policy table — verify with the county assessor before closing.
Climate risk First Street
- Flood 1/10 Low FEMA zone X (unshaded) · 0% chance over 30 yrs
- Wildfire 3/10 Moderate
- Heat 7/10 Severe 7 d/yr ≥110°F today · 18 d/yr by 30 yrs out
- Wind 3/10 Moderate 8% chance of damaging wind over 30 yrs
- Air quality 2/10 Low 1 unhealthy d/yr today · 2 by 30 yrs out
Nearby sold comps map
Loading sold comps map…
Walkable amenities ~0.75 mi
Loading nearby amenities…
Taxation est. · year 1
- Rental income
- $15,429
- − Mortgage interest
- −$8,397
- − Property taxes
- −$861
- − Insurance
- −$750
- − Repairs & maintenance
- −$1,234
- − Management
- −$1,234
- − Depreciation
- −$4,361
- Taxable loss
- −$1,407
- Est. tax savings @ 24.0%
- +$338
- After-tax cash flow
- $1,484/yr
For passive investors: Depreciation is non-cash, so a rental often shows a tax loss while cash-flowing — sheltering income. Rental losses are passive: they offset passive income freely, and up to $25,000/yr can offset ordinary (W-2) income if you actively participate and your MAGI is under $100k (phasing out to $0 by $150k); unused losses carry forward. On sale, claimed depreciation is recaptured at up to 25%, and gains may owe capital-gains tax (a 1031 exchange can defer both). Figures are a year-1 estimate at your 24.0% rate — not tax advice; consult a CPA.
Schools (NCES district)
- District
- Jacksonville North Pulaski School District
- NCES district ID
- 0500419
- Math proficiency
- 18% ▼ -7.00%
- Reading proficiency
- 20% ▼ -5.00%
- Median HH income
- $50,869
- Composite
- 17.16/100
- National rank
- #9110
- State rank
- #211 of 238 in AR
Livability — Jacksonville
- Score
- 61/100
- State rank
- #231
- US rank
- #17378
Category grades
Schools grade is shown separately in the Schools card above.
Census & demographics
- Census place
- Jacksonville, AR
- County
- Pulaski County · 372,764 people
- City population
- 38,437
- Metro
- Little Rock-North Little Rock-Conway, AR
- Population (ZIP)
- 38,437
- Household income
- $54,379
- Rent vs Own
- Severe rent burden
- 1733.0
Population outlook (Pulaski County) Hauer SSP2
- Today (2025)
- 415,378 people
- By 2030
- 423,720 · +2.0%
- By 2040
- 435,182 · +4.8%
- By 2050
- 440,904 · +6.1%
- By 2075
- 445,521 · +7.3%
- By 2100
- 419,173 · +0.9%
Race, ethnicity, and origin ACS 2023
- Neighborhood character
- Diverse neighborhood (Simpson 0.63)
- Race & ethnicity
- White 47% Black 38% Hispanic / Latino 8% Two or more races 8% Asian 1%
- Hispanic origin (detail)
- Mexican 6%
- Common ancestry
- Slovak 2% Italian 2% Serbian 1%
- Foreign-born
- 4% · Canada
- Languages at home
- 94% English-only · Spanish 4% Tagalog/Filipino 1%
Political lean MEDSL · Pulaski
- 2024 margin
- Strong D (+22.1) · D 59.8% · R 37.7% · Other 2.5%
- 2008→2024 swing
- +10.6pp toward D · 2008: 11.6pp · 2024: 22.1pp
- All cycles
- 2024: D+22.1 2020: D+22.5 2016: D+17.9 2012: D+11.4 2008: D+11.6
Not yet ingested
- Civics
- —
Market trends
- HPI YoY
- ▼ -87.51%
- Current HPI
- 201.6405
- Rent YoY
- ▲ 3.07%
- Metro
- Little Rock-North Little Rock-Conway, AR
- State GDP YoY
- ▲ 3.80%
- F500 in state
- 10
Industry mix (Fortune 500 HQ in AR)
| Industry | F500 HQs | Revenue |
|---|---|---|
| Retail | 1 | $681B |
|
||
| Food / Agriculture | 1 | $53B |
|
||
| Retail / Energy | 1 | $22B |
|
||
| Transportation / Logistics | 1 | $12B |
|
||
| Energy | 1 | $4B |
|
||
Price history
+130.6% since first listed5 events — show timeline
- 2026-05-19 Pending — CARMLS
- 2026-05-19 Relisted — CARMLS
- 2026-04-13 Pending — CARMLS
- 2026-04-07 Listed $149,900 CARMLS
- 2007-02-21 Sold (Public Records) $65,000 Public Records
Property tax history
+3.6%/yrLatest (2025): $861 · +8.0% YoY. Source: county tax records.
Cash-flow waterfall
monthlySold comps — $/sqft
last 12 mo · ≤1 miLoading sold comps…