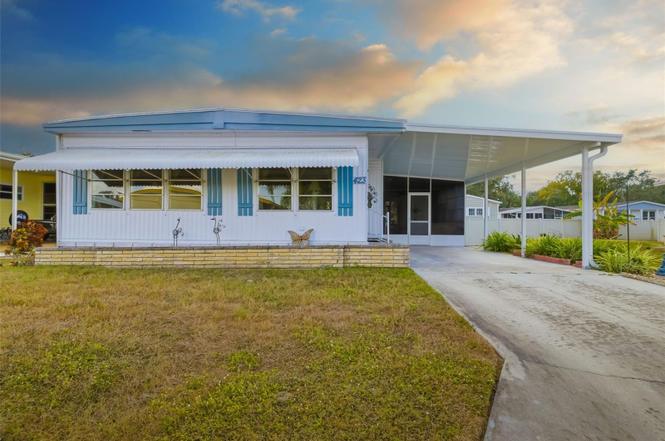
5619 Bayshore Rd #423 · Memphis, FL
Flood risk 5/10 · Moderate
- FEMA flood zone
- X (unshaded)
- Chance of flooding over 30 yrs
- 0.39%
- Est. flood insurance / yr
- $507 – $1,088
Fire risk 1/10 · Minimal
- Est. fire insurance / yr
- $947 – $1,759
Heat risk 10/10 · Severe
- Hot days now (above 107°F)
- 7 days/yr
- Hot days in 30 yrs
- 31 days/yr
Wind risk 10/10 · Severe
- Chance of severe wind over 30 yrs
- 99.0%
Air-quality risk 3/10 · Minor
- Unhealthy air days now
- 2 days/yr
- Unhealthy air days in 30 yrs
- 3 days/yr
Risk factors via First Street. Map © Google.
Why this score? — see what drove the C grade
The composite is a weighted blend of 9 inputs, each scored 0–100. Each bar is that input's sub-score; the figure is the points it added to the 100-point composite (weight × sub-score).
- Cash flow +26.5/30.0
- DSCR +9.1/10.0
- 1% rule +7.9/10.0
- Schools +4.4/10.0
- Livability +3.2/5.0
- Condition / age +2.5/5.0
- Rent growth +1.8/5.0
- ARV discount +0.0/15.0
- Appreciation +0.0/10.0
$159,000
🖨 Deal sheet 📄 Offer letter ✓ Due diligence
Listing remarks
Making the decision to move to Florida often means leaving familiar places—and loved ones—behind. This land-owned home in the welcoming 55+ community of Terra Ceia Manor was made for that moment. From the day you arrive, you’ll feel the comfort of a neighborhood where residents look out for one another, friendships form easily, and newcomers are truly welcomed. With a full social calendar that includes luncheons, shuffleboard, and a heated community pool, it doesn’t take long before this feels like home. This fully furnished, move-in ready home allows you to focus on settling in, not starting over. Check Virtual Tour One for the matterport The spacious family room, a
Key facts
- Screened patio
- Large storage area
- Land owned home
Tags
Property features AI
Finance
- Other: Furnished; Association contact listed
- Financial info: Total monthly fees $188 (total annual fees $2,256); Lease restrictions apply
- HOA & community: HOA required with monthly fee of $188; Association amenities include cable TV, clubhouse, pool, shuffleboard court; Association fee covers pool, escrow reserves, fidelity bond, insurance, grounds maintenance, management, recreational facilities, sewer, trash and water; Buyer approval required for association; Senior community; Pets not allowed; Community features: clubhouse, fitness center, sidewalks, street lights, community mailbox, deed restrictions, association-owned recreation, golf carts OK
Exterior
- Parking: Driveway; Parking pad; Carport (1 space)
- Utilities: Public water; Public sewer; Broadband/high-speed internet available; Cable available; Electricity connected; Sewer connected; Water connected
- Home design: Manufactured double-wide home; One level; Faces west
- Construction: Vinyl siding; Other roof; Crawlspace foundation; Built as manufactured home
- Exterior features: Covered, screened side porch; Hurricane shutters; Sidewalk; Sliding doors; Exterior storage; Paved asphalt road; Private maintained road; Property located in county, private and unincorporated
Interior
- Kitchen: Dishwasher; Disposal; Microwave; Range; Refrigerator; Eat-in kitchen
- Bedrooms: 2 bedrooms
- Flooring: Carpet; Ceramic tile
- Bathrooms: 2 full bathrooms
- Heating & cooling: Central heating; Electric heating; Heat pump; Central air conditioning; Humidity control
- Interior features: Ceiling fans; Eat-in kitchen; Kitchen open to family room; Thermostat; Walk-in closets; Window treatments; Blinds
- Laundry & utility: Washer; Dryer; Electric water heater; Laundry: other
Neighborhood map
What this means for you Summary
Snapshot
- This is a 2-bed/2.0-bath manufactured listed at $159k.
Deal economics
- At list price, monthly cash flow is $422 ($5k/yr) — positive.
- The deal already cash-flows at list — no discount required.
- Meets the 1% rule at list price ($2k rent vs $159k).
- Recommended offer: $140k (12.0% below list) — sets the bar for market timing.
- Cap rate 9.5% vs local median 4.5% in Memphis — top-decile yield for the area; either an underpriced asset or a hidden risk that comps aren't pricing in. Stress-test before assuming the spread holds.
Location & tenants
- Location reads 63/100 on livability (#745 in FL) — a middle-class / working-renter tenant base. Strengths: cost of living A+, housing A+; Watch: employment D+, schools F, amenities F.
- Manatee (suburban): math 54% / reading 50% proficiency, ranked #26 of 73 in FL (top 36%) — acceptable for families but not a draw, mixed tenant base, ~2y average lease.
- Market conditions: Rents soft (-3.0%/yr); 1160 active listings in the ZIP; 8 comparable units currently listed for rent nearby; rentals at typical pace (median 24d on market — plan ~3-4 weeks tenant-placement turnaround); solid renter incomes; 7,472 units permitted in Manatee County in 2024 (1,782 in 5+ unit buildings).
- This rent runs 32% of the median local income ($78k/yr) — at the standard rent-burdened threshold; future hikes will face affordability resistance.
Forward outlook
- Local home prices are declining (-3.0%/yr); year-one equity from $1k of loan paydown is wiped out by about $5k of value loss. Plan a longer hold.
- Manatee County population projected at +43% by 2050 — long-run rental-demand tailwind backs the buy-and-hold thesis.
Negotiation context
- It's been on market 159 days — a 12% lower offer ($140k) is reasonable based on typical stale-listing flexibility.
- 2 sale attempts with the ask held roughly flat each time — persistent listings suggest the price (not the market) is what's stuck; bring a comps-based counter.
- Current owner paid $72k; list at $159k implies a 121% gain — meaningful room to come down on a strong offer.
Risks & watch-outs
- Climate carrying-cost: moderate flood risk; severe wind risk, 99% chance of damaging wind over 30y; extreme-heat days projected 7→31/yr by 2055 (HVAC capex compounding) — expect insurance premiums to compound above CPI over the hold.
Questions for the listing agent
- It's been on market 159 days. Have you received any prior offers? Is the seller open to a 12% concession, seller financing, or rate buy-down credit?
- What does the HOA fee cover, when was the last increase, and are there any pending special assessments or reserve-fund shortfalls?
- Why hasn't it sold? Are there any deal-killer items the seller is aware of (foundation, flood, title, zoning, code violations)?
- Is there a deadline driving the sale (1031 exchange, divorce, estate, relocation)? That informs how much negotiation room exists.
- Schools are F-rated, which usually means shorter tenancies and higher turnover. Who's the typical renter profile here, and what's been the actual vacancy rate?
- What's the average days-on-market for RENTAL listings here right now (not sales)? A rising rental-DOM trend means longer vacancies and softer asking-rent achievability than the comps imply.
- What's the recent tenant-quality profile in this submarket — average credit score on applications, eviction rate, late-payment / NSF rate, and stable-employment percentage? A property-management company in the area should have these aggregated.
- How much new for-sale + rental construction is in the pipeline within 1–3 miles? Heavy new supply typically softens prices + rents 12–24 months out; constrained supply supports both.
Investment metrics
- 1% rule
- 1.29% ✓
- Cap rate
- 9.47%
- Cash-on-cash
- 11.36%
- DSCR
- 1.51
- GRM
- 6.5
CMA / ARV
- ARV (on-the-fly)
- $122,668
- Comps found
- 5
Show comp detail 5 sales within ~0.75 mi
| Address | Dist | Beds/Ba | Sqft | Sold | Price | $/sf | Match |
|---|---|---|---|---|---|---|---|
| 5619 Bayshore Rd #421 | 0.01mi | 2/2.0 | 1,344 (-0%) | 5mo | $150,000 | $112 | 95 |
| 5619 Bayshore Rd #466 | 0.09mi | 2/2.0 | 1,364 (+1%) | 1mo | $123,500 | $91 | 94 |
| 5619 Bayshore Rd #469 | 0.11mi | 2/2.0 | 1,344 (-0%) | 5mo | $112,000 | $83 | 90 |
| 5619 Bayshore Rd #164 | 0.12mi | 2/2.0 | 1,224 (-9%) | 2mo | $120,000 | $98 | 77 |
| 420 49th St E #48 | 0.49mi | 3/2.0 (+1) | 1,296 (-4%) | 2mo | $110,000 | $85 | 64 |
Match score weights: distance 35% · size 25% · config 20% · recency 20%. Top-matched comps best support the ARV.
Projected returns pro-forma
-3.0% appreciation · 0.0% rent growth · sell at horizon
- IRR
- -3.0%
- Equity multiple
- 0.89×
- Total profit
- $-4,826
- Equity at exit
- $23,707
- IRR
- 2.8%
- Equity multiple
- 1.17×
- Total profit
- $7,555
- Equity at exit
- $13,747
Cash invested: $44,520 (down + closing). Projections, not guarantees.
Landlord ↔ Tenant lean methodology
- Overall (STATE)
- 87 Strongly Landlord-Friendly
- State Florida
- 87 Strongly Landlord-Friendly · R+3
- County
- — inherits STATE
- City
- — inherits STATE
ZIP-level market 34221
- Rents YoY
- -3.0%
- Active inventory
- 1160
- Price-to-rent
- 6.5×
Monthly cashflow live
- Estimated rent
- $2,047 high interval (Pro) →
- Mortgage (P&I)
- −$834
- Tax from tax record
- −$107 /mo · $1,286/yr
- Insurance
- −$66
- HOA
- −$188
- Vacancy / Maint / Mgmt
- −$430
- Net cashflow
- $422
Break-even live
UW: 25.0% down · 7.5% · 30yr · 1.5% tax · 5.0% vac · 8.0% maint · 8.0% mgmt
Financing live
Cash to close
- Down payment
- $39,750
- Closing costs
- $4,770
- Reserves months
- —
- Total cash needed
- —
Loan-product check · same deal, 3 products live
Conventional
25% down · 7.5% · 30yr
- Down + closing
- —
- Monthly P&I
- —
- Monthly cashflow
- —
- DSCR
- —
- Eligible?
- —
Personal DTI + credit; lowest rate.
DSCR
20% down · 8.5% · 30yr
- Down + closing
- —
- Monthly P&I
- —
- Monthly cashflow
- —
- DSCR
- —
- Eligible?
- —
No personal income docs; deal must DSCR.
Hard money
10% down · 12.0% · 12mo
- Down + closing
- —
- Monthly P&I
- —
- Monthly cashflow
- —
- DSCR
- —
- Eligible?
- —
Short-term bridge; refi at stabilization.
Rent comps 8 comps
| Address | Beds | Baths | Sqft | Rent | $/sqft | DOM | Units | Dist |
|---|---|---|---|---|---|---|---|---|
| 110 49th Ct E Palmetto, FL | 3.0 | 2.0 | 1655 | $1,850 | $1.12 | 3d | 1 | 0.47mi |
| 105 2nd Ave E Palmetto, FL | 3.0 | 2.0 | 1569 | $1,895 | $1.21 | 11d | 1 | 0.48mi |
| 105 2nd Ave E Palmetto, FL | 3.0 | 2.0 | 1569 | $1,895 | $1.21 | 23d | 1 | 0.48mi |
| 4721 1st Ave E #4721 Palmetto, FL | 3.0 | 2.0 | 1460 | $2,000 | $1.37 | 23d | 1 | 0.66mi |
| 4633 1st Ave E Palmetto, FL | 3.0 | 2.5 | 1586 | $1,875 | $1.18 | 3d | 1 | 0.69mi |
| 515 45th St E Palmetto, FL | 2.0 | 2.0 | 900 | $2,100 | $2.33 | 23d | 1 | 0.89mi |
| 709 45th St E Palmetto, FL | 2.0 | 2.0 | 1000 | $1,550 | $1.55 | 3d | 1 | 0.97mi |
| 4207 5th Ave W Palmetto, FL | 3.0 | 2.0 | 1744 | $3,000 | $1.72 | 23d | 1 | 1.07mi |
HOA detail
- Monthly dues
- $188 · $2,256/yr
- Likely covers
- pool
Listing history 18 events
-
2026-06-18days on market $159,000 Active 159 DOM
-
2026-06-17days on market $159,000 Active 158 DOM
-
2026-06-16days on market $159,000 Active 157 DOM
-
2026-06-15days on market $159,000 Active 156 DOM
-
2026-06-13days on market $159,000 Active 154 DOM
-
2026-06-13days on market $159,000 Active 153 DOM
-
2026-06-10days on market $159,000 Active 151 DOM
-
2026-06-09days on market $159,000 Active 150 DOM
-
2026-06-08days on market $159,000 Active 149 DOM
-
2026-06-08days on market $159,000 Active 148 DOM
-
2026-06-03days on market $159,000 Active 144 DOM
-
2026-06-02days on market $159,000 Active 143 DOM
-
2026-06-01days on market $159,000 Active 142 DOM
-
2026-05-31days on market $159,000 Active 141 DOM
-
2026-01-10$159,000 Active
-
2025-08-18historical
-
2025-03-24$169,000 Active
-
2018-12-17soldstatus $72,000
ⓘ Source: listings_history table (triggers on properties + properties_extension) + one-shot
backfill from property_details.listing_events for pre-trigger history.
Tax reassessment forecast FL · Resets to sale price
- Current annual tax
- $1,286 · $107/mo
- Projected year-2 tax
- $1,320 · $110/mo
- Expected delta
- +$33/yr (+$3/mo · 2.6%)
ⓘ Screening estimate from a state-policy table — verify with the county assessor before closing.
Climate risk First Street
- Flood 5/10 Major FEMA zone X (unshaded) · 39% chance over 30 yrs
- Wildfire 1/10 Low
- Heat 10/10 Extreme 7 d/yr ≥107°F today · 31 d/yr by 30 yrs out
- Wind 10/10 Extreme 99% chance of damaging wind over 30 yrs
- Air quality 3/10 Moderate 2 unhealthy d/yr today · 3 by 30 yrs out
Nearby sold comps map
Loading sold comps map…
Walkable amenities ~0.75 mi
Loading nearby amenities…
Taxation est. · year 1
- Rental income
- $24,558
- − Mortgage interest
- −$8,906
- − Property taxes
- −$1,286
- − Insurance
- −$795
- − Repairs & maintenance
- −$1,965
- − Management
- −$1,965
- − HOA
- −$2,256
- − Depreciation
- −$4,625
- Taxable income
- $2,760
- Est. tax owed @ 24.0%
- −$662
- After-tax cash flow
- $4,396/yr
For passive investors: Depreciation is non-cash, so a rental often shows a tax loss while cash-flowing — sheltering income. Rental losses are passive: they offset passive income freely, and up to $25,000/yr can offset ordinary (W-2) income if you actively participate and your MAGI is under $100k (phasing out to $0 by $150k); unused losses carry forward. On sale, claimed depreciation is recaptured at up to 25%, and gains may owe capital-gains tax (a 1031 exchange can defer both). Figures are a year-1 estimate at your 24.0% rate — not tax advice; consult a CPA.
Schools (NCES district)
- District
- Manatee
- NCES district ID
- 1201230
- Math proficiency
- 54% ▼ -6.00%
- Reading proficiency
- 50% ▼ -2.00%
- Median HH income
- $49,607
- Composite
- 44.43/100
- National rank
- #2806
- State rank
- #26 of 73 in FL
Livability — Memphis
- Score
- 63/100
- State rank
- #745
- US rank
- #16072
Category grades
Schools grade is shown separately in the Schools card above.
Census & demographics
- County
- Manatee County · 416,364 people
- Metro
- North Port-Sarasota-Bradenton, FL
- Population (ZIP)
- 56,208
- Household income
- $77,712
- Rent vs Own
- Severe rent burden
- 1193.0
Population outlook (Manatee County) Hauer SSP2
- Today (2025)
- 447,342 people
- By 2030
- 488,911 · +9.3%
- By 2040
- 567,934 · +27.0%
- By 2050
- 637,995 · +42.6%
- By 2075
- 781,970 · +74.8%
- By 2100
- 848,272 · +89.6%
Race, ethnicity, and origin ACS 2023
- Neighborhood character
- Diverse neighborhood (Simpson 0.58)
- Race & ethnicity
- White 59% Hispanic / Latino 22% Black 14% Two or more races 11%
- Hispanic origin (detail)
- Mexican 14% Puerto Rican 3%
- Common ancestry
- Romanian 2% Lithuanian 2% Italian 2%
- Foreign-born
- 10% · Canada, Dominican Republic, Jamaica
- Languages at home
- 81% English-only · Spanish 16% Other Indo-European 1%
Political lean MEDSL · Manatee
- 2024 margin
- Strong R (+23.5) · D 37.9% · R 61.4%
- 2008→2024 swing
- -16.5pp toward R · 2008: -7.0pp · 2024: -23.5pp
- All cycles
- 2024: R+23.5 2020: R+16.1 2016: R+17.1 2012: R+12.5 2008: R+7.0
Not yet ingested
- Civics
- —
Market trends
- HPI YoY
- ▼ -383.53%
- Current HPI
- 302.1458
- Rent YoY
- ▼ -2.98%
- Metro
- North Port-Sarasota-Bradenton, FL
- State GDP YoY
- ▲ 3.28%
- F500 in state
- 36
Industry mix (Fortune 500 HQ in FL)
| Industry | F500 HQs | Revenue |
|---|---|---|
| Industrial Technology | 2 | $29B |
|
||
| Insurance | 2 | $17B |
|
||
| Retail | 1 | $60B |
|
||
| Technology Distribution | 1 | $58B |
|
||
| Homebuilding | 1 | $35B |
|
||
| Technology Manufacturing | 1 | $35B |
|
||
Price history
+120.8% since first listed4 events — show timeline
- 2026-01-10 Listed $159,000 Stellar MLS as Distributed by MLS Grid
- 2025-08-18 Listing Removed — Stellar MLS as Distributed by MLS Grid
- 2025-03-24 Listed $169,000 Stellar MLS as Distributed by MLS Grid
- 2018-12-17 Sold (Public Records) $72,000 Public Records
Property tax history
+3.7%/yrLatest (2025): $1,286 · -6.4% YoY. Source: county tax records.
Cash-flow waterfall
monthlySold comps — $/sqft
last 12 mo · ≤1 miLoading sold comps…