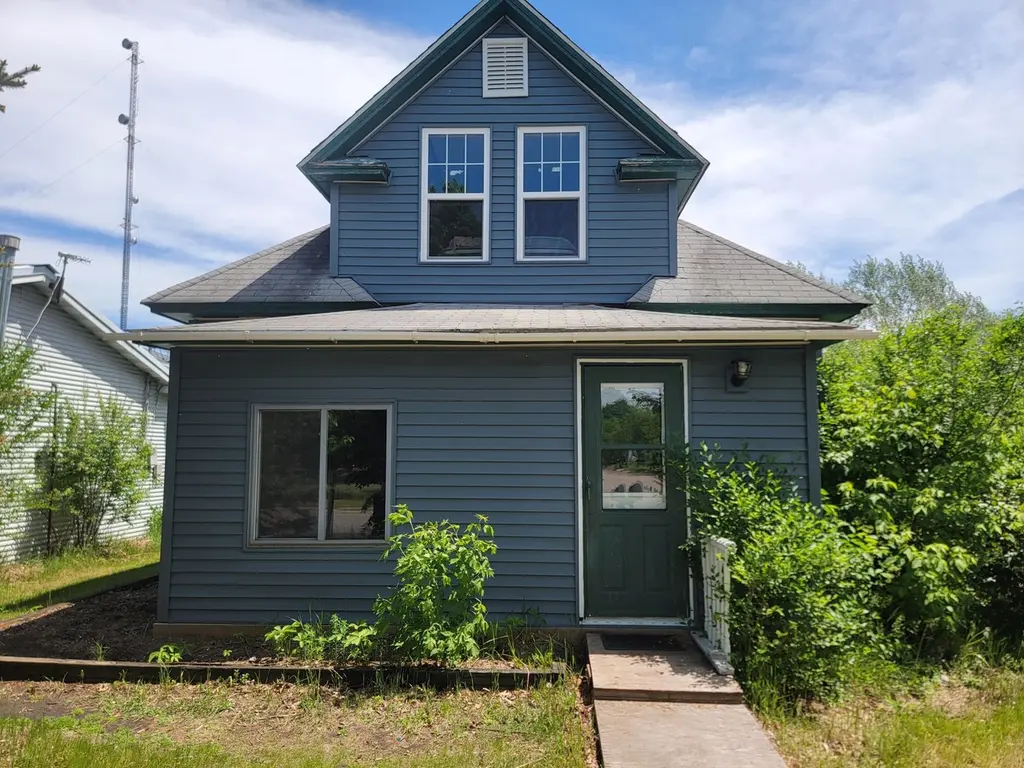
320 8th St SE Unit B · Staples, MN
Flood risk 1/10 · Minimal
- FEMA flood zone
- X (unshaded)
- Chance of flooding over 30 yrs
- 0.0%
- Est. flood insurance / yr
- $507 – $1,088
Fire risk 4/10 · Minor
- Est. fire insurance / yr
- $888 – $1,650
Heat risk 2/10 · Minimal
- Hot days now (above 97°F)
- 7 days/yr
- Hot days in 30 yrs
- 13 days/yr
Wind risk 2/10 · Minimal
- Chance of severe wind over 30 yrs
- —
Air-quality risk 2/10 · Minimal
- Unhealthy air days now
- 1 days/yr
- Unhealthy air days in 30 yrs
- 1 days/yr
Risk factors via First Street. Map © Google.
Why this score? — see what drove the B- grade
The composite is a weighted blend of 9 inputs, each scored 0–100. Each bar is that input's sub-score; the figure is the points it added to the 100-point composite (weight × sub-score).
- Cash flow +30.0/30.0
- 1% rule +10.0/10.0
- DSCR +10.0/10.0
- ARV discount +7.5/15.0
- Schools +3.2/10.0
- Livability +3.2/5.0
- Rent growth +2.5/5.0
- Condition / age +2.5/5.0
- Appreciation +0.0/10.0
$86,000
🖨 Deal sheet 📄 Offer letter ✓ Due diligence
Listing remarks
Affordable Living at its finest! This two bed one bath house sits right in the heart of staples. This home has had some updates to its windows, floor, siding, and more! This home has a very spacious upstairs that you can enjoy. You won't want to wait on this one!
Key facts
- Spacious upstairs
- Updates to siding
- Updates to windows
Tags
Property features AI
Exterior
- Parking: On-street parking only
- Utilities: City water connected; City sewer connected; Natural gas
- Home design: Residential property; One and one-half story; Approximately 1,340 above-grade finished living area
- Construction: Roof older than 8 years; Foundation: Other; Foundation area reported as 100
- Exterior features: Vinyl exterior; Lot approximately 0.2 acres (141 x 63)
Interior
- Kitchen: Microwave; Refrigerator
- Bedrooms: Two bedrooms (one on the main level, one on the upper level)
- Bathrooms: One full bathroom on the main level
- Heating & cooling: Forced air heating; Window air conditioning unit(s)
- Interior features: Microwave; Refrigerator; Crawl space basement
- Laundry & utility: Main-level laundry room
Neighborhood map
What this means for you Summary
Snapshot
- This is a 2-bed/1.0-bath single-family listed at $86k.
Deal economics
- At list price, monthly cash flow is $468 ($6k/yr) — positive.
- The deal already cash-flows at list — no discount required.
- Meets the 1% rule at list price ($1k rent vs $86k).
- Recommended offer: $85k (1.5% below list) — sets the bar for market timing.
Location & tenants
- Location reads 65/100 on livability (#539 in MN) — a middle-class / working-renter tenant base. Strengths: cost of living A+, housing A+, crime B+; Watch: health & safety C-, schools D, amenities F.
- Staples-Motley School District (rural): math 37% / reading 39% proficiency, ranked #238 of 301 in MN (top 79%) — families likely to look elsewhere, expect single-tenant / working-renter base with shorter leases.
- Market conditions: 50 active listings in the ZIP; 167 units permitted in Todd County in 2024 (78 in 5+ unit buildings).
Forward outlook
- Local home prices are declining (-3.0%/yr); year-one equity from $595 of loan paydown is wiped out by about $3k of value loss. Plan a longer hold.
- Todd County population projected at -28% by 2050 — secular population decline; favor cash flow + early exit over multi-decade hold.
- At projected returns (-3.0% appreciation + 3.0% rent growth), your $24k cash investment doubles in ~6 years — after that, you're playing with house money.
Negotiation context
- It's been on market 16 days — a 2% lower offer ($85k) is reasonable based on typical stale-listing flexibility.
Risks & watch-outs
- Watch-outs: built in 1900 — expect roof / HVAC / electrical / plumbing capex.
Questions for the listing agent
- Built in 1900 — when were the roof, HVAC, electrical panel, plumbing, and water heater last replaced?
- Is there a deadline driving the sale (1031 exchange, divorce, estate, relocation)? That informs how much negotiation room exists.
- Schools are D-rated, which usually means shorter tenancies and higher turnover. Who's the typical renter profile here, and what's been the actual vacancy rate?
- What's the average days-on-market for RENTAL listings here right now (not sales)? A rising rental-DOM trend means longer vacancies and softer asking-rent achievability than the comps imply.
- What's the recent tenant-quality profile in this submarket — average credit score on applications, eviction rate, late-payment / NSF rate, and stable-employment percentage? A property-management company in the area should have these aggregated.
- How much new for-sale + rental construction is in the pipeline within 1–3 miles? Heavy new supply typically softens prices + rents 12–24 months out; constrained supply supports both.
Investment metrics
- 1% rule
- 1.56% ✓
- Cap rate
- 12.82%
- Cash-on-cash
- 23.30%
- DSCR
- 2.04
- GRM
- 5.3
CMA / ARV
No comps found within radius.
Projected returns pro-forma
-3.0% appreciation · 3.0% rent growth · sell at horizon
- IRR
- 16.4%
- Equity multiple
- 1.66×
- Total profit
- $15,867
- Equity at exit
- $12,823
- IRR
- 24.9%
- Equity multiple
- 3.17×
- Total profit
- $52,248
- Equity at exit
- $7,436
Cash invested: $24,080 (down + closing). Projections, not guarantees.
Landlord ↔ Tenant lean methodology
- Overall (STATE)
- 46 Balanced
- State Minnesota
- 46 Balanced · D+2
- County
- — inherits STATE
- City
- — inherits STATE
ZIP-level market 56479
- Home prices YoY
- -6.1%
- Active inventory
- 50
- Price-to-rent
- 5.3×
Monthly cashflow live
- Estimated rent
- $1,344 medium interval (Pro) →
- Mortgage (P&I)
- −$451
- Tax est. 1.5%
- −$108 /mo · $1,290/yr
- Insurance
- −$36
- HOA
- −$0
- Vacancy / Maint / Mgmt
- −$282
- Net cashflow
- $468
Break-even live
UW: 25.0% down · 7.5% · 30yr · 1.5% tax · 5.0% vac · 8.0% maint · 8.0% mgmt
Financing live
Cash to close
- Down payment
- $21,500
- Closing costs
- $2,580
- Reserves months
- —
- Total cash needed
- —
Loan-product check · same deal, 3 products live
Conventional
25% down · 7.5% · 30yr
- Down + closing
- —
- Monthly P&I
- —
- Monthly cashflow
- —
- DSCR
- —
- Eligible?
- —
Personal DTI + credit; lowest rate.
DSCR
20% down · 8.5% · 30yr
- Down + closing
- —
- Monthly P&I
- —
- Monthly cashflow
- —
- DSCR
- —
- Eligible?
- —
No personal income docs; deal must DSCR.
Hard money
10% down · 12.0% · 12mo
- Down + closing
- —
- Monthly P&I
- —
- Monthly cashflow
- —
- DSCR
- —
- Eligible?
- —
Short-term bridge; refi at stabilization.
Listing history 12 events
-
2026-06-18days on market $86,000 Active 16 DOM
-
2026-06-17days on market $86,000 Active 15 DOM
-
2026-06-16days on market $86,000 Active 14 DOM
-
2026-06-15days on market $86,000 Active 13 DOM
-
2026-06-13days on market $86,000 Active 11 DOM
-
2026-06-12days on market $86,000 Active 10 DOM
-
2026-06-09days on market $86,000 Active 7 DOM
-
2026-06-08days on market $86,000 Active 6 DOM
-
2026-06-07days on market $86,000 Active 5 DOM
-
2026-06-07days on market $86,000 Active 4 DOM
-
2026-06-01remarks 263-char remark
-
2026-06-01$86,000 Active 1 DOM
ⓘ Source: listings_history table (triggers on properties + properties_extension) + one-shot
backfill from property_details.listing_events for pre-trigger history.
Climate risk First Street
- Flood 1/10 Low FEMA zone X (unshaded) · 0% chance over 30 yrs
- Wildfire 4/10 Moderate
- Heat 2/10 Low 7 d/yr ≥97°F today · 13 d/yr by 30 yrs out
- Wind 2/10 Low
- Air quality 2/10 Low 1 unhealthy d/yr today · 1 by 30 yrs out
Nearby sold comps map
Loading sold comps map…
Walkable amenities ~0.75 mi
Loading nearby amenities…
Taxation est. · year 1
- Rental income
- $16,131
- − Mortgage interest
- −$4,817
- − Property taxes
- −$1,290
- − Insurance
- −$430
- − Repairs & maintenance
- −$1,290
- − Management
- −$1,290
- − Depreciation
- −$2,502
- Taxable income
- $4,511
- Est. tax owed @ 24.0%
- −$1,083
- After-tax cash flow
- $4,529/yr
For passive investors: Depreciation is non-cash, so a rental often shows a tax loss while cash-flowing — sheltering income. Rental losses are passive: they offset passive income freely, and up to $25,000/yr can offset ordinary (W-2) income if you actively participate and your MAGI is under $100k (phasing out to $0 by $150k); unused losses carry forward. On sale, claimed depreciation is recaptured at up to 25%, and gains may owe capital-gains tax (a 1031 exchange can defer both). Figures are a year-1 estimate at your 24.0% rate — not tax advice; consult a CPA.
Schools (NCES district)
- District
- Staples-Motley School District
- NCES district ID
- 2733900
- Math proficiency
- 37% ▼ -6.00%
- Reading proficiency
- 39% ▼ -10.00%
- Median HH income
- $41,979
- Composite
- 32.07/100
- National rank
- #5816
- State rank
- #238 of 301 in MN
Livability — Staples
- Score
- 65/100
- State rank
- #539
- US rank
- #12983
Category grades
Schools grade is shown separately in the Schools card above.
Census & demographics
- Census place
- Staples, MN
- Population (ZIP)
- 5,018
Population outlook (Todd County) Hauer SSP2
- Today (2025)
- 22,202 people
- By 2030
- 20,962 · -5.6%
- By 2040
- 18,352 · -17.3%
- By 2050
- 15,904 · -28.4%
- By 2075
- 11,348 · -48.9%
- By 2100
- 7,801 · -64.9%
Race, ethnicity, and origin ACS 2023
- Neighborhood character
- Predominantly White (86%)
- Race & ethnicity
- White 86% Two or more races 7% Hispanic / Latino 6% Black 1%
- Hispanic origin (detail)
- Mexican 3% Puerto Rican 3%
- Common ancestry
- Portuguese 16% Romanian 4% Lithuanian 3%
- Foreign-born
- 0%
- Languages at home
- 97% English-only · Spanish 1% German/W. Germanic 1%
Political lean MEDSL · Todd
- 2024 margin
- Solid R (+53.5) · D 22.5% · R 76.0% · Other 1.5%
- 2008→2024 swing
- -42.4pp toward R · 2008: -11.1pp · 2024: -53.5pp
- All cycles
- 2024: R+53.5 2020: R+48.8 2016: R+47.7 2012: R+16.1 2008: R+11.1
Not yet ingested
- Civics
- —
Market trends
- HPI YoY
- ▼ -12.71%
- Current HPI
- 194.5854
- Rent YoY
- —
- Metro
- —
- State GDP YoY
- ▲ 2.41%
- F500 in state
- 34
Industry mix (Fortune 500 HQ in MN)
| Industry | F500 HQs | Revenue |
|---|---|---|
| Healthcare | 2 | $407B |
|
||
| Retail | 2 | $150B |
|
||
| Consumer Goods | 2 | $32B |
|
||
| Industrial Machinery | 2 | $6B |
|
||
| Agriculture | 1 | $40B |
|
||
| Healthcare / Medical Devices | 1 | $32B |
|
||
Price history
+0.0% since first listed2 events — show timeline
- 2026-05-30 Listed $86,000 NORTHSTARMLS as Distributed by MLS Grid
- 2023-10-25 Sold (Public Records) $86,000 Public Records
Property tax history
-2.5%/yrLatest (2026): $50 · +0.0% YoY. Source: county tax records.
Cash-flow waterfall
monthlySold comps — $/sqft
last 12 mo · ≤1 miLoading sold comps…