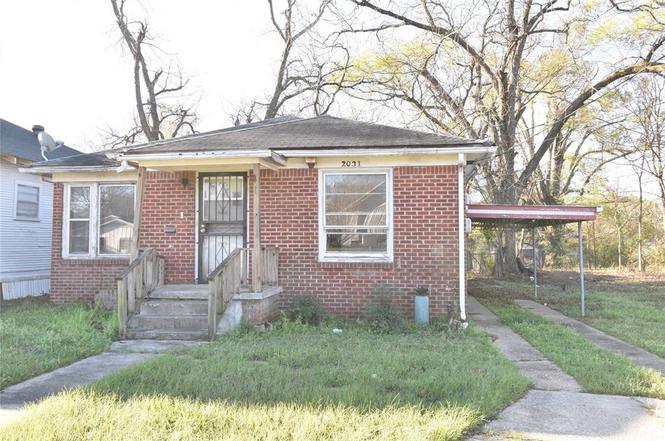
2031 Ashton St · Shreveport, LA
Flood risk 1/10 · Minimal
- FEMA flood zone
- X (unshaded)
- Chance of flooding over 30 yrs
- 0.0%
- Est. flood insurance / yr
- $507 – $1,088
Fire risk 1/10 · Minimal
- Est. fire insurance / yr
- $1,269 – $2,357
Heat risk 7/10 · Major
- Hot days now (above 110°F)
- 7 days/yr
- Hot days in 30 yrs
- 21 days/yr
Wind risk 6/10 · Moderate
- Chance of severe wind over 30 yrs
- 66.0%
Air-quality risk 2/10 · Minimal
- Unhealthy air days now
- 1 days/yr
- Unhealthy air days in 30 yrs
- 1 days/yr
Risk factors via First Street. Map © Google.
Why this score? — see what drove the C grade
The composite is a weighted blend of 9 inputs, each scored 0–100. Each bar is that input's sub-score; the figure is the points it added to the 100-point composite (weight × sub-score).
- Cash flow +15.0/30.0
- ARV discount +15.0/15.0
- 1% rule +5.0/10.0
- DSCR +5.0/10.0
- Appreciation +4.9/10.0
- Livability +3.0/5.0
- Rent growth +2.5/5.0
- Condition / age +2.5/5.0
- Schools +2.2/10.0
$17,000
🖨 Deal sheet (PDF) 📄 Offer letter ✓ Due diligence
Listing remarks
Solid 3-bedroom, 1-bath property with great bones and strong value-add potential. Featuring spacious rooms, a dedicated living area, and a separate dining room, this home offers a functional layout ideal for rental or resale. The fenced backyard includes a detached shop that provides additional storage or a potential income opportunity (buyer to verify use). The property is conveniently located just minutes from downtown, making it attractive for tenants seeking accessibility and affordability. Also Available as a package of 3 properties , MLS #21154257 1831 Rainwater, #21180863 7033 Karen Street With the right updates, this property could be an excellent addition to a rental portfolio o
Key facts
- Separate dining room
- Detached shop
- Functional layout
Tags
Property features AI
Finance
- Other: Directions: From Murphy Street, going east from Hearn, take a left onto Norma Street and then a left onto Ashton; home on the left.
- Financial info: Treat as clear loan type; No second mortgage noted
- HOA & community: No association
Exterior
- Parking: Carport (1 covered space); Additional parking and driveway
- Utilities: City water; City sewer; Electricity available; Natural gas available; Individual gas meter; Individual water meter; Concrete
- Home design: Single-family residence; Residential property; One story; Preowned (built in 1955)
- Construction: Wood construction; Asphalt roof; Year built 1955
- Exterior features: Lot under 0.5 acre (approximately 0.114 acres); Subdivision: Greenlawn Terrace
Interior
- Kitchen: No appliances listed
- Bedrooms: 3 bedrooms (all on the main level)
- Flooring: Carpet; Ceramic tile; Linoleum
- Bathrooms: 1 full bathroom
- Heating & cooling: No heating listed; No cooling listed
- Interior features: Cable TV available; High-speed internet available; One living area; One dining area; 6 total rooms; One-level home
- Laundry & utility: No laundry appliances listed
Neighborhood map
What this means for you Summary
Snapshot
- This is a 3-bed/1.0-bath single-family listed at $17k.
Deal economics
- At list price, monthly cash flow is $520 ($6k/yr) — positive.
- The deal already cash-flows at list — no discount required.
- Meets the 1% rule at list price ($814 rent vs $17k).
- Recommended offer: $16k (6.0% below list) — sets the bar for market timing.
- Cap rate 43.0% vs local median 5.6% in Shreveport — top-decile yield for the area; either an underpriced asset or a hidden risk that comps aren't pricing in. Stress-test before assuming the spread holds.
Location & tenants
- Location reads 59/100 on livability (#270 in LA) — a working-class tenant base; expect higher turnover. Strengths: cost of living A+, housing A; Watch: schools D+, crime F, amenities F.
- Caddo Parish (urban): math 21% / reading 32% proficiency, ranked #53 of 98 in LA (top 54%) — low school quality limits family demand, transient renter base, plan for 1-2y turnover; 64% free/reduced lunch — lower-income household profile, screen leases tightly.
- Market conditions: 70 active listings in the ZIP; 13 comparable units currently listed for rent nearby; rentals at typical pace (median 22d on market — plan ~3-4 weeks tenant-placement turnaround); 221 units permitted in Caddo Parish in 2024 (0 in 5+ unit buildings).
Forward outlook
- In year one you build about $90 of equity ($118 loan paydown + $-28 appreciation (-0.2% local appreciation)).
- Caddo County population projected at -15% by 2050 — secular population decline; favor cash flow + early exit over multi-decade hold.
- At projected returns (-0.2% appreciation + 3.0% rent growth), your $5k cash investment doubles in ~1 year — after that, you're playing with house money.
Negotiation context
- It's been on market 82 days — a 6% lower offer ($16k) is reasonable based on typical stale-listing flexibility.
Risks & watch-outs
- Watch-outs: built in 1955 — expect roof / HVAC / electrical / plumbing capex.
- Climate carrying-cost: major wind risk, 66% chance of damaging wind over 30y; extreme-heat days projected 7→21/yr by 2055 (HVAC capex compounding) — expect insurance premiums to compound above CPI over the hold.
Questions for the listing agent
- It's been on market 82 days. Have you received any prior offers? Is the seller open to a 6% concession, seller financing, or rate buy-down credit?
- Built in 1955 — when were the roof, HVAC, electrical panel, plumbing, and water heater last replaced?
- Why hasn't it sold? Are there any deal-killer items the seller is aware of (foundation, flood, title, zoning, code violations)?
- Is there a deadline driving the sale (1031 exchange, divorce, estate, relocation)? That informs how much negotiation room exists.
- Schools are D-rated, which usually means shorter tenancies and higher turnover. Who's the typical renter profile here, and what's been the actual vacancy rate?
- Crime grade is F in this area — have there been break-ins, vandalism, or insurance claims at this property in the last 3 years? What carrier currently insures it and at what premium?
- What's the average days-on-market for RENTAL listings here right now (not sales)? A rising rental-DOM trend means longer vacancies and softer asking-rent achievability than the comps imply.
- What's the recent tenant-quality profile in this submarket — average credit score on applications, eviction rate, late-payment / NSF rate, and stable-employment percentage? A property-management company in the area should have these aggregated.
- How much new for-sale + rental construction is in the pipeline within 1–3 miles? Heavy new supply typically softens prices + rents 12–24 months out; constrained supply supports both.
Investment metrics
- 1% rule
- 4.79% ✓
- Cap rate
- 42.99%
- Cash-on-cash
- 131.05%
- DSCR
- 6.83
- GRM
- 1.7
CMA / ARV
- ARV (on-the-fly)
- $29,417
- Comps found
- 9
Show comp detail 9 sales within ~0.75 mi
| Address | Dist | Beds/Ba | Sqft | Sold | Price | $/sf | Match |
|---|---|---|---|---|---|---|---|
| 2031 Ashton St | 0.00mi | 3/1.0 | 1,279 (0%) | 1mo | $17,000 | $13 | 99 |
| 2209 Murphy St | 0.17mi | 3/1.5 | 1,187 (-7%) | 3mo | $40,000 | $34 | 76 |
| 2751 Looney St | 0.54mi | 3/2.0 | 1,235 (-3%) | 2mo | $19,000 | $15 | 63 |
| 2609 Ashton St | 0.42mi | 3/1.0 | 1,144 (-11%) | 1mo | $55,000 | $48 | 62 |
| 1658 Ashton St | 0.44mi | 2/1.0 (-1) | 1,200 (-6%) | 12mo | $12,000 | $10 | 54 |
| 2105 Wyoming Cir | 0.41mi | 3/2.0 | 1,438 (+12%) | 10mo | $96,500 | $67 | 48 |
| 1856 W Jordan St | 0.30mi | 3/1.0 | 1,088 (-15%) | 19mo | $25,000 | $23 | 45 |
| 1646 Weinstock St | 0.47mi | 3/1.0 | 1,093 (-14%) | 13mo | $16,000 | $15 | 43 |
| 2532 Lillian St | 0.73mi | 4/1.0 (+1) | 1,387 (+8%) | 6mo | $32,000 | $23 | 42 |
Match score weights: distance 35% · size 25% · config 20% · recency 20%. Top-matched comps best support the ARV.
Projected returns pro-forma
-0.17% appreciation · 3.0% rent growth · sell at horizon
- IRR
- —
- Equity multiple
- 7.83×
- Total profit
- $32,494
- Equity at exit
- $4,796
- IRR
- —
- Equity multiple
- 16.35×
- Total profit
- $73,073
- Equity at exit
- $5,654
Cash invested: $4,760 (down + closing). Projections, not guarantees.
Landlord ↔ Tenant lean methodology
- Overall (STATE)
- 90 Strongly Landlord-Friendly
- State Louisiana
- 90 Strongly Landlord-Friendly · R+12
- County
- — inherits STATE
- City
- — inherits STATE
ZIP-level market 71103
- Home prices YoY
- -0.6%
- Active inventory
- 70
- Price-to-rent
- 1.7×
Monthly cashflow live
- Estimated rent
- $814 high interval (Pro) →
- Mortgage (P&I)
- −$89
- Tax from tax record
- −$27 /mo · $320/yr
- Insurance
- −$7
- HOA
- −$0
- Vacancy / Maint / Mgmt
- −$171
- Net cashflow
- $520
Break-even live
Sensitivity live
| Price | -10% $529 | -5% $525 | +0% $520 | +5% $515 | +10% $510 |
|---|---|---|---|---|---|
| Rent | -10% $456 | -5% $488 | +0% $520 | +5% $552 | +10% $584 |
| Rate | -1.0pp $528 | -0.5pp $524 | base $520 | +0.5pp $515 | +1.0pp $511 |
UW: 25.0% down · 7.5% · 30yr · 1.5% tax · 5.0% vac · 8.0% maint · 8.0% mgmt
Financing live
Cash to close
- Down payment
- $4,250
- Closing costs
- $510
- Reserves months
- —
- Total cash needed
- —
Loan-product check · same deal, 3 products live
Conventional
25% down · 7.5% · 30yr
- Down + closing
- —
- Monthly P&I
- —
- Monthly cashflow
- —
- DSCR
- —
- Eligible?
- —
Personal DTI + credit; lowest rate.
DSCR
20% down · 8.5% · 30yr
- Down + closing
- —
- Monthly P&I
- —
- Monthly cashflow
- —
- DSCR
- —
- Eligible?
- —
No personal income docs; deal must DSCR.
Hard money
10% down · 12.0% · 12mo
- Down + closing
- —
- Monthly P&I
- —
- Monthly cashflow
- —
- DSCR
- —
- Eligible?
- —
Short-term bridge; refi at stabilization.
Rent comps 13 comps
| Address | Beds | Baths | Sqft | Rent | $/sqft | DOM | Units | Dist |
|---|---|---|---|---|---|---|---|---|
| 2042 Laurel St Shreveport, LA | 3.0 | 1.0 | 1100 | $800 | $0.73 | 45d | 1 | 0.42mi |
| 2712 Ashton St Shreveport, LA | 2.0 | 1.0 | 875 | $700 | $0.80 | 14d | 1 | 0.47mi |
| 1818 Perrin St Shreveport, LA | 3.0 | 1.5 | 1129 | $895 | $0.79 | 45d | 1 | 0.61mi |
| 1928 Alston St Shreveport, LA | 3.0 | 2.0 | 1100 | $750 | $0.68 | 45d | 1 | 0.77mi |
| 1719 Lakeshore Dr Shreveport, LA | 3.0 | 1.5 | 1200 | $950 | $0.79 | 45d | 1 | 0.77mi |
| 3022 Lillian St Shreveport, LA | 2.0 | 1.0 | 1115 | $695 | $0.62 | 22d | 1 | 1.03mi |
| 3323 Darien St Shreveport, LA | 3.0 | 1.0 | 1200 | $785 | $0.65 | 45d | 1 | 1.34mi |
| 3612 Michigan Blvd Shreveport, LA | 2.0 | 1.0 | 1200 | $615 | $0.51 | 14d | 1 | 1.37mi |
| 3420 Darien St Shreveport, LA | 2.0 | 1.0 | 1200 | $665 | $0.55 | 14d | 1 | 1.38mi |
| 1101 College St Shreveport, LA | 2.0 | 2.0 | 1100 | $850 | $0.77 | 14d | 1 | 1.38mi |
| 624 Texas St Shreveport, LA | 2.0 | 1.5 | 953 | $2,358 | $2.47 | 14d | 2 | 1.42mi |
| 2134 Queens Hwy Shreveport, LA | 3.0 | 1.5 | 1374 | $1,475 | $1.07 | 22d | 1 | 1.44mi |
| 3515 Stonewall St Shreveport, LA | 2.0 | 1.0 | 1000 | $600 | $0.60 | 14d | 1 | 1.49mi |
Listing history 8 events
-
2026-05-10status Pending
-
2026-04-25historical Active Contingent
-
2026-03-10price $17,000
-
2026-02-24price $18,000
-
2026-02-16$19,500 Active
-
2007-01-22soldstatus
-
2004-09-27soldstatus
-
1991-09-25soldstatus
ⓘ Source: listings_history table (triggers on properties + properties_extension) + one-shot
backfill from property_details.listing_events for pre-trigger history.
Tax reassessment forecast LA · Resets to sale price
- Current annual tax
- $320 · $27/mo
- Projected year-2 tax
- $320 · $27/mo
- Expected delta
- $0/yr ($0/mo · 0.0%)
ⓘ Screening estimate from a state-policy table — verify with the county assessor before closing.
Climate risk First Street
- Flood 1/10 Low FEMA zone X (unshaded) · 0% chance over 30 yrs
- Wildfire 1/10 Low
- Heat 7/10 Severe 7 d/yr ≥110°F today · 21 d/yr by 30 yrs out
- Wind 6/10 Major 66% chance of damaging wind over 30 yrs
- Air quality 2/10 Low 1 unhealthy d/yr today · 1 by 30 yrs out
Nearby sold comps map
Loading sold comps map…
Walkable amenities ~0.75 mi
Loading nearby amenities…
Taxation est. · year 1
- Rental income
- $9,763
- − Mortgage interest
- −$952
- − Property taxes
- −$320
- − Insurance
- −$85
- − Repairs & maintenance
- −$781
- − Management
- −$781
- − Depreciation
- −$495
- Taxable income
- $6,349
- Est. tax owed @ 24.0%
- −$1,524
- After-tax cash flow
- $4,714/yr
For passive investors: Depreciation is non-cash, so a rental often shows a tax loss while cash-flowing — sheltering income. Rental losses are passive: they offset passive income freely, and up to $25,000/yr can offset ordinary (W-2) income if you actively participate and your MAGI is under $100k (phasing out to $0 by $150k); unused losses carry forward. On sale, claimed depreciation is recaptured at up to 25%, and gains may owe capital-gains tax (a 1031 exchange can defer both). Figures are a year-1 estimate at your 24.0% rate — not tax advice; consult a CPA.
Schools (NCES district)
- District
- Caddo Parish
- NCES district ID
- 2200300
- Math proficiency
- 21% ▼ -33.00%
- Reading proficiency
- 32% ▼ -30.00%
- Median HH income
- $39,227
- Composite
- 22.23/100
- National rank
- #8148
- State rank
- #53 of 98 in LA
Livability — Shreveport
- Score
- 59/100
- State rank
- #270
- US rank
- #19730
Category grades
Schools grade is shown separately in the Schools card above.
Census & demographics
- Census place
- Shreveport, LA
- City population
- 164,123
- Population (ZIP)
- 6,142
Population outlook (Caddo County) Hauer SSP2
- Today (2025)
- 243,190 people
- By 2030
- 237,231 · -2.5%
- By 2040
- 222,502 · -8.5%
- By 2050
- 206,516 · -15.1%
- By 2075
- 165,706 · -31.9%
- By 2100
- 122,262 · -49.7%
Race, ethnicity, and origin ACS 2023
- Neighborhood character
- Predominantly Black (81%)
- Race & ethnicity
- Black 81% White 17% Hispanic / Latino 1%
- Common ancestry
- Slovak 3% Hispanic 1%
- Languages at home
- 99% English-only · Spanish 1%
Political lean MEDSL · Caddo
- 2024 margin
- Toss-up / Even · D 51.6% · R 47.0% · Other 1.4%
- 2008→2024 swing
- +1.6pp toward D · 2008: 3.0pp · 2024: 4.6pp
- All cycles
- 2024: D+4.6 2020: D+6.8 2016: D+4.2 2012: D+4.9 2008: D+3.0
Not yet ingested
- Civics
- —
Market trends
- HPI YoY
- ▼ -0.17%
- Current HPI
- 26.3904
- Rent YoY
- —
- Metro
- —
- State GDP YoY
- ▲ 3.29%
- F500 in state
- 10
Industry mix (Fortune 500 HQ in LA)
| Industry | F500 HQs | Revenue |
|---|---|---|
| Telecommunications | 2 | $23B |
|
||
| Utilities | 1 | $12B |
|
||
| Wholesale / Distribution | 1 | $5B |
|
||
| Advertising | 1 | $2B |
|
||
Price history
-12.8% since first listed8 events — show timeline
- 2026-05-10 Pending — NTREIS
- 2026-04-25 Contingent — NTREIS
- 2026-03-10 Price Changed $17,000 NTREIS
- 2026-02-24 Price Changed $18,000 NTREIS
- 2026-02-16 Listed $19,500 NTREIS
- 2007-01-22 Sold (Public Records) — Public Records
- 2004-09-27 Sold (Public Records) — Public Records
- 1991-09-25 Sold (Public Records) — Public Records
Property tax history
-2.1%/yrLatest (2025): $320 · +0.4% YoY. Source: county tax records.
Cash-flow waterfall
monthlySold comps — $/sqft
last 12 mo · ≤1 miLoading sold comps…