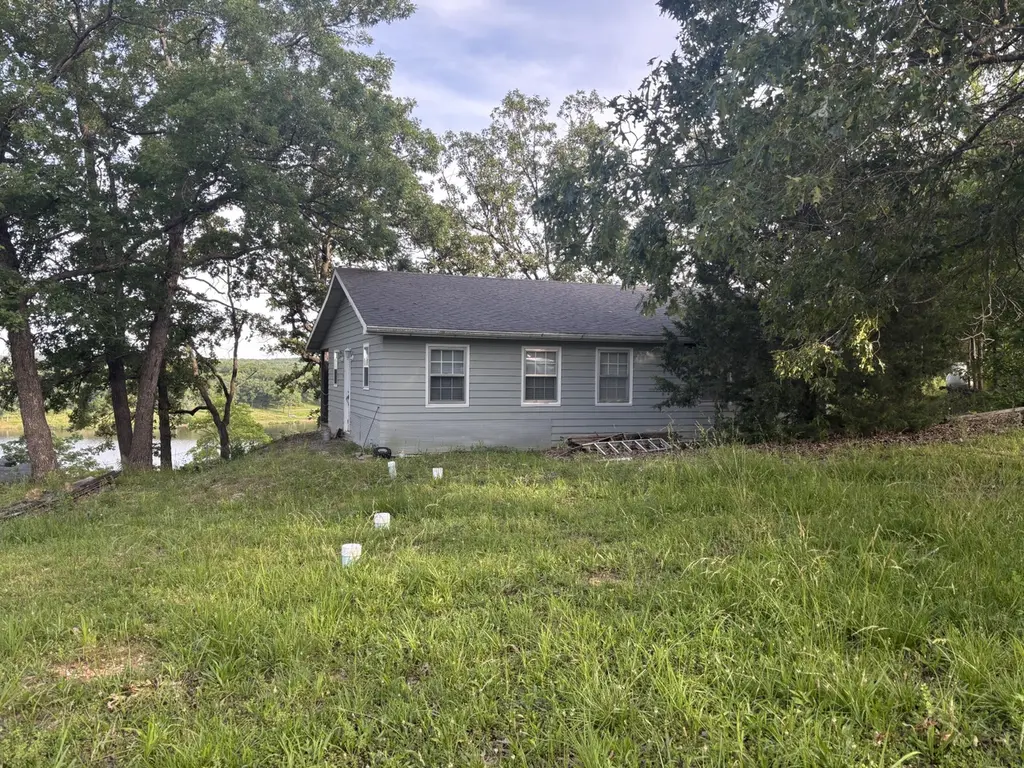
25211 County Road 327 · Urbana, MO
Flood risk 1/10 · Minimal
- FEMA flood zone
- —
- Chance of flooding over 30 yrs
- 0.0%
- Est. flood insurance / yr
- —
Fire risk 3/10 · Minor
- Est. fire insurance / yr
- $1,054 – $1,958
Heat risk 5/10 · Moderate
- Hot days now (above 107°F)
- 7 days/yr
- Hot days in 30 yrs
- 19 days/yr
Wind risk 2/10 · Minimal
- Chance of severe wind over 30 yrs
- —
Air-quality risk 2/10 · Minimal
- Unhealthy air days now
- 0 days/yr
- Unhealthy air days in 30 yrs
- 1 days/yr
Risk factors via First Street. Map © Google.
Why this score? — see what drove the C- grade
The composite is a weighted blend of 9 inputs, each scored 0–100. Each bar is that input's sub-score; the figure is the points it added to the 100-point composite (weight × sub-score).
- Cash flow +14.2/30.0
- Appreciation +8.2/10.0
- ARV discount +7.5/15.0
- Schools +5.4/10.0
- DSCR +4.3/10.0
- 1% rule +3.1/10.0
- Livability +2.9/5.0
- Rent growth +2.5/5.0
- Condition / age +2.5/5.0
$115,000
🖨 Deal sheet 📄 Offer letter ✓ Due diligence
Listing remarks
Priced to sell. Two-bedroom one-bathroom cabin located on Pomme de Terre lake. Off the back deck has a great view of the lake. This property could be used a weekend rental or a permanent residence. A little elbow grease and you would have a nice place to get away from the hustle of city life.
Key facts
- Pomme de terre lake
- 0.37 acre lot
- Built 2004
Tags
Property features AI
Finance
- HOA & community: Homeowners association with an annual fee of $150 (approximately $12.50/month)
Exterior
- Utilities: Propane; Septic tank
- Home design: Single-family residence; One story
- Construction: Wood siding; Composition roof; Slab foundation; Built with one level
- Exterior features: Deck; Lakefront view
Interior
- Kitchen: Electric oven; Free-standing electric oven; Refrigerator
- Flooring: Tile
- Bathrooms: 1 full bathroom
- Heating & cooling: Propane heat; Window air conditioning units
- Interior features: Tile flooring; Electric oven; Free-standing electric oven; Refrigerator
- Laundry & utility: Laundry on the main level
Neighborhood map
What this means for you Summary
Snapshot
- This is a 2-bed/1.0-bath other listed at $115k.
Deal economics
- At list price, monthly cash flow is $18 ($217/yr) — positive.
- The deal already cash-flows at list — no discount required.
- To meet the 1% rule (rent ≥ 1% of price), the offer needs to be $93k (19.2% below list).
- Recommended offer: $93k (19.2% below list) — sets the bar for 1% rule.
- Cap rate 6.5% vs local median 4.2% in Urbana — top-decile yield for the area; either an underpriced asset or a hidden risk that comps aren't pricing in. Stress-test before assuming the spread holds.
Location & tenants
- Location reads 57/100 on livability (#629 in MO) — a working-class tenant base; expect higher turnover. Strengths: cost of living A+, housing A+; Watch: crime F, amenities F, commute F.
- Hickory County R-I (rural): math 65% / reading 66% proficiency, ranked #8 of 324 in MO (top 2%) — acceptable for families but not a draw, mixed tenant base, ~2y average lease.
- Zoned schools: Skyline Elem. (math 82% / reading 82%, grade A+, #4 of 1,115 statewide, top 0%, 306 students, 45% FRL); Skyline Middle (math 57% / reading 59%, grade B, #26 of 391 statewide, top 7%, 206 students, 40% FRL); Skyline High (math 64% / reading 74%, grade B, #10 of 521 statewide, top 2%, 215 students, 38% FRL) — zoned schools at 41% FRL track the district average.
- Market conditions: 35 active listings in the ZIP.
Forward outlook
- In year one you build about $8k of equity ($795 loan paydown + $7k appreciation (6.3% local appreciation)).
- Hickory County population projected at -26% by 2050 — secular population decline; favor cash flow + early exit over multi-decade hold.
- At projected returns (6.3% appreciation + 3.0% rent growth), your $32k cash investment doubles in ~4 years — after that, you're playing with house money.
- By year 5, paydown + projected appreciation supports a ~$36k cash-out refi (75% LTV) — recoverable capital for the next deal without selling this one.
Negotiation context
- Only 14 days on market — expect competitive offers; lowballing is unlikely to land.
Risks & watch-outs
- Climate carrying-cost: extreme-heat days projected 7→19/yr by 2055 (HVAC capex compounding) — expect insurance premiums to compound above CPI over the hold.
Questions for the listing agent
- What does the HOA fee cover, when was the last increase, and are there any pending special assessments or reserve-fund shortfalls?
- Is there a deadline driving the sale (1031 exchange, divorce, estate, relocation)? That informs how much negotiation room exists.
- Schools are B-rated — typically a magnet for longer-tenancy family renters. What's the average tenant stay here, and is there a school-zone premium baked into asking?
- Crime grade is F in this area — have there been break-ins, vandalism, or insurance claims at this property in the last 3 years? What carrier currently insures it and at what premium?
- What's the average days-on-market for RENTAL listings here right now (not sales)? A rising rental-DOM trend means longer vacancies and softer asking-rent achievability than the comps imply.
- What's the recent tenant-quality profile in this submarket — average credit score on applications, eviction rate, late-payment / NSF rate, and stable-employment percentage? A property-management company in the area should have these aggregated.
- How much new for-sale + rental construction is in the pipeline within 1–3 miles? Heavy new supply typically softens prices + rents 12–24 months out; constrained supply supports both.
Investment metrics
- 1% rule
- 0.81% ✗
- Cap rate
- 6.48%
- Cash-on-cash
- 0.67%
- DSCR
- 1.03
- GRM
- 10.3
CMA / ARV
No comps found within radius.
Projected returns pro-forma
6.35% appreciation · 3.0% rent growth · sell at horizon
- IRR
- 16.7%
- Equity multiple
- 2.14×
- Total profit
- $36,718
- Equity at exit
- $74,844
- IRR
- 16.5%
- Equity multiple
- 4.31×
- Total profit
- $106,448
- Equity at exit
- $137,983
Cash invested: $32,200 (down + closing). Projections, not guarantees.
Landlord ↔ Tenant lean methodology
- Overall (STATE)
- 81 Strongly Landlord-Friendly
- State Missouri
- 81 Strongly Landlord-Friendly · R+10
- County
- — inherits STATE
- City
- — inherits STATE
ZIP-level market 65767
- Home prices YoY
- 2.5%
- Active inventory
- 35
- Price-to-rent
- 10.3×
Monthly cashflow live
- Estimated rent
- $929 medium interval (Pro) →
- Mortgage (P&I)
- −$603
- Tax from tax record
- −$52 /mo · $626/yr
- Insurance
- −$48
- HOA
- −$13
- Vacancy / Maint / Mgmt
- −$195
- Net cashflow
- $18
Break-even live
UW: 25.0% down · 7.5% · 30yr · 1.5% tax · 5.0% vac · 8.0% maint · 8.0% mgmt
Financing live
Cash to close
- Down payment
- $28,750
- Closing costs
- $3,450
- Reserves months
- —
- Total cash needed
- —
Loan-product check · same deal, 3 products live
Conventional
25% down · 7.5% · 30yr
- Down + closing
- —
- Monthly P&I
- —
- Monthly cashflow
- —
- DSCR
- —
- Eligible?
- —
Personal DTI + credit; lowest rate.
DSCR
20% down · 8.5% · 30yr
- Down + closing
- —
- Monthly P&I
- —
- Monthly cashflow
- —
- DSCR
- —
- Eligible?
- —
No personal income docs; deal must DSCR.
Hard money
10% down · 12.0% · 12mo
- Down + closing
- —
- Monthly P&I
- —
- Monthly cashflow
- —
- DSCR
- —
- Eligible?
- —
Short-term bridge; refi at stabilization.
HOA detail
- Monthly dues
- $13 · $156/yr
Listing history 11 events
-
2026-06-19days on market $115,000 Active 14 DOM
-
2026-06-18days on market $115,000 Active 13 DOM
-
2026-06-17days on market $115,000 Active 12 DOM
-
2026-06-16days on market $115,000 Active 11 DOM
-
2026-06-15days on market $115,000 Active 10 DOM
-
2026-06-14days on market $115,000 Active 8 DOM
-
2026-06-12days on market $115,000 Active 7 DOM
-
2026-06-09days on market $115,000 Active 4 DOM
-
2026-06-08days on market $115,000 Active 3 DOM
-
2026-06-07remarks 293-char remark
-
2026-06-07$115,000 Active 2 DOM
ⓘ Source: listings_history table (triggers on properties + properties_extension) + one-shot
backfill from property_details.listing_events for pre-trigger history.
Tax reassessment forecast MO · Resets to sale price
- Current annual tax
- $626 · $52/mo
- Projected year-2 tax
- $1,116 · $93/mo
- Expected delta
- +$490/yr (+$41/mo · 78.2%)
ⓘ Screening estimate from a state-policy table — verify with the county assessor before closing.
Climate risk First Street
- Flood 1/10 Low 0% chance over 30 yrs
- Wildfire 3/10 Moderate
- Heat 5/10 Major 7 d/yr ≥107°F today · 19 d/yr by 30 yrs out
- Wind 2/10 Low
- Air quality 2/10 Low 0 unhealthy d/yr today · 1 by 30 yrs out
Nearby sold comps map
Loading sold comps map…
Walkable amenities ~0.75 mi
Loading nearby amenities…
Taxation est. · year 1
- Rental income
- $11,153
- − Mortgage interest
- −$6,442
- − Property taxes
- −$626
- − Insurance
- −$575
- − Repairs & maintenance
- −$892
- − Management
- −$892
- − HOA
- −$156
- − Depreciation
- −$3,345
- Taxable loss
- −$1,776
- Est. tax savings @ 24.0%
- +$426
- After-tax cash flow
- $643/yr
For passive investors: Depreciation is non-cash, so a rental often shows a tax loss while cash-flowing — sheltering income. Rental losses are passive: they offset passive income freely, and up to $25,000/yr can offset ordinary (W-2) income if you actively participate and your MAGI is under $100k (phasing out to $0 by $150k); unused losses carry forward. On sale, claimed depreciation is recaptured at up to 25%, and gains may owe capital-gains tax (a 1031 exchange can defer both). Figures are a year-1 estimate at your 24.0% rate — not tax advice; consult a CPA.
Schools (NCES district)
- District
- Hickory County R-I
- NCES district ID
- 2914320
- Math proficiency
- 65% ▼ -4.00%
- Reading proficiency
- 66% ▲ 1.00%
- Median HH income
- $33,125
- Composite
- 54.03/100
- National rank
- #1393
- State rank
- #8 of 324 in MO
Livability — Urbana
- Score
- 57/100
- State rank
- #629
- US rank
- #21576
Category grades
Schools grade is shown separately in the Schools card above.
Census & demographics
- Population (ZIP)
- 1,860
Population outlook (Hickory County) Hauer SSP2
- Today (2025)
- 8,206 people
- By 2030
- 7,690 · -6.3%
- By 2040
- 6,780 · -17.4%
- By 2050
- 6,076 · -26.0%
- By 2075
- 5,088 · -38.0%
- By 2100
- 4,489 · -45.3%
Race, ethnicity, and origin ACS 2023
- Neighborhood character
- Predominantly White (94%)
- Race & ethnicity
- White 94% Two or more races 5%
- Common ancestry
- Romanian 14% Iranian 9% Italian 1%
- Foreign-born
- 0%
Political lean MEDSL · Hickory
- 2024 margin
- Solid R (+61.1) · D 19.1% · R 80.2%
- 2008→2024 swing
- -47.9pp toward R · 2008: -13.3pp · 2024: -61.1pp
- All cycles
- 2024: R+61.1 2020: R+57.3 2016: R+53.5 2012: R+23.6 2008: R+13.3
Not yet ingested
- Civics
- —
Market trends
- HPI YoY
- ▲ 6.35%
- Current HPI
- 256.3794
- Rent YoY
- —
- Metro
- —
- State GDP YoY
- ▲ 1.84%
- F500 in state
- 20
Industry mix (Fortune 500 HQ in MO)
| Industry | F500 HQs | Revenue |
|---|---|---|
| Healthcare | 1 | $163B |
|
||
| Insurance | 1 | $21B |
|
||
| Industrial Technology | 1 | $17B |
|
||
| Retail | 1 | $16B |
|
||
| Industrial Distribution | 1 | $10B |
|
||
| Utilities | 1 | $9B |
|
||
Price history
1 event — show timeline
- 2026-06-05 Listed $115,000 SOMO
Property tax history
+1.8%/yrLatest (2025): $626 · +6.3% YoY. Source: county tax records.
Cash-flow waterfall
monthlySold comps — $/sqft
last 12 mo · ≤1 miLoading sold comps…