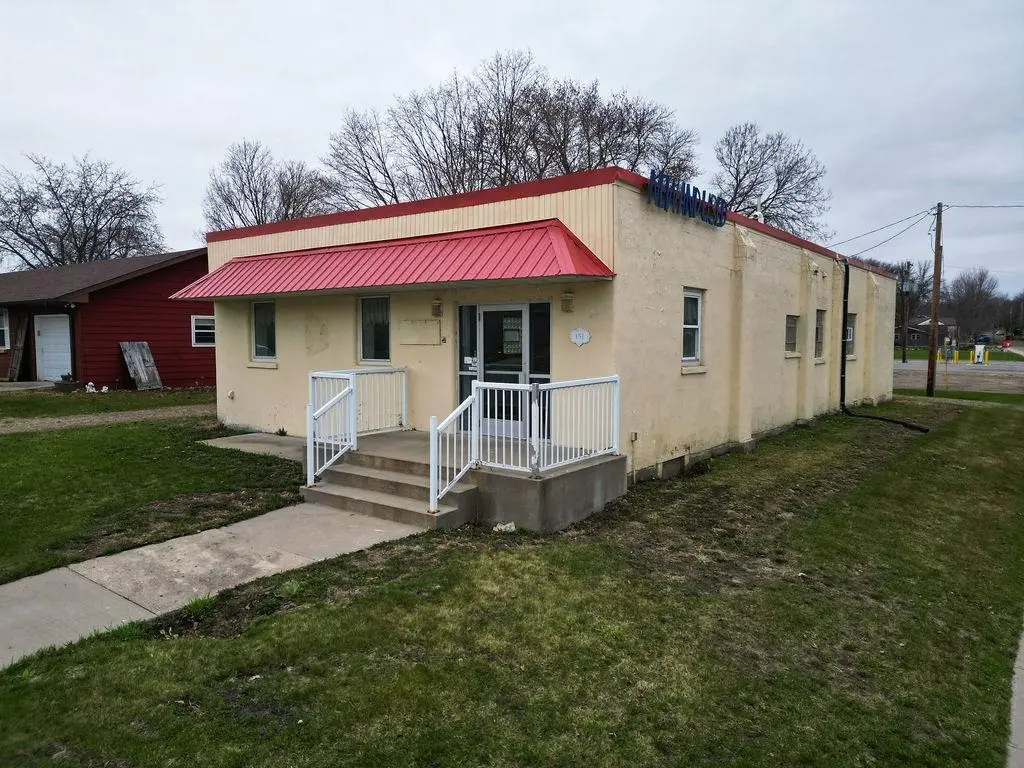
151 7th St N · Albany, MN
Flood risk No data
- FEMA flood zone
- —
- Chance of flooding over 30 yrs
- —
- Est. flood insurance / yr
- —
Fire risk No data
- Est. fire insurance / yr
- —
Heat risk No data
- Hot days now (above threshold)
- —
- Hot days in 30 yrs
- —
Wind risk No data
- Chance of severe wind over 30 yrs
- —
Air-quality risk No data
- Unhealthy air days now
- —
- Unhealthy air days in 30 yrs
- —
Risk factors via First Street. Map © Google.
Why this score? — see what drove the B grade
The composite is a weighted blend of 9 inputs, each scored 0–100. Each bar is that input's sub-score; the figure is the points it added to the 100-point composite (weight × sub-score).
- Cash flow +30.0/30.0
- DSCR +10.0/10.0
- 1% rule +9.2/10.0
- ARV discount +7.5/15.0
- Schools +5.0/10.0
- Livability +3.7/5.0
- Rent growth +2.5/5.0
- Condition / age +2.5/5.0
- Appreciation +0.0/10.0
$75,000
🖨 Deal sheet 📄 Offer letter ✓ Due diligence
Listing remarks
Great opportunity to invest in a unique and affordable property! This former commercial building is finished on both levels with open-concept layouts, offering endless potential—perfect for starting a business, creating residential space, or developing rental units. Building has been vacant for a while, there is a musty smell.
Key facts
- Open-concept layouts
- Endless potential
- 6,969 sq ft lot
Tags
Property features AI
Exterior
- Parking: Gravel parking
- Utilities: City water (connected); City sewer (connected); Natural gas
- Home design: Residential property; One story; Entry level: Main; Flat roof
- Construction: Poured concrete foundation
- Exterior features: Stucco exterior; Corner lot; City street frontage
Interior
- Bedrooms: 2 bedrooms
- Bathrooms: One half bath on main floor
- Heating & cooling: Forced air heating; Central air conditioning
- Interior features: Full basement; Main floor half bath; Living room on main level; Lower-level family room; Utility room on lower level
- Laundry & utility: Lower-level utility room (17x16)
Neighborhood map
What this means for you Summary
Snapshot
- This is a 2-bed/1.0-bath single-family listed at $75k.
Deal economics
- At list price, monthly cash flow is $325 ($4k/yr) — positive.
- The deal already cash-flows at list — no discount required.
- Meets the 1% rule at list price ($1k rent vs $75k).
- Recommended offer: $73k (3.0% below list) — sets the bar for market timing.
Location & tenants
- Location reads 74/100 on livability (#208 in MN, #4,381 nationally) — a middle-class / working-renter tenant base. Strengths: cost of living A+, housing A+, health & safety A+; Watch: amenities F, commute F.
- Albany Public School District (rural): math 57% / reading 58% proficiency, ranked #51 of 301 in MN (top 17%) — acceptable for families but not a draw, mixed tenant base, ~2y average lease; only 15% free/reduced lunch — higher-income household profile.
- Market conditions: 22 active listings in the ZIP; 661 units permitted in Stearns County in 2024 (291 in 5+ unit buildings).
Forward outlook
- Local home prices are declining (-3.0%/yr); year-one equity from $519 of loan paydown is wiped out by about $2k of value loss. Plan a longer hold.
- Stearns County population projected at +9% by 2050 — modest demand growth; plan on rents tracking national, not racing it.
- At projected returns (-3.0% appreciation + 3.0% rent growth), your $21k cash investment doubles in ~7 years — after that, you're playing with house money.
Negotiation context
- It's been on market 50 days — a 3% lower offer ($73k) is reasonable based on typical stale-listing flexibility.
Risks & watch-outs
- Watch-outs: built in 1950 — expect roof / HVAC / electrical / plumbing capex.
Questions for the listing agent
- It's been on market 50 days. Have you received any prior offers? Is the seller open to a 3% concession, seller financing, or rate buy-down credit?
- Built in 1950 — when were the roof, HVAC, electrical panel, plumbing, and water heater last replaced?
- Is there a deadline driving the sale (1031 exchange, divorce, estate, relocation)? That informs how much negotiation room exists.
- Schools are B-rated — typically a magnet for longer-tenancy family renters. What's the average tenant stay here, and is there a school-zone premium baked into asking?
- What's the average days-on-market for RENTAL listings here right now (not sales)? A rising rental-DOM trend means longer vacancies and softer asking-rent achievability than the comps imply.
- What's the recent tenant-quality profile in this submarket — average credit score on applications, eviction rate, late-payment / NSF rate, and stable-employment percentage? A property-management company in the area should have these aggregated.
- How much new for-sale + rental construction is in the pipeline within 1–3 miles? Heavy new supply typically softens prices + rents 12–24 months out; constrained supply supports both.
Investment metrics
- 1% rule
- 1.42% ✓
- Cap rate
- 11.50%
- Cash-on-cash
- 18.60%
- DSCR
- 1.83
- GRM
- 5.9
CMA / ARV
No comps found within radius.
Projected returns pro-forma
-3.0% appreciation · 3.0% rent growth · sell at horizon
- IRR
- 10.4%
- Equity multiple
- 1.41×
- Total profit
- $8,594
- Equity at exit
- $11,183
- IRR
- 19.5%
- Equity multiple
- 2.63×
- Total profit
- $34,244
- Equity at exit
- $6,485
Cash invested: $21,000 (down + closing). Projections, not guarantees.
Landlord ↔ Tenant lean methodology
- Overall (STATE)
- 46 Balanced
- State Minnesota
- 46 Balanced · D+2
- County
- — inherits STATE
- City
- — inherits STATE
ZIP-level market 56307
- Home prices YoY
- -7.5%
- Active inventory
- 22
- Price-to-rent
- 5.9×
Monthly cashflow live
- Estimated rent
- $1,068 medium interval (Pro) →
- Mortgage (P&I)
- −$393
- Tax est. 1.5%
- −$94 /mo · $1,125/yr
- Insurance
- −$31
- HOA
- −$0
- Vacancy / Maint / Mgmt
- −$224
- Net cashflow
- $325
Break-even live
UW: 25.0% down · 7.5% · 30yr · 1.5% tax · 5.0% vac · 8.0% maint · 8.0% mgmt
Financing live
Cash to close
- Down payment
- $18,750
- Closing costs
- $2,250
- Reserves months
- —
- Total cash needed
- —
Loan-product check · same deal, 3 products live
Conventional
25% down · 7.5% · 30yr
- Down + closing
- —
- Monthly P&I
- —
- Monthly cashflow
- —
- DSCR
- —
- Eligible?
- —
Personal DTI + credit; lowest rate.
DSCR
20% down · 8.5% · 30yr
- Down + closing
- —
- Monthly P&I
- —
- Monthly cashflow
- —
- DSCR
- —
- Eligible?
- —
No personal income docs; deal must DSCR.
Hard money
10% down · 12.0% · 12mo
- Down + closing
- —
- Monthly P&I
- —
- Monthly cashflow
- —
- DSCR
- —
- Eligible?
- —
Short-term bridge; refi at stabilization.
Listing history 16 events
-
2026-06-18days on market $75,000 Active 50 DOM
-
2026-06-17days on market $75,000 Active 49 DOM
-
2026-06-16days on market $75,000 Active 48 DOM
-
2026-06-15days on market $75,000 Active 47 DOM
-
2026-06-13days on market $75,000 Active 45 DOM
-
2026-06-12days on market $75,000 Active 44 DOM
-
2026-06-09days on market $75,000 Active 41 DOM
-
2026-06-08days on market $75,000 Active 40 DOM
-
2026-06-07days on market $75,000 Active 39 DOM
-
2026-06-05days on market $75,000 Active 37 DOM
-
2026-06-04days on market $75,000 Active 35 DOM
-
2026-06-02days on market $75,000 Active 34 DOM
-
2026-06-01days on market $75,000 Active 33 DOM
-
2026-05-31days on market $75,000 Active 32 DOM
-
2026-05-31days on market $75,000 Active 31 DOM
-
2026-04-28$75,000 Active 334-char remark
ⓘ Source: listings_history table (triggers on properties + properties_extension) + one-shot
backfill from property_details.listing_events for pre-trigger history.
Nearby sold comps map
Loading sold comps map…
Walkable amenities ~0.75 mi
Loading nearby amenities…
Taxation est. · year 1
- Rental income
- $12,817
- − Mortgage interest
- −$4,201
- − Property taxes
- −$1,125
- − Insurance
- −$375
- − Repairs & maintenance
- −$1,025
- − Management
- −$1,025
- − Depreciation
- −$2,182
- Taxable income
- $2,884
- Est. tax owed @ 24.0%
- −$692
- After-tax cash flow
- $3,214/yr
For passive investors: Depreciation is non-cash, so a rental often shows a tax loss while cash-flowing — sheltering income. Rental losses are passive: they offset passive income freely, and up to $25,000/yr can offset ordinary (W-2) income if you actively participate and your MAGI is under $100k (phasing out to $0 by $150k); unused losses carry forward. On sale, claimed depreciation is recaptured at up to 25%, and gains may owe capital-gains tax (a 1031 exchange can defer both). Figures are a year-1 estimate at your 24.0% rate — not tax advice; consult a CPA.
Schools (NCES district)
- District
- Albany Public School District
- NCES district ID
- 2702930
- Math proficiency
- 57% ▼ -14.00%
- Reading proficiency
- 58% ▼ -11.00%
- Median HH income
- $63,768
- Composite
- 50.32/100
- National rank
- #1881
- State rank
- #51 of 301 in MN
Livability — Albany
- Score
- 74/100
- State rank
- #208
- US rank
- #4381
Category grades
Schools grade is shown separately in the Schools card above.
Census & demographics
- Census place
- Albany, MN
- Population (ZIP)
- 5,227
Population outlook (Stearns County) Hauer SSP2
- Today (2025)
- 162,629 people
- By 2030
- 166,495 · +2.4%
- By 2040
- 172,661 · +6.2%
- By 2050
- 177,480 · +9.1%
- By 2075
- 192,907 · +18.6%
- By 2100
- 206,274 · +26.8%
Race, ethnicity, and origin ACS 2023
- Neighborhood character
- Predominantly White (94%)
- Race & ethnicity
- White 94% Two or more races 4% Hispanic / Latino 2%
- Common ancestry
- Portuguese 8% Romanian 7% Iranian 3%
- Foreign-born
- 2% · Canada, South Korea
- Languages at home
- 96% English-only · Spanish 1% Korean 1% German/W. Germanic 1%
Political lean MEDSL · Stearns
- 2024 margin
- Strong R (+26.8) · D 35.7% · R 62.5% · Other 1.9%
- 2008→2024 swing
- -19.8pp toward R · 2008: -7.0pp · 2024: -26.8pp
- All cycles
- 2024: R+26.8 2020: R+22.5 2016: R+27.9 2012: R+12.1 2008: R+7.0
Not yet ingested
- Civics
- —
Market trends
- HPI YoY
- ▼ -32.29%
- Current HPI
- 400.87
- Rent YoY
- —
- Metro
- —
- State GDP YoY
- ▲ 2.41%
- F500 in state
- 34
Industry mix (Fortune 500 HQ in MN)
| Industry | F500 HQs | Revenue |
|---|---|---|
| Healthcare | 2 | $407B |
|
||
| Retail | 2 | $150B |
|
||
| Consumer Goods | 2 | $32B |
|
||
| Industrial Machinery | 2 | $6B |
|
||
| Agriculture | 1 | $40B |
|
||
| Healthcare / Medical Devices | 1 | $32B |
|
||
Price history
1 event — show timeline
- 2026-04-28 Listed $75,000 NORTHSTARMLS as Distributed by MLS Grid
Cash-flow waterfall
monthlySold comps — $/sqft
last 12 mo · ≤1 miLoading sold comps…