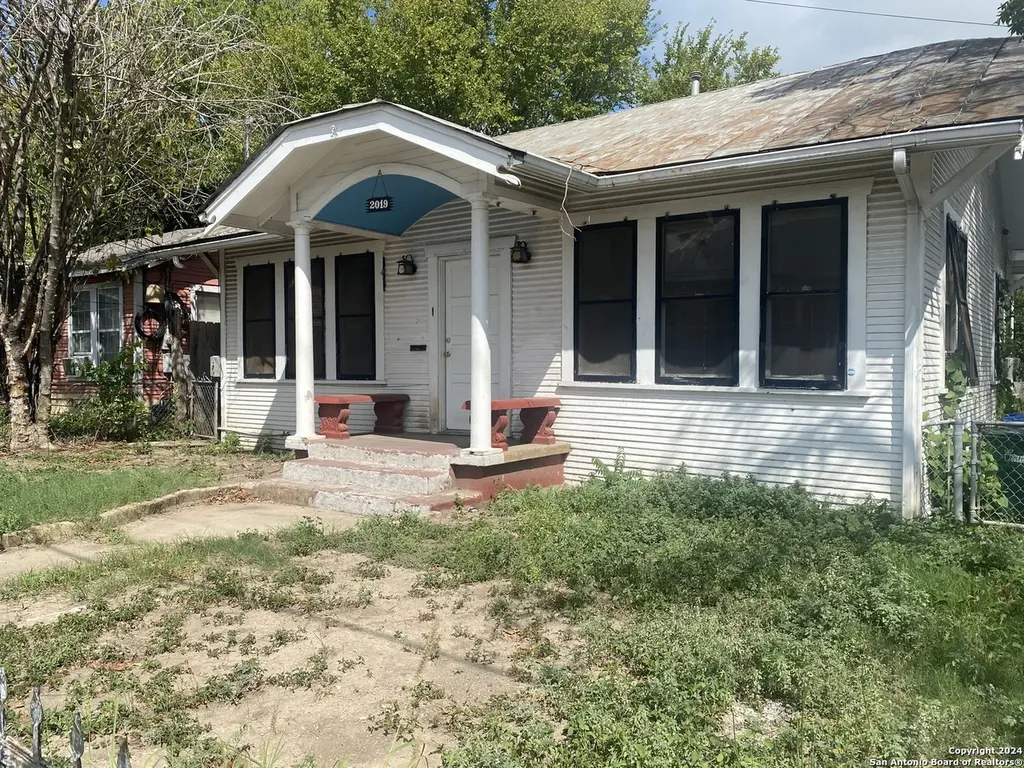
2019 Martin Luther King · San Antonio, TX
Flood risk 1/10 · Minimal
- FEMA flood zone
- X (unshaded)
- Chance of flooding over 30 yrs
- 0.0%
- Est. flood insurance / yr
- $507 – $1,088
Fire risk 1/10 · Minimal
- Est. fire insurance / yr
- $1,222 – $2,270
Heat risk 8/10 · Major
- Hot days now (above 108°F)
- 6 days/yr
- Hot days in 30 yrs
- 17 days/yr
Wind risk 8/10 · Major
- Chance of severe wind over 30 yrs
- 80.0%
Air-quality risk 2/10 · Minimal
- Unhealthy air days now
- 1 days/yr
- Unhealthy air days in 30 yrs
- 2 days/yr
Risk factors via First Street. Map © Google.
Why this score? — see what drove the D grade
The composite is a weighted blend of 9 inputs, each scored 0–100. Each bar is that input's sub-score; the figure is the points it added to the 100-point composite (weight × sub-score).
- Cash flow +9.3/30.0
- ARV discount +7.5/15.0
- Appreciation +5.7/10.0
- Rent growth +5.0/5.0
- Livability +4.0/5.0
- 1% rule +3.7/10.0
- DSCR +2.6/10.0
- Condition / age +2.5/5.0
- Schools +1.4/10.0
$159,500
🖨 Deal sheet 📄 Offer letter ✓ Due diligence
Listing remarks MLS
Great rental income opportunity awaits with this unique property featuring two homes on one lot! The front home boasts 3 bedrooms and 1 bath, complemented by a very large laundry room that offers potential for conversion into a second bathroom. With over 1,200 sq ft of living space in excellent condition, it includes a spacious driveway and a carport in the back for two cars. Both homes share one water meter, while the front home is equipped with window units for cooling. The back home is a cozy 1-bedroom, 1-bath retreat that serves as an excellent secondary income source. This property's rear unit is specifically designed for modern comfort and privacy.
Key facts
- Carport for two cars
- Two homes on one lot
- Large laundry room
Tags
Neighborhood map
What this means for you Summary
Snapshot
- This is a 2-bed/1.0-bath single-family listed at $160k.
Deal economics
- At list price, monthly cash flow is $-116 ($-1k/yr) — negative.
- To cash-flow at today's rent, offer at most $139k (12.9% below list).
- To meet the 1% rule (rent ≥ 1% of price), the offer needs to be $139k (12.6% below list).
- Recommended offer: $139k (12.9% below list) — sets the bar for cash-flow.
- Cap rate 5.4% vs local median 3.8% in San Antonio — top-decile yield for the area; either an underpriced asset or a hidden risk that comps aren't pricing in. Stress-test before assuming the spread holds.
Location & tenants
- Location reads 80/100 on livability (#31 in TX, #1,616 nationally) — a professional / high-income tenant draw. Strengths: amenities A+, commute A+, cost of living A+; Watch: schools C-, crime F.
- San Antonio ISD (urban): math 12% / reading 22% proficiency, ranked #805 of 826 in TX (top 98%) — low school quality limits family demand, transient renter base, plan for 1-2y turnover; 80% free/reduced lunch — lower-income household profile, screen leases tightly.
- Market conditions: Rents rising fast (+10.9%/yr); 99 active listings in the ZIP; 40 comparable units currently listed for rent nearby; rentals at typical pace (median 24d on market — plan ~3-4 weeks tenant-placement turnaround); lower-income renter base — watch delinquency; 8,308 units permitted in Bexar County in 2024 (2,506 in 5+ unit buildings).
- At $1,395/mo this rent would consume 47% of the median local household income ($36k/yr) (locally 470% of renters already pay >50% of income on rent) — very limited rent-growth headroom before tenants either downsize or default.
Forward outlook
- In year one you build about $3k of equity ($1k loan paydown + $2k appreciation (1.3% local appreciation)).
- Bexar County population projected at +50% by 2050 — long-run rental-demand tailwind backs the buy-and-hold thesis.
- By year 10, paydown + projected appreciation supports a ~$33k cash-out refi (75% LTV) — recoverable capital for the next deal without selling this one.
Negotiation context
- It's been on market 84 days — a 6% lower offer ($150k) is reasonable based on typical stale-listing flexibility.
- 4 sale attempts since 2y ago with the ask held roughly flat each time — persistent listings suggest the price (not the market) is what's stuck; bring a comps-based counter.
Risks & watch-outs
- Watch-outs: built in 1924 — expect roof / HVAC / electrical / plumbing capex.
- Climate carrying-cost: severe wind risk, 80% chance of damaging wind over 30y; extreme-heat days projected 6→17/yr by 2055 (HVAC capex compounding) — expect insurance premiums to compound above CPI over the hold.
Questions for the listing agent
- What do current leases actually rent for vs. the listed asking? Can we see a recent rent roll and the last 12 months of T-12 income?
- It's been on market 84 days. Have you received any prior offers? Is the seller open to a 13% concession, seller financing, or rate buy-down credit?
- Built in 1924 — when were the roof, HVAC, electrical panel, plumbing, and water heater last replaced?
- Why hasn't it sold? Are there any deal-killer items the seller is aware of (foundation, flood, title, zoning, code violations)?
- Is there a deadline driving the sale (1031 exchange, divorce, estate, relocation)? That informs how much negotiation room exists.
- Crime grade is F in this area — have there been break-ins, vandalism, or insurance claims at this property in the last 3 years? What carrier currently insures it and at what premium?
- The area grade is low — what's the realistic commute time and amenity access for the typical tenant pool here? Any planned neighborhood developments (good or bad) we should know about?
- What's the average days-on-market for RENTAL listings here right now (not sales)? A rising rental-DOM trend means longer vacancies and softer asking-rent achievability than the comps imply.
- What's the recent tenant-quality profile in this submarket — average credit score on applications, eviction rate, late-payment / NSF rate, and stable-employment percentage? A property-management company in the area should have these aggregated.
- How much new for-sale + rental construction is in the pipeline within 1–3 miles? Heavy new supply typically softens prices + rents 12–24 months out; constrained supply supports both.
Investment metrics
- 1% rule
- 0.87% ✗
- Cap rate
- 5.42%
- Cash-on-cash
- -3.13%
- DSCR
- 0.86
- GRM
- 9.5
CMA / ARV
- ARV (median comp)
- $332,887
- List price
- $159,500
- Delta
- -52.09%
- Verdict
- UNDERPRICED
- Comps
- 20 within 1.0 mi
Show comp detail 12 sales within ~0.75 mi
| Address | Dist | Beds/Ba | Sqft | Sold | Price | $/sf | Match |
|---|---|---|---|---|---|---|---|
| 515 South Grimes | 0.13mi | 3/2.0 (+1) | 1,155 (-4%) | 3mo | $239,000 | $207 | 77 |
| 1210 S Walters | 0.42mi | 3/1.0 (+1) | 1,203 (+0%) | 2mo | $75,000 | $62 | 74 |
| 2006 Virginia | 0.22mi | 3/1.0 (+1) | 1,098 (-8%) | 3mo | $169,000 | $154 | 68 |
| 411 S Gevers | 0.38mi | 3/2.0 (+1) | 1,147 (-4%) | 2mo | $210,000 | $183 | 65 |
| 229 Nelson Ave | 0.68mi | 2/2.0 | 1,200 (0%) | 3mo | $275,000 | $229 | 62 |
| 1410 Paso Hondo | 0.51mi | 3/2.0 (+1) | 1,219 (+2%) | 4mo | $159,000 | $130 | 61 |
| 2846 Wyoming St | 0.47mi | 3/2.0 (+1) | 1,255 (+5%) | 1mo | $185,000 | $147 | 61 |
| 231 Nelson | 0.67mi | 3/2.0 (+1) | 1,228 (+2%) | 3mo | $243,900 | $199 | 54 |
| 1109 Essex | 0.71mi | 3/2.0 (+1) | 1,226 (+2%) | 3mo | $160,000 | $131 | 52 |
| 1048 Gibbs | 0.71mi | 3/2.0 (+1) | 1,280 (+7%) | 1mo | $249,000 | $195 | 46 |
| 623 Belmont | 0.51mi | 3/2.0 (+1) | 1,355 (+13%) | 0mo | $230,000 | $170 | 46 |
| 2055 E Crockett St | 0.70mi | 3/1.0 (+1) | 1,054 (-12%) | 5mo | $120,000 | $114 | 38 |
Match score weights: distance 35% · size 25% · config 20% · recency 20%. Top-matched comps best support the ARV.
Projected returns pro-forma
1.34% appreciation · 8.0% rent growth · sell at horizon
- IRR
- 2.4%
- Equity multiple
- 1.13×
- Total profit
- $5,668
- Equity at exit
- $57,254
- IRR
- 9.9%
- Equity multiple
- 2.40×
- Total profit
- $62,554
- Equity at exit
- $78,301
Cash invested: $44,660 (down + closing). Projections, not guarantees.
Landlord ↔ Tenant lean methodology
- Overall (STATE)
- 87 Strongly Landlord-Friendly
- State Texas
- 87 Strongly Landlord-Friendly · R+5
- County
- — inherits STATE
- City
- — inherits STATE
ZIP-level market 78203
- Home prices YoY
- 0.5%
- Rents YoY
- 10.9%
- Active inventory
- 99
- Price-to-rent
- 9.5×
Monthly cashflow live
- Estimated rent
- $1,395 high interval (Pro) →
- Mortgage (P&I)
- −$836
- Tax from tax record
- −$315 /mo · $3,783/yr
- Insurance
- −$66
- HOA
- −$0
- Vacancy / Maint / Mgmt
- −$293
- Net cashflow
- $-116
Break-even live
UW: 25.0% down · 7.5% · 30yr · 1.5% tax · 5.0% vac · 8.0% maint · 8.0% mgmt
Financing live
Cash to close
- Down payment
- $39,875
- Closing costs
- $4,785
- Reserves months
- —
- Total cash needed
- —
Loan-product check · same deal, 3 products live
Conventional
25% down · 7.5% · 30yr
- Down + closing
- —
- Monthly P&I
- —
- Monthly cashflow
- —
- DSCR
- —
- Eligible?
- —
Personal DTI + credit; lowest rate.
DSCR
20% down · 8.5% · 30yr
- Down + closing
- —
- Monthly P&I
- —
- Monthly cashflow
- —
- DSCR
- —
- Eligible?
- —
No personal income docs; deal must DSCR.
Hard money
10% down · 12.0% · 12mo
- Down + closing
- —
- Monthly P&I
- —
- Monthly cashflow
- —
- DSCR
- —
- Eligible?
- —
Short-term bridge; refi at stabilization.
Rent comps 40 comps
| Address | Beds | Baths | Sqft | Rent | $/sqft | DOM | Units | Dist |
|---|---|---|---|---|---|---|---|---|
| 318 Ferguson Ave Unit 1 San Antonio, TX | 3.0 | 2.0 | 1450 | $1,550 | $1.07 | 4d | 1 | 0.11mi |
| 314 Maryland St Unit 102 San Antonio, TX | 2.0 | 2.5 | 1055 | $1,295 | $1.23 | 43d | 1 | 0.17mi |
| 227 S Grimes St Unit 202 San Antonio, TX | 3.0 | 2.5 | 1089 | $1,550 | $1.42 | 43d | 1 | 0.26mi |
| 1431 Aransas Ave San Antonio, TX | 3.0 | 1.0 | 1108 | $1,195 | $1.08 | 14d | 1 | 0.28mi |
| 125 Magendie St San Antonio, TX | 2.0 | 2.0 | 820 | $1,323 | $1.61 | 4d | 1 | 0.29mi |
| 420 Clark Ave San Antonio, TX | 2.0 | 1.0 | 756 | $1,295 | $1.71 | 17d | 1 | 0.35mi |
| 342 Vine St San Antonio, TX | 2.0 | 1.0 | 768 | $995 | $1.30 | 23d | 1 | 0.37mi |
| 342 Vine St Unit B San Antonio, TX | 2.0 | 1.0 | 768 | $875 | $1.14 | 43d | 1 | 0.37mi |
| 322 Vine St #102 San Antonio, TX | 3.0 | 2.5 | 1401 | $1,400 | $1.00 | 23d | 1 | 0.38mi |
| 143 Ranger Unit 101 San Antonio, TX | 3.0 | 2.0 | 876 | $1,099 | $1.25 | 2d | 1 | 0.41mi |
| 512 Cooper St San Antonio, TX | 2.0 | 1.0 | 1116 | $1,295 | $1.16 | 23d | 1 | 0.44mi |
| 521 S Polaris St San Antonio, TX | 3.0 | 1.0 | 1200 | $1,249 | $1.04 | 4d | 1 | 0.45mi |
| 610 Belmont San Antonio, TX | 2.0 | 1.0 | 1050 | $1,195 | $1.14 | 43d | 1 | 0.45mi |
| 147 Vine St San Antonio, TX | 3.0 | 3.0 | 1438 | $1,700 | $1.18 | 23d | 1 | 0.46mi |
| 308 Belmont San Antonio, TX | 1.0 | 1.0 | 700 | $850 | $1.21 | 23d | 1 | 0.49mi |
| 123 Dilworth St San Antonio, TX | 3.0 | 2.0 | 1384 | $1,900 | $1.37 | 43d | 1 | 0.52mi |
| 113 Dilworth St San Antonio, TX | 3.0 | 3.0 | 1383 | $1,850 | $1.34 | 23d | 1 | 0.54mi |
| 139 San Salvador Ave Unit 103 San Antonio, TX | 2.0 | 2.5 | 1245 | $1,490 | $1.20 | 14d | 1 | 0.54mi |
| 1435 Gibbs San Antonio, TX | 3.0 | 1.0 | 975 | $1,435 | $1.47 | 23d | 1 | 0.55mi |
| 1111 Gibbs San Antonio, TX | 3.0 | 2.0 | 1476 | $1,595 | $1.08 | 23d | 1 | 0.68mi |
| 1518 S Walters St Unit 102 San Antonio, TX | 3.0 | 2.5 | 1180 | $1,400 | $1.19 | 4d | 1 | 0.68mi |
| 618 Porter St San Antonio, TX | 1.0 | 1.0 | 1360 | $895 | $0.66 | 4d | 1 | 0.68mi |
| 1101 Gibbs San Antonio, TX | 3.0 | 1.0 | 1100 | $1,345 | $1.22 | 23d | 1 | 0.69mi |
| 1101 Gibbs San Antonio, TX | 3.0 | 1.0 | 1100 | $1,345 | $1.22 | 14d | 1 | 0.69mi |
| 706 Canton San Antonio, TX | 2.0 | 1.0 | 994 | $1,545 | $1.55 | 23d | 1 | 0.69mi |
| 1303 Essex St #102 San Antonio, TX | 3.0 | 2.5 | 1180 | $1,400 | $1.19 | 23d | 1 | 0.69mi |
| 639 Canton San Antonio, TX | 2.0 | 1.0 | 1008 | $1,295 | $1.28 | 43d | 1 | 0.72mi |
| 413 Nopal St Unit 102 San Antonio, TX | 2.0 | 1.0 | 743 | $1,450 | $1.95 | 2d | 1 | 0.74mi |
| 311 Spriggsdale Ave Unit 610 San Antonio, TX | 1.0 | 1.0 | 745 | $892 | $1.20 | 3d | 1 | 0.75mi |
| 311 Spriggsdale Ave Unit 710 San Antonio, TX | 2.0 | 2.0 | 890 | $981 | $1.10 | 3d | 1 | 0.75mi |
| 136 Nelson Ave San Antonio, TX | 3.0 | 1.0 | 1092 | $1,316 | $1.21 | 43d | 1 | 0.77mi |
| 1005 Essex St Unit 101 San Antonio, TX | 2.0 | 2.0 | 800 | $1,425 | $1.78 | 2d | 1 | 0.79mi |
| 1005 Essex St Unit 202 San Antonio, TX | 2.0 | 2.0 | 800 | $1,450 | $1.81 | 43d | 1 | 0.79mi |
| 746 Gulf San Antonio, TX | 2.0 | 1.0 | 744 | $975 | $1.31 | 14d | 1 | 0.80mi |
| 742 Gulf St Unit 746 San Antonio, TX | 2.0 | 1.0 | 744 | $975 | $1.31 | 12d | 1 | 0.81mi |
| 2818 E Houston St San Antonio, TX | 3.0 | 1.0 | 1184 | $1,495 | $1.26 | 14d | 1 | 0.82mi |
| 730 Aransas Ave Unit 3 San Antonio, TX | 2.0 | 1.0 | 800 | $975 | $1.22 | 43d | 1 | 0.84mi |
| 607 Gulf San Antonio, TX | 3.0 | 2.0 | 1482 | $1,395 | $0.94 | 23d | 1 | 0.84mi |
| 154 Ferris Ave San Antonio, TX | 3.0 | 2.0 | 1438 | $1,275 | $0.89 | 21d | 1 | 0.85mi |
| 154 Ferris Ave San Antonio, TX | 3.0 | 2.0 | 1438 | $1,499 | $1.04 | 43d | 1 | 0.85mi |
Listing history 24 events
-
2026-06-18days on market $159,500 Active 84 DOM
-
2026-06-17days on market $159,500 Active 83 DOM
-
2026-06-16days on market $159,500 Active 82 DOM
-
2026-06-15days on market $159,500 Active 81 DOM
-
2026-06-13days on market $159,500 Active 79 DOM
-
2026-06-09days on market $159,500 Active 75 DOM
-
2026-06-08days on market $159,500 Active 74 DOM
-
2026-06-07days on market $159,500 Active 73 DOM
-
2026-06-04days on market $159,500 Active 70 DOM
-
2026-06-03days on market $159,500 Active 69 DOM
-
2026-06-02days on market $159,500 Active 68 DOM
-
2026-06-01days on market $159,500 Active 67 DOM
-
2026-05-31days on market $159,500 Active 66 DOM
-
2026-04-14price $159,500 663-char remark
Show marketing remark (663 chars)
Great rental income opportunity awaits with this unique property featuring two homes on one lot! The front home boasts 3 bedrooms and 1 bath, complemented by a very large laundry room that offers potential for conversion into a second bathroom. With over 1,200 sq ft of living space in excellent condition, it includes a spacious driveway and a carport in the back for two cars. Both homes share one water meter, while the front home is equipped with window units for cooling. The back home is a cozy 1-bedroom, 1-bath retreat that serves as an excellent secondary income source. This property's rear unit is specifically designed for modern comfort and privacy.
-
2026-03-26$165,000 New 663-char remark
Show marketing remark (663 chars)
Great rental income opportunity awaits with this unique property featuring two homes on one lot! The front home boasts 3 bedrooms and 1 bath, complemented by a very large laundry room that offers potential for conversion into a second bathroom. With over 1,200 sq ft of living space in excellent condition, it includes a spacious driveway and a carport in the back for two cars. Both homes share one water meter, while the front home is equipped with window units for cooling. The back home is a cozy 1-bedroom, 1-bath retreat that serves as an excellent secondary income source. This property's rear unit is specifically designed for modern comfort and privacy.
-
2025-07-21historical
-
2025-04-01price $175,000
-
2025-04-01status Price Change
-
2025-03-27historical Active Option
-
2024-11-17price $180,000
-
2024-11-04status Back on Market
-
2024-11-02historical Active Option
-
2024-10-07$190,000 New
-
2005-01-26soldstatus
ⓘ Source: listings_history table (triggers on properties + properties_extension) + one-shot
backfill from property_details.listing_events for pre-trigger history.
Tax reassessment forecast TX · Resets to sale price
- Current annual tax
- $3,783 · $315/mo
- Projected year-2 tax
- $3,783 · $315/mo
- Expected delta
- $0/yr ($0/mo · 0.0%)
ⓘ Screening estimate from a state-policy table — verify with the county assessor before closing.
Climate risk First Street
- Flood 1/10 Low FEMA zone X (unshaded) · 0% chance over 30 yrs
- Wildfire 1/10 Low
- Heat 8/10 Severe 6 d/yr ≥108°F today · 17 d/yr by 30 yrs out
- Wind 8/10 Severe 80% chance of damaging wind over 30 yrs
- Air quality 2/10 Low 1 unhealthy d/yr today · 2 by 30 yrs out
Nearby sold comps map
Loading sold comps map…
Walkable amenities ~0.75 mi
Loading nearby amenities…
Taxation est. · year 1
- Rental income
- $16,735
- − Mortgage interest
- −$8,934
- − Property taxes
- −$3,783
- − Insurance
- −$798
- − Repairs & maintenance
- −$1,339
- − Management
- −$1,339
- − Depreciation
- −$4,640
- Taxable loss
- −$4,097
- Est. tax savings @ 24.0%
- +$983
- After-tax cash flow
- $-413/yr
For passive investors: Depreciation is non-cash, so a rental often shows a tax loss while cash-flowing — sheltering income. Rental losses are passive: they offset passive income freely, and up to $25,000/yr can offset ordinary (W-2) income if you actively participate and your MAGI is under $100k (phasing out to $0 by $150k); unused losses carry forward. On sale, claimed depreciation is recaptured at up to 25%, and gains may owe capital-gains tax (a 1031 exchange can defer both). Figures are a year-1 estimate at your 24.0% rate — not tax advice; consult a CPA.
Schools (NCES district)
- District
- San Antonio ISD
- NCES district ID
- 4838730
- Math proficiency
- 12% ▼ -21.00%
- Reading proficiency
- 22% ▼ -7.00%
- Median HH income
- $30,952
- Composite
- 13.57/100
- National rank
- #9512
- State rank
- #805 of 826 in TX
Livability — San Antonio
- Score
- 80/100
- State rank
- #31
- US rank
- #1616
Category grades
Schools grade is shown separately in the Schools card above.
Census & demographics
- Census place
- San Antonio, TX
- County
- Bexar County · 1,990,555 people
- City population
- 1,806,925
- Metro
- San Antonio-New Braunfels, TX
- Population (ZIP)
- 5,200
- Household income
- $35,536
- Rent vs Own
- Severe rent burden
- 470.0
Population outlook (Bexar County) Hauer SSP2
- Today (2025)
- 2,336,851 people
- By 2030
- 2,560,728 · +9.6%
- By 2040
- 3,020,569 · +29.3%
- By 2050
- 3,493,522 · +49.5%
- By 2075
- 4,668,459 · +99.8%
- By 2100
- 5,533,242 · +136.8%
Race, ethnicity, and origin ACS 2023
- Neighborhood character
- Predominantly Hispanic (84%)
- Race & ethnicity
- Hispanic / Latino 84% Two or more races 37% Black 8% White 7% Native American 1%
- Hispanic origin (detail)
- Mexican 67% Puerto Rican 3%
- Common ancestry
- Portuguese 2% Lithuanian 2%
- Foreign-born
- 18% · Canada
- Languages at home
- 53% English-only · Spanish 46%
Political lean MEDSL · Bexar
- 2024 margin
- Lean D (+9.8) · D 54.3% · R 44.6% · Other 1.1%
- 2008→2024 swing
- +4.2pp toward D · 2008: 5.6pp · 2024: 9.8pp
- All cycles
- 2024: D+9.8 2020: D+18.2 2016: D+13.5 2012: D+4.6 2008: D+5.6
Not yet ingested
- Civics
- —
Market trends
- HPI YoY
- ▲ 1.34%
- Current HPI
- 257.4183
- Rent YoY
- ▲ 10.86%
- Metro
- San Antonio-New Braunfels, TX
- State GDP YoY
- ▲ 3.95%
- F500 in state
- 110
Industry mix (Fortune 500 HQ in TX)
| Industry | F500 HQs | Revenue |
|---|---|---|
| Energy | 16 | $1,198B |
|
||
| Technology | 5 | $198B |
|
||
| Engineering / Construction | 4 | $72B |
|
||
| Energy Services | 3 | $60B |
|
||
| Utilities | 3 | $41B |
|
||
| Healthcare | 2 | $330B |
|
||
Price history
-16.1% since first listed11 events — show timeline
- 2026-04-14 Price Changed $159,500 LERA
- 2026-03-26 Listed $165,000 LERA
- 2025-07-21 Listing Removed — LERA
- 2025-04-01 Price Changed $175,000 LERA
- 2025-04-01 Relisted — LERA
- 2025-03-27 Contingent — LERA
- 2024-11-17 Price Changed $180,000 LERA
- 2024-11-04 Relisted — LERA
- 2024-11-02 Contingent — LERA
- 2024-10-07 Listed $190,000 LERA
- 2005-01-26 Sold (Public Records) — Public Records
Property tax history
+8.9%/yrLatest (2025): $3,783 · -2.5% YoY. Source: county tax records.
Cash-flow waterfall
monthlySold comps — $/sqft
last 12 mo · ≤1 miLoading sold comps…