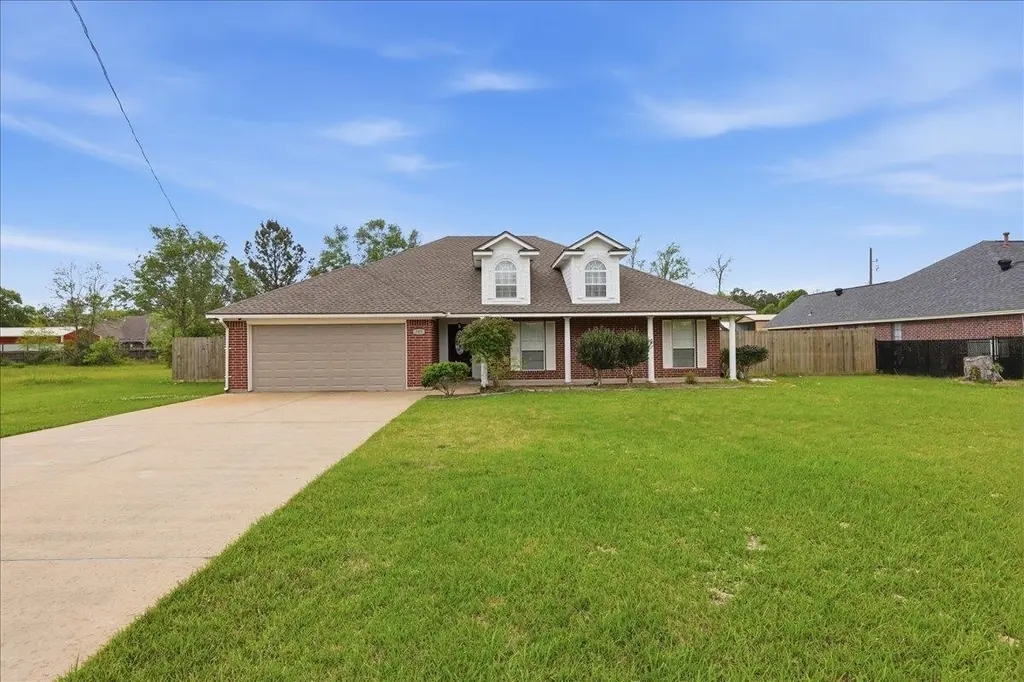
249 Country Ln · Lumberton, TX
Flood risk 4/10 · Minor
- FEMA flood zone
- X (unshaded)
- Chance of flooding over 30 yrs
- 0.2%
- Est. flood insurance / yr
- $507 – $1,088
Fire risk 4/10 · Minor
- Est. fire insurance / yr
- $1,222 – $2,270
Heat risk 9/10 · Severe
- Hot days now (above 111°F)
- 7 days/yr
- Hot days in 30 yrs
- 25 days/yr
Wind risk 9/10 · Severe
- Chance of severe wind over 30 yrs
- 99.0%
Air-quality risk 2/10 · Minimal
- Unhealthy air days now
- 1 days/yr
- Unhealthy air days in 30 yrs
- 1 days/yr
Risk factors via First Street. Map © Google.
Why this score? — see what drove the F grade
The composite is a weighted blend of 9 inputs, each scored 0–100. Each bar is that input's sub-score; the figure is the points it added to the 100-point composite (weight × sub-score).
- Cash flow +8.2/30.0
- ARV discount +7.4/15.0
- Schools +4.3/10.0
- Livability +3.8/5.0
- Rent growth +2.5/5.0
- Condition / age +2.5/5.0
- 1% rule +2.3/10.0
- DSCR +2.2/10.0
- Appreciation +0.0/10.0
$259,700
🖨 Deal sheet 📄 Offer letter ✓ Due diligence
Listing remarks MLS
Great house with a large backyard. Corner fireplace, large island in the kitchen.
Key facts
- Dining area
- Large yard
- Bay windows
Tags
Property features AI
Finance
- Financial info: Annual tax amount reported
Exterior
- Parking: Attached 2-car garage
- Utilities: Public water; Public sewer
- Home design: Single family residence; Residential property; One story
- Construction: Brick veneer construction; Composition roof; Slab foundation; Built in 2026
- Exterior features: Patio; Lot approximately 0.46 acres
Interior
- Kitchen: Dishwasher; Microwave; Refrigerator
- Flooring: Carpet
- Bathrooms: 2 full bathrooms
- Heating & cooling: Central heating (natural gas); Central air; Ceiling fan(s)
- Interior features: Pantry; Wood-burning fireplace
- Laundry & utility: Washer; Dryer
Neighborhood map
What this means for you Summary
Snapshot
- This is a 3-bed/2.0-bath single-family listed at $260k.
Deal economics
- At list price, monthly cash flow is $-247 ($-3k/yr) — negative.
- To cash-flow at today's rent, offer at most $216k (16.8% below list).
- To meet the 1% rule (rent ≥ 1% of price), the offer needs to be $190k (26.7% below list).
- Recommended offer: $190k (26.7% below list) — sets the bar for 1% rule.
- Cap rate 5.2% vs local median 3.2% in Lumberton — top-decile yield for the area; either an underpriced asset or a hidden risk that comps aren't pricing in. Stress-test before assuming the spread holds.
Location & tenants
- Location reads 75/100 on livability (#160 in TX, #4,326 nationally) — a middle-class / working-renter tenant base. Strengths: crime A+, employment A+, cost of living A+; Watch: amenities F, commute F.
- Lumberton ISD (suburban): math 48% / reading 50% proficiency, ranked #173 of 826 in TX (top 21%) — families likely to look elsewhere, expect single-tenant / working-renter base with shorter leases.
- Market conditions: 318 active listings in the ZIP; 7 comparable units currently listed for rent nearby; rentals at typical pace (median 23d on market — plan ~3-4 weeks tenant-placement turnaround); solid renter incomes; 358 units permitted in Hardin County in 2024 (0 in 5+ unit buildings).
Forward outlook
- Local home prices are declining (-3.0%/yr); year-one equity from $2k of loan paydown is wiped out by about $8k of value loss. Plan a longer hold.
Negotiation context
- Only 9 days on market — expect competitive offers; lowballing is unlikely to land.
- 2 sale attempts since 12y ago with the ask held roughly flat each time — persistent listings suggest the price (not the market) is what's stuck; bring a comps-based counter.
- Current owner paid $125k; list at $260k implies a 108% gain — meaningful room to come down on a strong offer.
Risks & watch-outs
- Climate carrying-cost: severe wind risk, 99% chance of damaging wind over 30y; extreme-heat days projected 7→25/yr by 2055 (HVAC capex compounding) — expect insurance premiums to compound above CPI over the hold.
Questions for the listing agent
- What do current leases actually rent for vs. the listed asking? Can we see a recent rent roll and the last 12 months of T-12 income?
- Is there a deadline driving the sale (1031 exchange, divorce, estate, relocation)? That informs how much negotiation room exists.
- The area grade is low — what's the realistic commute time and amenity access for the typical tenant pool here? Any planned neighborhood developments (good or bad) we should know about?
- What's the average days-on-market for RENTAL listings here right now (not sales)? A rising rental-DOM trend means longer vacancies and softer asking-rent achievability than the comps imply.
- What's the recent tenant-quality profile in this submarket — average credit score on applications, eviction rate, late-payment / NSF rate, and stable-employment percentage? A property-management company in the area should have these aggregated.
- How much new for-sale + rental construction is in the pipeline within 1–3 miles? Heavy new supply typically softens prices + rents 12–24 months out; constrained supply supports both.
Investment metrics
- 1% rule
- 0.73% ✗
- Cap rate
- 5.15%
- Cash-on-cash
- -4.08%
- DSCR
- 0.82
- GRM
- 11.4
CMA / ARV
- ARV (on-the-fly)
- $259,005
- Comps found
- 5
Show comp detail 5 sales within ~0.75 mi
| Address | Dist | Beds/Ba | Sqft | Sold | Price | $/sf | Match |
|---|---|---|---|---|---|---|---|
| 8125 Laurie Lane Ln | 0.21mi | 3/2.0 | 1,422 (-15%) | 2mo | $209,900 | $148 | 64 |
| 7621 Clearview Ln | 0.58mi | 3/2.0 | 1,774 (+6%) | 5mo | $295,000 | $166 | 59 |
| 200 Pinata Dr | 0.66mi | 3/2.0 | 1,653 (-1%) | 11mo | $175,000 | $106 | 59 |
| 7845 Laurie Ln | 0.29mi | 3/2.0 | 1,460 (-13%) | 11mo | $227,000 | $155 | 56 |
| 131 Winding Brook Dr | 0.72mi | 3/2.0 | 1,903 (+14%) | 20mo | $310,000 | $163 | 27 |
Match score weights: distance 35% · size 25% · config 20% · recency 20%. Top-matched comps best support the ARV.
Projected returns pro-forma
-3.0% appreciation · 3.0% rent growth · sell at horizon
- IRR
- -23.2%
- Equity multiple
- 0.20×
- Total profit
- $-57,823
- Equity at exit
- $38,722
- IRR
- -17.8%
- Equity multiple
- 0.03×
- Total profit
- $-70,614
- Equity at exit
- $22,454
Cash invested: $72,716 (down + closing). Projections, not guarantees.
Landlord ↔ Tenant lean methodology
- Overall (STATE)
- 87 Strongly Landlord-Friendly
- State Texas
- 87 Strongly Landlord-Friendly · R+5
- County
- — inherits STATE
- City
- — inherits STATE
ZIP-level market 77657
- Active inventory
- 318
- Price-to-rent
- 11.4×
Monthly cashflow live
- Estimated rent
- $1,903 high interval (Pro) →
- Mortgage (P&I)
- −$1,362
- Tax from tax record
- −$280 /mo · $3,366/yr
- Insurance
- −$108
- HOA
- −$0
- Vacancy / Maint / Mgmt
- −$400
- Net cashflow
- $-247
Break-even live
UW: 25.0% down · 7.5% · 30yr · 1.5% tax · 5.0% vac · 8.0% maint · 8.0% mgmt
Financing live
Cash to close
- Down payment
- $64,925
- Closing costs
- $7,791
- Reserves months
- —
- Total cash needed
- —
Loan-product check · same deal, 3 products live
Conventional
25% down · 7.5% · 30yr
- Down + closing
- —
- Monthly P&I
- —
- Monthly cashflow
- —
- DSCR
- —
- Eligible?
- —
Personal DTI + credit; lowest rate.
DSCR
20% down · 8.5% · 30yr
- Down + closing
- —
- Monthly P&I
- —
- Monthly cashflow
- —
- DSCR
- —
- Eligible?
- —
No personal income docs; deal must DSCR.
Hard money
10% down · 12.0% · 12mo
- Down + closing
- —
- Monthly P&I
- —
- Monthly cashflow
- —
- DSCR
- —
- Eligible?
- —
Short-term bridge; refi at stabilization.
Rent comps 7 comps
| Address | Beds | Baths | Sqft | Rent | $/sqft | DOM | Units | Dist |
|---|---|---|---|---|---|---|---|---|
| 187 S Lhs Dr Lumberton, TX | 1.0–3.0 | 1.0–2.0 | 1107 | $1,668 | $1.51 | 13d | 1 | 0.51mi |
| 110 Azaelia Dr Lumberton, TX | 2.0 | 2.0 | 1380 | $1,650 | $1.20 | 13d | 1 | 0.60mi |
| 357 S Main St Lumberton, TX | 3.0 | 2.0 | 1216 | $895 | $0.74 | 43d | 1 | 0.77mi |
| 40 Candlelight Ln Lumberton, TX | 3.0 | 2.0 | 1626 | $2,000 | $1.23 | 43d | 1 | 0.89mi |
| 40 Candlelight Ln Lumberton, TX | 3.0 | 2.0 | 1626 | $2,000 | $1.23 | 23d | 1 | 0.89mi |
| 200 Raider Ln Lumberton, TX | 3.0 | 2.0 | 1216 | $1,395 | $1.15 | 23d | 1 | 0.93mi |
| 8445 Harvard St Lumberton, TX | 3.0 | 2.5 | 1295 | $1,790 | $1.38 | 23d | 1 | 1.46mi |
Listing history 9 events
-
2026-05-01status Pending
-
2026-04-22$259,700 Active
-
2015-01-30soldstatus
-
2014-05-05soldstatus
-
2014-05-02soldstatus 81-char remark
Show marketing remark (81 chars)
Great house with a large backyard. Corner fireplace, large island in the kitchen.
-
2014-03-31$135,000 81-char remark
Show marketing remark (81 chars)
Great house with a large backyard. Corner fireplace, large island in the kitchen.
-
2011-11-08soldstatus
-
2003-07-09soldstatus $125,000
-
2001-07-19soldstatus $128,900
ⓘ Source: listings_history table (triggers on properties + properties_extension) + one-shot
backfill from property_details.listing_events for pre-trigger history.
Tax reassessment forecast TX · Resets to sale price
- Current annual tax
- $3,366 · $280/mo
- Projected year-2 tax
- $4,753 · $396/mo
- Expected delta
- +$1,387/yr (+$116/mo · 41.2%)
ⓘ Screening estimate from a state-policy table — verify with the county assessor before closing.
Climate risk First Street
- Flood 4/10 Moderate FEMA zone X (unshaded) · 20% chance over 30 yrs
- Wildfire 4/10 Moderate
- Heat 9/10 Extreme 7 d/yr ≥111°F today · 25 d/yr by 30 yrs out
- Wind 9/10 Extreme 99% chance of damaging wind over 30 yrs
- Air quality 2/10 Low 1 unhealthy d/yr today · 1 by 30 yrs out
Nearby sold comps map
Loading sold comps map…
Walkable amenities ~0.75 mi
Loading nearby amenities…
Taxation est. · year 1
- Rental income
- $22,837
- − Mortgage interest
- −$14,547
- − Property taxes
- −$3,366
- − Insurance
- −$1,298
- − Repairs & maintenance
- −$1,827
- − Management
- −$1,827
- − Depreciation
- −$7,555
- Taxable loss
- −$7,583
- Est. tax savings @ 24.0%
- +$1,820
- After-tax cash flow
- $-1,146/yr
For passive investors: Depreciation is non-cash, so a rental often shows a tax loss while cash-flowing — sheltering income. Rental losses are passive: they offset passive income freely, and up to $25,000/yr can offset ordinary (W-2) income if you actively participate and your MAGI is under $100k (phasing out to $0 by $150k); unused losses carry forward. On sale, claimed depreciation is recaptured at up to 25%, and gains may owe capital-gains tax (a 1031 exchange can defer both). Figures are a year-1 estimate at your 24.0% rate — not tax advice; consult a CPA.
Schools (NCES district)
- District
- Lumberton ISD
- NCES district ID
- 4813530
- Math proficiency
- 48% ▼ -5.00%
- Reading proficiency
- 50% ▼ -4.00%
- Median HH income
- $62,996
- Composite
- 43.2/100
- National rank
- #3063
- State rank
- #173 of 826 in TX
Livability — Lumberton
- Score
- 75/100
- State rank
- #160
- US rank
- #4326
Category grades
Schools grade is shown separately in the Schools card above.
Census & demographics
- Census place
- Lumberton, TX
- County
- Hardin County · 39,783 people
- City population
- 22,258
- Metro
- Beaumont-Port Arthur, TX
- Population (ZIP)
- 22,258
- Household income
- $95,718
- Rent vs Own
- Severe rent burden
- 147.0
Population outlook (Hardin County) Hauer SSP2
- Today (2025)
- 57,780 people
- By 2030
- 58,296 · +0.9%
- By 2040
- 58,421 · +1.1%
- By 2050
- 57,391 · -0.7%
- By 2075
- 53,132 · -8.0%
- By 2100
- 44,905 · -22.3%
Race, ethnicity, and origin ACS 2023
- Neighborhood character
- Predominantly White (89%)
- Race & ethnicity
- White 89% Hispanic / Latino 5% Two or more races 5%
- Hispanic origin (detail)
- Mexican 4%
- Common ancestry
- Lithuanian 10% Serbian 3% Slovak 2%
- Foreign-born
- 2% · Canada
- Languages at home
- 97% English-only · Spanish 2%
Political lean MEDSL · Hardin
- 2024 margin
- Solid R (+75.8) · D 11.9% · R 87.7%
- 2008→2024 swing
- -14.6pp toward R · 2008: -61.2pp · 2024: -75.8pp
- All cycles
- 2024: R+75.8 2020: R+73.8 2016: R+73.9 2012: R+67.6 2008: R+61.2
Not yet ingested
- Civics
- —
Market trends
- HPI YoY
- ▼ -160.56%
- Current HPI
- 156.2265
- Rent YoY
- —
- Metro
- Beaumont-Port Arthur, TX
- State GDP YoY
- ▲ 3.95%
- F500 in state
- 110
Industry mix (Fortune 500 HQ in TX)
| Industry | F500 HQs | Revenue |
|---|---|---|
| Energy | 16 | $1,198B |
|
||
| Technology | 5 | $198B |
|
||
| Engineering / Construction | 4 | $72B |
|
||
| Energy Services | 3 | $60B |
|
||
| Utilities | 3 | $41B |
|
||
| Healthcare | 2 | $330B |
|
||
Price history
+101.5% since first listed9 events — show timeline
- 2026-05-01 Pending — BBOR
- 2026-04-22 Listed $259,700 BBOR
- 2015-01-30 Sold (Public Records) — Public Records
- 2014-05-05 Sold (Public Records) — Public Records
- 2014-05-02 Sold (MLS) — BBOR
- 2014-03-31 Listed $135,000 BBOR
- 2011-11-08 Sold (Public Records) — Public Records
- 2003-07-09 Sold (Public Records) $125,000 Public Records
- 2001-07-19 Sold (Public Records) $128,900 Public Records
Property tax history
+3.2%/yrLatest (2025): $3,366 · -1.7% YoY. Source: county tax records.
Cash-flow waterfall
monthlySold comps — $/sqft
last 12 mo · ≤1 miLoading sold comps…