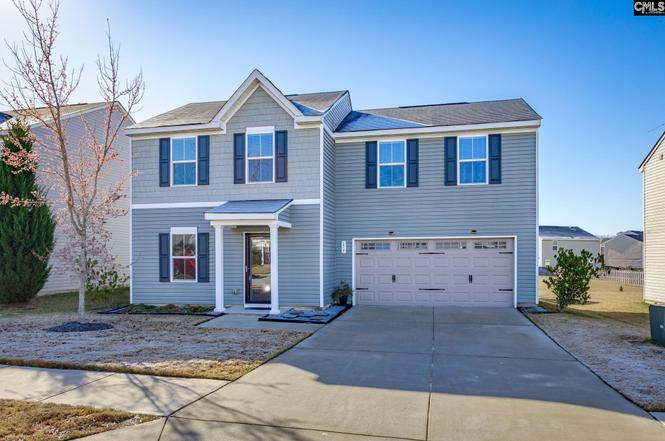
173 Council Loop · Columbia, SC
Flood risk 1/10 · Minimal
- FEMA flood zone
- X (unshaded)
- Chance of flooding over 30 yrs
- 0.0%
- Est. flood insurance / yr
- $507 – $1,088
Fire risk 3/10 · Minor
- Est. fire insurance / yr
- $783 – $1,453
Heat risk 7/10 · Major
- Hot days now (above 108°F)
- 7 days/yr
- Hot days in 30 yrs
- 16 days/yr
Wind risk 7/10 · Major
- Chance of severe wind over 30 yrs
- 76.0%
Air-quality risk 3/10 · Minor
- Unhealthy air days now
- 2 days/yr
- Unhealthy air days in 30 yrs
- 2 days/yr
Risk factors via First Street. Map © Google.
Why this score? — see what drove the D grade
The composite is a weighted blend of 9 inputs, each scored 0–100. Each bar is that input's sub-score; the figure is the points it added to the 100-point composite (weight × sub-score).
- Cash flow +15.0/30.0
- ARV discount +7.5/15.0
- DSCR +4.6/10.0
- Livability +3.9/5.0
- 1% rule +3.3/10.0
- Rent growth +3.0/5.0
- Schools +2.6/10.0
- Condition / age +2.5/5.0
- Appreciation +0.0/10.0
$264,000
🖨 Deal sheet (PDF) 📄 Offer letter ✓ Due diligence
Listing remarks
Close in time to enjoy the Community Pool! $4000.00 in closing cost assistance offered by the seller! 173 Council Loop in Columbia’s 29209 area is a 3 bedroom 2.5 bath well-maintained, modern single-family home built in 2019, offering approximately 1,920 square feet of comfortable living space with three bedrooms and two-and-a-half bathrooms. The home features a functional, family-friendly layout with generous room sizes, in Cream Puff condition, and a smooth flow between living areas, along with a screened porch ideal for relaxing or entertaining and a storage barn providing added convenience. Situated on a manageable lot in Southeast Columbia, the property offers easy access to shop
Key facts
- Screened porch
- Storage barn
- 5,662 sq ft lot
Tags
Property features AI
Finance
- Other: Cable TV available; Sidewalks in the community
- HOA & community: Community association with amenities including common area maintenance and a community pool
Exterior
- Parking: Attached garage on the main level with 2 garage spaces (2 total parking spaces)
- Utilities: Public sewer; Storm doors for added energy protection
- Home design: Two-story home
- Construction: Slab foundation
- Exterior features: Vinyl exterior; Paved road access; Public water
Interior
- Kitchen: Eat-in kitchen with island; Granite countertops; Painted cabinets; Laminate flooring in the kitchen; Free-standing smooth-surface range; Dishwasher; Disposal
- Bedrooms: Primary bedroom on the second floor with private bath, walk-in closet, tub/shower, ceiling fan, and carpeted floors; Second bedroom on the second floor with shared bath, ceiling fan, and private closet; Third bedroom on the second floor with shared bath, ceiling fan, and carpeted floors
- Flooring: Carpet in bedrooms and living areas; Laminate flooring in kitchen
- Bathrooms: Two full bathrooms; One half bathroom; No lower-level full baths
- Heating & cooling: Central cooling with zoned system; Central heating with heat pump on the first level and zoned controls
- Interior features: Ceiling fans throughout; Garage opener; Smoke detector; Tankless water heater; Gas water heater
- Laundry & utility: Washer and dryer located on the second floor
Neighborhood map
What this means for you Summary
Snapshot
- This is a 4-bed/3.0-bath single-family listed at $264k.
Deal economics
- At list price, monthly cash flow is $84 ($1k/yr) — positive.
- The deal already cash-flows at list — no discount required.
- To meet the 1% rule (rent ≥ 1% of price), the offer needs to be $218k (17.4% below list).
- Recommended offer: $218k (17.4% below list) — sets the bar for 1% rule.
- Cap rate 6.7% vs local median 5.1% in Columbia — top-decile yield for the area; either an underpriced asset or a hidden risk that comps aren't pricing in. Stress-test before assuming the spread holds.
Location & tenants
- Location reads 78/100 on livability (#18 in SC, #2,436 nationally) — a middle-class / working-renter tenant base. Strengths: amenities A+, commute A+, cost of living A+; Watch: employment D, crime F.
- Richland 01 (urban): math 26% / reading 36% proficiency, ranked #54 of 80 in SC (top 68%) — families likely to look elsewhere, expect single-tenant / working-renter base with shorter leases; 64% free/reduced lunch — lower-income household profile, screen leases tightly.
- Zoned schools: Annie Burnside Elementary (math 12% / reading 22%, grade F, #515 of 597 statewide, top 89%, 328 students, 100% FRL); Crayton Middle (math 48% / reading 64%, grade B-, #23 of 229 statewide, top 10%, 905 students, 100% FRL); A. C. Flora High (math 42% / reading 92%, grade B, #73 of 196 statewide, top 41%, 1,352 students, 100% FRL) — zoned schools average 100% FRL vs 64% district-wide (36 pts higher); higher-poverty schools than district average — tighter screening recommended.
- Zoned-school proficiency averages 47% at this address vs 31% district-wide (+16 pts) — the actual schools serving this property are materially stronger than the Richland 01 average implies; a family-tenant draw the district grade alone would hide.
- Market conditions: Rents rising (+2.1%/yr); 298 active listings in the ZIP; 15 comparable units currently listed for rent nearby; rentals at typical pace (median 16d on market — plan ~3-4 weeks tenant-placement turnaround); 3,472 units permitted in Richland County in 2024 (1,096 in 5+ unit buildings).
- This rent runs 45% of the median local income ($59k/yr) — at the standard rent-burdened threshold; future hikes will face affordability resistance.
Forward outlook
- Local home prices are declining (-3.0%/yr); year-one equity from $2k of loan paydown is wiped out by about $8k of value loss. Plan a longer hold.
- Richland County population projected at +30% by 2050 — long-run rental-demand tailwind backs the buy-and-hold thesis.
Negotiation context
- It's been on market 122 days — a 12% lower offer ($232k) is reasonable based on typical stale-listing flexibility.
Risks & watch-outs
- Climate carrying-cost: major wind risk, 76% chance of damaging wind over 30y; extreme-heat days projected 7→16/yr by 2055 (HVAC capex compounding) — expect insurance premiums to compound above CPI over the hold.
Questions for the listing agent
- It's been on market 122 days. Have you received any prior offers? Is the seller open to a 17% concession, seller financing, or rate buy-down credit?
- What does the HOA fee cover, when was the last increase, and are there any pending special assessments or reserve-fund shortfalls?
- Why hasn't it sold? Are there any deal-killer items the seller is aware of (foundation, flood, title, zoning, code violations)?
- Is there a deadline driving the sale (1031 exchange, divorce, estate, relocation)? That informs how much negotiation room exists.
- Schools are D-rated, which usually means shorter tenancies and higher turnover. Who's the typical renter profile here, and what's been the actual vacancy rate?
- Crime grade is F in this area — have there been break-ins, vandalism, or insurance claims at this property in the last 3 years? What carrier currently insures it and at what premium?
- The area grade is low — what's the realistic commute time and amenity access for the typical tenant pool here? Any planned neighborhood developments (good or bad) we should know about?
- What's the average days-on-market for RENTAL listings here right now (not sales)? A rising rental-DOM trend means longer vacancies and softer asking-rent achievability than the comps imply.
- What's the recent tenant-quality profile in this submarket — average credit score on applications, eviction rate, late-payment / NSF rate, and stable-employment percentage? A property-management company in the area should have these aggregated.
- How much new for-sale + rental construction is in the pipeline within 1–3 miles? Heavy new supply typically softens prices + rents 12–24 months out; constrained supply supports both.
Investment metrics
- 1% rule
- 0.83% ✗
- Cap rate
- 6.67%
- Cash-on-cash
- 1.36%
- DSCR
- 1.06
- GRM
- 10.1
CMA / ARV
No comps found within radius.
Projected returns pro-forma
-3.0% appreciation · 2.08% rent growth · sell at horizon
- IRR
- -15.1%
- Equity multiple
- 0.47×
- Total profit
- $-39,535
- Equity at exit
- $39,363
- IRR
- -8.1%
- Equity multiple
- 0.51×
- Total profit
- $-35,957
- Equity at exit
- $22,826
Cash invested: $73,920 (down + closing). Projections, not guarantees.
Landlord ↔ Tenant lean methodology
- Overall (STATE)
- 90 Strongly Landlord-Friendly
- State South Carolina
- 90 Strongly Landlord-Friendly · R+6
- County
- — inherits STATE
- City
- — inherits STATE
ZIP-level market 29209
- Rents YoY
- 2.1%
- Active inventory
- 298
- Price-to-rent
- 10.1×
Monthly cashflow live
- Estimated rent
- $2,182 high interval (Pro) →
- Mortgage (P&I)
- −$1,384
- Tax from tax record
- −$108 /mo · $1,291/yr
- Insurance
- −$110
- HOA
- −$38
- Vacancy / Maint / Mgmt
- −$458
- Net cashflow
- $84
Break-even live
Sensitivity live
| Price | -10% $233 | -5% $158 | +0% $84 | +5% $9 | +10% $-66 |
|---|---|---|---|---|---|
| Rent | -10% $-89 | -5% $-3 | +0% $84 | +5% $170 | +10% $256 |
| Rate | -1.0pp $217 | -0.5pp $151 | base $84 | +0.5pp $15 | +1.0pp $-54 |
UW: 25.0% down · 7.5% · 30yr · 1.5% tax · 5.0% vac · 8.0% maint · 8.0% mgmt
Financing live
Cash to close
- Down payment
- $66,000
- Closing costs
- $7,920
- Reserves months
- —
- Total cash needed
- —
Loan-product check · same deal, 3 products live
Conventional
25% down · 7.5% · 30yr
- Down + closing
- —
- Monthly P&I
- —
- Monthly cashflow
- —
- DSCR
- —
- Eligible?
- —
Personal DTI + credit; lowest rate.
DSCR
20% down · 8.5% · 30yr
- Down + closing
- —
- Monthly P&I
- —
- Monthly cashflow
- —
- DSCR
- —
- Eligible?
- —
No personal income docs; deal must DSCR.
Hard money
10% down · 12.0% · 12mo
- Down + closing
- —
- Monthly P&I
- —
- Monthly cashflow
- —
- DSCR
- —
- Eligible?
- —
Short-term bridge; refi at stabilization.
Rent comps 15 comps
| Address | Beds | Baths | Sqft | Rent | $/sqft | DOM | Units | Dist |
|---|---|---|---|---|---|---|---|---|
| 27 Blue Fescue Way Columbia, SC | 4.0 | 2.5 | 2075 | $2,283 | $1.10 | 25d | 1 | 0.22mi |
| 79 Blue Fescue Way Columbia, SC | 4.0 | 2.5 | 2075 | $2,295 | $1.11 | 13d | 1 | 0.25mi |
| 320 Beacons Field Rd Columbia, SC | 3.0 | 2.5 | 1663 | $2,183 | $1.31 | 16d | 1 | 0.25mi |
| 72 Blue Fescue Way Columbia, SC | 4.0 | 2.5 | 2075 | $2,233 | $1.08 | 16d | 1 | 0.26mi |
| 425 Red Poll Way Columbia, SC | 4.0 | 2.5 | 1783 | $2,133 | $1.20 | 25d | 1 | 0.31mi |
| 7743 Garners Ferry Rd Columbia, SC | 1.0–3.0 | 1.0–2.5 | 1045 | $2,534 | $2.42 | 4d | 19 | 0.31mi |
| 448 Red Poll Way Columbia, SC | 4.0 | 2.5 | 1783 | $2,183 | $1.22 | 25d | 1 | 0.34mi |
| 76 Springway Dr Columbia, SC | 3.0 | 2.5 | 1326 | $1,829 | $1.38 | 13d | 1 | 0.70mi |
| 1101 Hallbrook Dr Columbia, SC | 1.0–3.0 | 1.0–2.0 | 1050 | $1,229 | $1.17 | 16d | 1 | 0.92mi |
| 600 Greenlawn Dr Columbia, SC | 1.0–3.0 | 1.0–2.0 | 1017 | $1,830 | $1.80 | 4d | 25 | 1.06mi |
| 409 Levington Ln Columbia, SC | 3.0 | 2.5 | 1732 | $1,995 | $1.15 | 25d | 1 | 1.11mi |
| 156 Top Forest Dr Columbia, SC | 3.0 | 2.5 | 1855 | $2,500 | $1.35 | 25d | 1 | 1.31mi |
| 149 Moores Creek Dr Columbia, SC | 3.0 | 2.0 | 1600 | $2,069 | $1.29 | 16d | 1 | 1.39mi |
| 1727 Sandra Dr Columbia, SC | 4.0 | 2.5 | 1750 | $1,900 | $1.09 | 13d | 1 | 1.41mi |
| 1015 Walters Ln Columbia, SC | 3.0 | 2.0 | 1643 | $1,895 | $1.15 | 23d | 1 | 1.48mi |
HOA detail
- Monthly dues
- $38 · $456/yr
- Likely covers
- pool
Listing history 18 events
-
2026-06-21days on market $264,000 Active 122 DOM
-
2026-06-18days on market $264,000 Active 119 DOM
-
2026-06-17days on market $264,000 Active 118 DOM
-
2026-06-16days on market $264,000 Active 117 DOM
-
2026-06-15days on market $264,000 Active 116 DOM
-
2026-06-14days on market $264,000 Active 114 DOM
-
2026-06-10days on market $264,000 Active 111 DOM
-
2026-06-09days on market $264,000 Active 110 DOM
-
2026-06-08days on market $264,000 Active 109 DOM
-
2026-06-07days on market $264,000 Active 108 DOM
-
2026-06-03days on market $264,000 Active 104 DOM
-
2026-06-03days on market $264,000 Active 103 DOM
-
2026-06-01days on market $264,000 Active 102 DOM
-
2026-05-31days on market $264,000 Active 101 DOM
-
2026-04-30price $270,000
-
2026-03-30price $275,000
-
2026-03-04price $279,000
-
2026-01-22$285,000 Active
ⓘ Source: listings_history table (triggers on properties + properties_extension) + one-shot
backfill from property_details.listing_events for pre-trigger history.
Tax reassessment forecast SC · Resets to sale price
- Current annual tax
- $1,291 · $108/mo
- Projected year-2 tax
- $1,505 · $125/mo
- Expected delta
- +$214/yr (+$18/mo · 16.6%)
ⓘ Screening estimate from a state-policy table — verify with the county assessor before closing.
Climate risk First Street
- Flood 1/10 Low FEMA zone X (unshaded) · 0% chance over 30 yrs
- Wildfire 3/10 Moderate
- Heat 7/10 Severe 7 d/yr ≥108°F today · 16 d/yr by 30 yrs out
- Wind 7/10 Severe 76% chance of damaging wind over 30 yrs
- Air quality 3/10 Moderate 2 unhealthy d/yr today · 2 by 30 yrs out
Nearby sold comps map
Loading sold comps map…
Walkable amenities ~0.75 mi
Loading nearby amenities…
Taxation est. · year 1
- Rental income
- $26,182
- − Mortgage interest
- −$14,788
- − Property taxes
- −$1,291
- − Insurance
- −$1,320
- − Repairs & maintenance
- −$2,095
- − Management
- −$2,095
- − HOA
- −$456
- − Depreciation
- −$7,680
- Taxable loss
- −$3,542
- Est. tax savings @ 24.0%
- +$850
- After-tax cash flow
- $1,854/yr
For passive investors: Depreciation is non-cash, so a rental often shows a tax loss while cash-flowing — sheltering income. Rental losses are passive: they offset passive income freely, and up to $25,000/yr can offset ordinary (W-2) income if you actively participate and your MAGI is under $100k (phasing out to $0 by $150k); unused losses carry forward. On sale, claimed depreciation is recaptured at up to 25%, and gains may owe capital-gains tax (a 1031 exchange can defer both). Figures are a year-1 estimate at your 24.0% rate — not tax advice; consult a CPA.
Schools (NCES district)
- District
- Richland 01
- NCES district ID
- 4503360
- Math proficiency
- 26% ▼ -7.00%
- Reading proficiency
- 36% ▼ -5.00%
- Median HH income
- $38,931
- Composite
- 25.94/100
- National rank
- #7335
- State rank
- #54 of 80 in SC
Livability — Columbia
- Score
- 78/100
- State rank
- #18
- US rank
- #2436
Category grades
Schools grade is shown separately in the Schools card above.
Census & demographics
- Census place
- Columbia, SC
- County
- Richland County · 389,530 people
- City population
- 335,994
- Metro
- Columbia, SC
- Population (ZIP)
- 38,041
- Household income
- $58,772
- Rent vs Own
- Severe rent burden
- 1716.0
Population outlook (Richland County) Hauer SSP2
- Today (2025)
- 459,667 people
- By 2030
- 487,524 · +6.1%
- By 2040
- 542,035 · +17.9%
- By 2050
- 595,371 · +29.5%
- By 2075
- 732,998 · +59.5%
- By 2100
- 820,415 · +78.5%
Race, ethnicity, and origin ACS 2023
- Neighborhood character
- Diverse neighborhood (Simpson 0.62)
- Race & ethnicity
- Black 48% White 39% Two or more races 6% Hispanic / Latino 6% Asian 2%
- Hispanic origin (detail)
- Mexican 3% Puerto Rican 2%
- Common ancestry
- Slovak 2% Serbian 2% Italian 1%
- Foreign-born
- 6% · Canada, Jamaica
- Languages at home
- 93% English-only · Spanish 3% Arabic 1% Other Indo-European 1%
Political lean MEDSL · Richland
- 2024 margin
- Solid D (+34.6) · D 66.4% · R 31.8% · Other 1.8%
- 2008→2024 swing
- +5.7pp toward D · 2008: 28.9pp · 2024: 34.6pp
- All cycles
- 2024: D+34.6 2020: D+38.3 2016: D+32.9 2012: D+33.3 2008: D+28.9
Not yet ingested
- Civics
- —
Market trends
- HPI YoY
- ▼ -142.10%
- Current HPI
- 205.5679
- Rent YoY
- ▲ 2.08%
- Metro
- Columbia, SC
- State GDP YoY
- ▲ 4.51%
- F500 in state
- 2
Industry mix (Fortune 500 HQ in SC)
| Industry | F500 HQs | Revenue |
|---|---|---|
| Packaging | 1 | $7B |
|
||
Price history
-5.3% since first listed4 events — show timeline
- 2026-04-30 Price Changed $270,000 Consolidated MLS
- 2026-03-30 Price Changed $275,000 Consolidated MLS
- 2026-03-04 Price Changed $279,000 Consolidated MLS
- 2026-01-22 Listed $285,000 Consolidated MLS
Property tax history
-22.6%/yrLatest (2025): $1,291 · +3.7% YoY. Source: county tax records.
Cash-flow waterfall
monthlySold comps — $/sqft
last 12 mo · ≤1 miLoading sold comps…