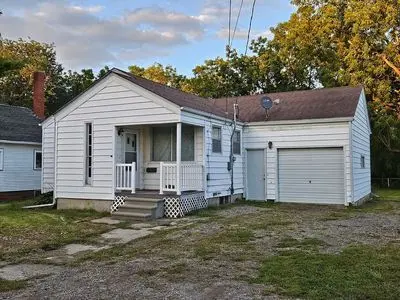
230 1st St S · Maynard, IA
Flood risk 1/10 · Minimal
- FEMA flood zone
- X (unshaded)
- Chance of flooding over 30 yrs
- 0.0%
- Est. flood insurance / yr
- $473 – $860
Fire risk 2/10 · Minimal
- Est. fire insurance / yr
- $902 – $1,676
Heat risk 2/10 · Minimal
- Hot days now (above 100°F)
- 7 days/yr
- Hot days in 30 yrs
- 15 days/yr
Wind risk 2/10 · Minimal
- Chance of severe wind over 30 yrs
- —
Air-quality risk 1/10 · Minimal
- Unhealthy air days now
- 0 days/yr
- Unhealthy air days in 30 yrs
- 0 days/yr
Risk factors via First Street. Map © Google.
Why this score? — see what drove the C grade
The composite is a weighted blend of 9 inputs, each scored 0–100. Each bar is that input's sub-score; the figure is the points it added to the 100-point composite (weight × sub-score).
- Cash flow +19.9/30.0
- Appreciation +7.2/10.0
- DSCR +6.3/10.0
- Schools +5.7/10.0
- 1% rule +5.1/10.0
- ARV discount +4.6/15.0
- Livability +3.4/5.0
- Rent growth +2.5/5.0
- Condition / age +2.5/5.0
$85,000
🖨 Deal sheet (PDF) 📄 Offer letter ✓ Due diligence
Listing remarks MLS
Very nice 2 bedroom home in Maynard. The main floor has kitchen, large living room, bathroom, a large bedroom and a second bedroom that also has laundry hookups. The basement is unfinished but could easily be finished, adding a couple of rooms. There is a 1 car attached garage, a nice patio area out back and a large fenced-in backyard and fenced garden area. Many perennial beds and a black raspberry patch at east end of garden.
Key facts
- Forced heat
- Move in ready
- Central air
Tags
Neighborhood map
What this means for you Summary
Snapshot
- This is a 2-bed/1.0-bath single-family listed at $85k.
Deal economics
- At list price, monthly cash flow is $102 ($1k/yr) — positive.
- The deal already cash-flows at list — no discount required.
- Meets the 1% rule at list price ($858 rent vs $85k).
- Recommended offer: $82k (3.0% below list) — sets the bar for market timing.
Location & tenants
- Location reads 67/100 on livability (#485 in IA) — a middle-class / working-renter tenant base. Strengths: cost of living A+, housing A+, schools A-; Watch: employment D, amenities F, commute F.
- West Central Community School District (rural): math 65% / reading 65% proficiency, ranked #231 of 330 in IA (top 70%) — acceptable for families but not a draw, mixed tenant base, ~2y average lease.
- Market conditions: 4 active listings in the ZIP; 8 units permitted in Fayette County in 2024 (0 in 5+ unit buildings).
Forward outlook
- In year one you build about $4k of equity ($588 loan paydown + $4k appreciation (4.5% local appreciation)).
- Fayette County population projected at -15% by 2050 — secular population decline; favor cash flow + early exit over multi-decade hold.
- At projected returns (4.5% appreciation + 3.0% rent growth), your $24k cash investment doubles in ~4 years — after that, you're playing with house money.
- By year 8, paydown + projected appreciation supports a ~$33k cash-out refi (75% LTV) — recoverable capital for the next deal without selling this one.
Negotiation context
- It's been on market 38 days — a 3% lower offer ($82k) is reasonable based on typical stale-listing flexibility.
- 2 sale attempts since 7y ago; this cycle's ask has dropped $5k (6%) from the opening price — seller is motivated, your offer sets the floor, not the list.
- Current owner paid $65k; 31% above their basis — modest negotiation headroom, anchor on the comps not their cost.
Risks & watch-outs
- Watch-outs: built in 1959 — expect roof / HVAC / electrical / plumbing capex.
Questions for the listing agent
- It's been on market 38 days. Have you received any prior offers? Is the seller open to a 3% concession, seller financing, or rate buy-down credit?
- Built in 1959 — when were the roof, HVAC, electrical panel, plumbing, and water heater last replaced?
- Is there a deadline driving the sale (1031 exchange, divorce, estate, relocation)? That informs how much negotiation room exists.
- Schools are A-rated — typically a magnet for longer-tenancy family renters. What's the average tenant stay here, and is there a school-zone premium baked into asking?
- What's the average days-on-market for RENTAL listings here right now (not sales)? A rising rental-DOM trend means longer vacancies and softer asking-rent achievability than the comps imply.
- What's the recent tenant-quality profile in this submarket — average credit score on applications, eviction rate, late-payment / NSF rate, and stable-employment percentage? A property-management company in the area should have these aggregated.
- How much new for-sale + rental construction is in the pipeline within 1–3 miles? Heavy new supply typically softens prices + rents 12–24 months out; constrained supply supports both.
Investment metrics
- 1% rule
- 1.01% ✓
- Cap rate
- 7.74%
- Cash-on-cash
- 5.17%
- DSCR
- 1.23
- GRM
- 8.3
CMA / ARV
- ARV (on-the-fly)
- $79,872
- Comps found
- 3
Show comp detail 3 sales within ~0.75 mi
| Address | Dist | Beds/Ba | Sqft | Sold | Price | $/sf | Match |
|---|---|---|---|---|---|---|---|
| 305 3rd St St N | 0.35mi | 2/1.0 | 768 (-8%) | 1mo | $74,000 | $96 | 70 |
| 135 2nd St. St S | 0.12mi | 2/1.0 | 940 (+13%) | 14mo | $165,000 | $176 | 61 |
| 140 N 8th St | 0.53mi | 2/1.0 | 952 (+14%) | 6mo | $64,500 | $68 | 46 |
Match score weights: distance 35% · size 25% · config 20% · recency 20%. Top-matched comps best support the ARV.
Projected returns pro-forma
4.46% appreciation · 3.0% rent growth · sell at horizon
- IRR
- 16.0%
- Equity multiple
- 1.99×
- Total profit
- $23,509
- Equity at exit
- $45,387
- IRR
- 16.7%
- Equity multiple
- 3.81×
- Total profit
- $66,769
- Equity at exit
- $76,123
Cash invested: $23,800 (down + closing). Projections, not guarantees.
Landlord ↔ Tenant lean methodology
- Overall (STATE)
- 83 Strongly Landlord-Friendly
- State Iowa
- 83 Strongly Landlord-Friendly · R+6
- County
- — inherits STATE
- City
- — inherits STATE
ZIP-level market 50655
- Home prices YoY
- 3.2%
- Active inventory
- 4
- Price-to-rent
- 8.3×
Monthly cashflow live
- Estimated rent
- $858 medium interval (Pro) →
- Mortgage (P&I)
- −$446
- Tax from tax record
- −$94 /mo · $1,132/yr
- Insurance
- −$35
- HOA
- −$0
- Vacancy / Maint / Mgmt
- −$180
- Net cashflow
- $102
Break-even live
Sensitivity live
| Price | -10% $151 | -5% $127 | +0% $102 | +5% $78 | +10% $54 |
|---|---|---|---|---|---|
| Rent | -10% $35 | -5% $69 | +0% $102 | +5% $136 | +10% $170 |
| Rate | -1.0pp $145 | -0.5pp $124 | base $102 | +0.5pp $80 | +1.0pp $58 |
UW: 25.0% down · 7.5% · 30yr · 1.5% tax · 5.0% vac · 8.0% maint · 8.0% mgmt
Financing live
Cash to close
- Down payment
- $21,250
- Closing costs
- $2,550
- Reserves months
- —
- Total cash needed
- —
Loan-product check · same deal, 3 products live
Conventional
25% down · 7.5% · 30yr
- Down + closing
- —
- Monthly P&I
- —
- Monthly cashflow
- —
- DSCR
- —
- Eligible?
- —
Personal DTI + credit; lowest rate.
DSCR
20% down · 8.5% · 30yr
- Down + closing
- —
- Monthly P&I
- —
- Monthly cashflow
- —
- DSCR
- —
- Eligible?
- —
No personal income docs; deal must DSCR.
Hard money
10% down · 12.0% · 12mo
- Down + closing
- —
- Monthly P&I
- —
- Monthly cashflow
- —
- DSCR
- —
- Eligible?
- —
Short-term bridge; refi at stabilization.
Listing history 24 events
-
2026-06-19days on market $85,000 Active 38 DOM
-
2026-06-18days on market $85,000 Active 37 DOM
-
2026-06-17days on market $85,000 Active 36 DOM
-
2026-06-16days on market $85,000 Active 35 DOM
-
2026-06-15days on market $85,000 Active 34 DOM
-
2026-06-14days on market $85,000 Active 32 DOM
-
2026-06-13days on market $85,000 Active 31 DOM
-
2026-06-10days on market $85,000 Active 29 DOM
-
2026-06-09days on market $85,000 Active 28 DOM
-
2026-06-08days on market $85,000 Active 27 DOM
-
2026-06-07days on market $85,000 Active 26 DOM
-
2026-06-05days on market $85,000 Active 23 DOM
-
2026-06-02days on market $85,000 Active 21 DOM
-
2026-06-01days on market $85,000 Active 20 DOM
-
2026-05-31days on market $85,000 Active 19 DOM
-
2026-05-30days on market $85,000 Active 18 DOM
-
2026-05-13price $85,000 246-char remark
-
2026-05-12$90,000 Active 246-char remark
-
2022-07-25soldstatus $65,000
-
2019-05-29soldstatus $52,000 431-char remark
Show marketing remark (431 chars)
Very nice 2 bedroom home in Maynard. The main floor has kitchen, large living room, bathroom, a large bedroom and a second bedroom that also has laundry hookups. The basement is unfinished but could easily be finished, adding a couple of rooms. There is a 1 car attached garage, a nice patio area out back and a large fenced-in backyard and fenced garden area. Many perennial beds and a black raspberry patch at east end of garden.
-
2019-01-05$59,000 431-char remark
Show marketing remark (431 chars)
Very nice 2 bedroom home in Maynard. The main floor has kitchen, large living room, bathroom, a large bedroom and a second bedroom that also has laundry hookups. The basement is unfinished but could easily be finished, adding a couple of rooms. There is a 1 car attached garage, a nice patio area out back and a large fenced-in backyard and fenced garden area. Many perennial beds and a black raspberry patch at east end of garden.
-
2014-12-17soldstatus $49,000
-
2013-06-12soldstatus $40,000
-
2007-03-05soldstatus $31,000
ⓘ Source: listings_history table (triggers on properties + properties_extension) + one-shot
backfill from property_details.listing_events for pre-trigger history.
Tax reassessment forecast IA · Partial reset (capped growth)
- Current annual tax
- $1,132 · $94/mo
- Projected year-2 tax
- $1,233 · $103/mo
- Expected delta
- +$101/yr (+$8/mo · 8.9%)
ⓘ Screening estimate from a state-policy table — verify with the county assessor before closing.
Climate risk First Street
- Flood 1/10 Low FEMA zone X (unshaded) · 0% chance over 30 yrs
- Wildfire 2/10 Low
- Heat 2/10 Low 7 d/yr ≥100°F today · 15 d/yr by 30 yrs out
- Wind 2/10 Low
- Air quality 1/10 Low 0 unhealthy d/yr today · 0 by 30 yrs out
Nearby sold comps map
Loading sold comps map…
Walkable amenities ~0.75 mi
Loading nearby amenities…
Taxation est. · year 1
- Rental income
- $10,298
- − Mortgage interest
- −$4,761
- − Property taxes
- −$1,132
- − Insurance
- −$425
- − Repairs & maintenance
- −$824
- − Management
- −$824
- − Depreciation
- −$2,473
- Taxable loss
- −$140
- Est. tax savings @ 24.0%
- +$34
- After-tax cash flow
- $1,263/yr
For passive investors: Depreciation is non-cash, so a rental often shows a tax loss while cash-flowing — sheltering income. Rental losses are passive: they offset passive income freely, and up to $25,000/yr can offset ordinary (W-2) income if you actively participate and your MAGI is under $100k (phasing out to $0 by $150k); unused losses carry forward. On sale, claimed depreciation is recaptured at up to 25%, and gains may owe capital-gains tax (a 1031 exchange can defer both). Figures are a year-1 estimate at your 24.0% rate — not tax advice; consult a CPA.
Schools (NCES district)
- District
- West Central Community School District
- NCES district ID
- 1930870
- Math proficiency
- 65% ▼ -15.00%
- Reading proficiency
- 65% ▼ -5.00%
- Median HH income
- $52,875
- Composite
- 56.9/100
- National rank
- #2381
- State rank
- #231 of 330 in IA
Livability — Maynard
- Score
- 67/100
- State rank
- #485
- US rank
- #10807
Category grades
Schools grade is shown separately in the Schools card above.
Census & demographics
- Census place
- Maynard, IA
- Population (ZIP)
- 694
Population outlook (Fayette County) Hauer SSP2
- Today (2025)
- 19,299 people
- By 2030
- 18,701 · -3.1%
- By 2040
- 17,469 · -9.5%
- By 2050
- 16,389 · -15.1%
- By 2075
- 15,156 · -21.5%
- By 2100
- 14,214 · -26.3%
Race, ethnicity, and origin ACS 2023
- Neighborhood character
- Predominantly White (96%)
- Race & ethnicity
- White 96% Hispanic / Latino 2% Two or more races 1%
- Common ancestry
- Portuguese 4% Lithuanian 2% Scottish 2%
- Foreign-born
- 1%
Political lean MEDSL · Fayette
- 2024 margin
- Solid R (+30.5) · D 34.0% · R 64.4% · Other 1.6%
- 2008→2024 swing
- -47.1pp toward R · 2008: 16.6pp · 2024: -30.5pp
- All cycles
- 2024: R+30.5 2020: R+22.7 2016: R+19.6 2012: D+11.9 2008: D+16.6
Not yet ingested
- Civics
- —
Market trends
- HPI YoY
- ▲ 4.46%
- Current HPI
- 145.4283
- Rent YoY
- —
- Metro
- —
- State GDP YoY
- ▲ 2.48%
- F500 in state
- 4
Industry mix (Fortune 500 HQ in IA)
| Industry | F500 HQs | Revenue |
|---|---|---|
| Financial Services | 1 | $16B |
|
||
| Retail / Convenience | 1 | $15B |
|
||
Price history
+174.2% since first listed8 events — show timeline
- 2026-05-13 Price Changed $85,000 FSBO.com
- 2026-05-12 Listed $90,000 FSBO.com
- 2022-07-25 Sold (Public Records) $65,000 Public Records
- 2019-05-29 Sold (MLS) $52,000 NEIRBR as distributed by MLS GRID
- 2019-01-05 Listed $59,000 NEIRBR as distributed by MLS GRID
- 2014-12-17 Sold (Public Records) $49,000 Public Records
- 2013-06-12 Sold (Public Records) $40,000 Public Records
- 2007-03-05 Sold (Public Records) $31,000 Public Records
Property tax history
+6.0%/yrLatest (2025): $1,132 · +5.0% YoY. Source: county tax records.
Cash-flow waterfall
monthlySold comps — $/sqft
last 12 mo · ≤1 miLoading sold comps…