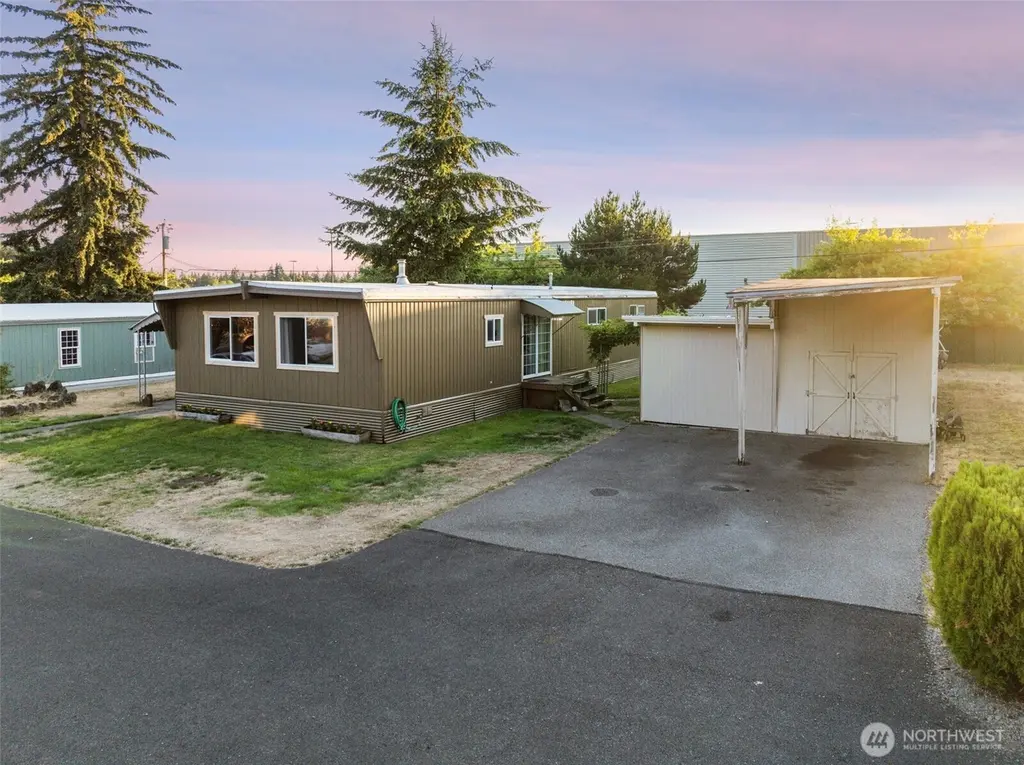
8510 Martin Way E #25 · Lacey, WA
Flood risk 1/10 · Minimal
- FEMA flood zone
- X (unshaded)
- Chance of flooding over 30 yrs
- 0.0%
- Est. flood insurance / yr
- $507 – $1,088
Fire risk 3/10 · Minor
- Est. fire insurance / yr
- $604 – $1,122
Heat risk 3/10 · Minor
- Hot days now (above 88°F)
- 6 days/yr
- Hot days in 30 yrs
- 12 days/yr
Wind risk 1/10 · Minimal
- Chance of severe wind over 30 yrs
- —
Air-quality risk 6/10 · Moderate
- Unhealthy air days now
- 7 days/yr
- Unhealthy air days in 30 yrs
- 8 days/yr
Risk factors via First Street. Map © Google.
Why this score? — see what drove the A- grade
The composite is a weighted blend of 9 inputs, each scored 0–100. Each bar is that input's sub-score; the figure is the points it added to the 100-point composite (weight × sub-score).
- Cash flow +30.0/30.0
- ARV discount +15.0/15.0
- 1% rule +10.0/10.0
- DSCR +10.0/10.0
- Schools +5.1/10.0
- Livability +4.2/5.0
- Rent growth +3.4/5.0
- Condition / age +2.5/5.0
- Appreciation +0.0/10.0
$99,000
🖨 Deal sheet 📄 Offer letter ✓ Due diligence
Listing remarks
Beautifully updated double-wide home in peaceful Lacey! Nestled on the largest lot in the park, this well-cared-for property features an open layout with spacious living and dining areas. The kitchen boasts generous storage and new butcher-block counters—perfect for everyday cooking or hosting. The primary suite offers an en-suite bath for added comfort and privacy. Lots of updating done and now just needs your finishing touches Step outside to a covered deck ideal for relaxing or entertaining, plus a large shop ready for your projects and hobbies. Wide ramp and entry door for easy access. Conveniently close to shopping, dining, and parks, and perfectly situated between Seattle and Po
Key facts
- Covered deck
- Double-wide home
- Open layout
Tags
Neighborhood map
What this means for you Summary
Snapshot
- This is a 3-bed/2.0-bath manufactured listed at $99k.
Deal economics
- At list price, monthly cash flow is $1k ($15k/yr) — positive.
- The deal already cash-flows at list — no discount required.
- Meets the 1% rule at list price ($2k rent vs $99k).
- Recommended offer: $87k (12.0% below list) — sets the bar for market timing.
- Cap rate 21.3% vs local median 3.0% in Lacey — top-decile yield for the area; either an underpriced asset or a hidden risk that comps aren't pricing in. Stress-test before assuming the spread holds.
Location & tenants
- Location reads 85/100 on livability (#33 in WA, #581 nationally) — a professional / high-income tenant draw. Strengths: amenities A+, commute A+, housing A+; Watch: cost of living D+.
- North Thurston Public Schools (suburban): math 51% / reading 62% proficiency, ranked #80 of 291 in WA (top 28%) — acceptable for families but not a draw, mixed tenant base, ~2y average lease.
- Market conditions: Rents rising (+3.8%/yr); 218 active listings in the ZIP; 24 comparable units currently listed for rent nearby; rentals at typical pace (median 21d on market — plan ~3-4 weeks tenant-placement turnaround); solid renter incomes; 1,222 units permitted in Thurston County in 2024 (508 in 5+ unit buildings).
Forward outlook
- Local home prices are declining (-3.0%/yr); year-one equity from $684 of loan paydown is wiped out by about $3k of value loss. Plan a longer hold.
- Thurston County population projected at +27% by 2050 — long-run rental-demand tailwind backs the buy-and-hold thesis.
- At projected returns (-3.0% appreciation + 3.8% rent growth), your $28k cash investment doubles in ~3 years — after that, you're playing with house money.
Negotiation context
- It's been on market 217 days — a 12% lower offer ($87k) is reasonable based on typical stale-listing flexibility.
Questions for the listing agent
- It's been on market 217 days. Have you received any prior offers? Is the seller open to a 12% concession, seller financing, or rate buy-down credit?
- Built in 1968 — when were the roof, HVAC, electrical panel, plumbing, and water heater last replaced?
- Why hasn't it sold? Are there any deal-killer items the seller is aware of (foundation, flood, title, zoning, code violations)?
- Is there a deadline driving the sale (1031 exchange, divorce, estate, relocation)? That informs how much negotiation room exists.
- Schools are B-rated — typically a magnet for longer-tenancy family renters. What's the average tenant stay here, and is there a school-zone premium baked into asking?
- What's the average days-on-market for RENTAL listings here right now (not sales)? A rising rental-DOM trend means longer vacancies and softer asking-rent achievability than the comps imply.
- What's the recent tenant-quality profile in this submarket — average credit score on applications, eviction rate, late-payment / NSF rate, and stable-employment percentage? A property-management company in the area should have these aggregated.
- How much new for-sale + rental construction is in the pipeline within 1–3 miles? Heavy new supply typically softens prices + rents 12–24 months out; constrained supply supports both.
Investment metrics
- 1% rule
- 2.32% ✓
- Cap rate
- 21.26%
- Cash-on-cash
- 53.47%
- DSCR
- 3.38
- GRM
- 3.6
CMA / ARV
- ARV (median comp)
- $123,501
- List price
- $99,000
- Delta
- -19.84%
- Verdict
- UNDERPRICED
- Comps
- 3 within 1.0 mi
Projected returns pro-forma
-3.0% appreciation · 3.75% rent growth · sell at horizon
- IRR
- 52.3%
- Equity multiple
- 3.32×
- Total profit
- $64,340
- Equity at exit
- $14,761
- IRR
- 57.9%
- Equity multiple
- 6.93×
- Total profit
- $164,489
- Equity at exit
- $8,560
Cash invested: $27,720 (down + closing). Projections, not guarantees.
Landlord ↔ Tenant lean methodology
- Overall (STATE)
- 28 Tenant-Leaning
- State Washington
- 28 Tenant-Leaning · D+8
- County
- — inherits STATE
- City
- — inherits STATE
ZIP-level market 98516
- Rents YoY
- 3.8%
- Active inventory
- 218
- Price-to-rent
- 3.6×
Monthly cashflow live
- Estimated rent
- $2,300 high interval (Pro) →
- Mortgage (P&I)
- −$519
- Tax from tax record
- −$22 /mo · $263/yr
- Insurance
- −$41
- HOA
- −$0
- Vacancy / Maint / Mgmt
- −$483
- Net cashflow
- $1,235
Break-even live
UW: 25.0% down · 7.5% · 30yr · 1.5% tax · 5.0% vac · 8.0% maint · 8.0% mgmt
Financing live
Cash to close
- Down payment
- $24,750
- Closing costs
- $2,970
- Reserves months
- —
- Total cash needed
- —
Loan-product check · same deal, 3 products live
Conventional
25% down · 7.5% · 30yr
- Down + closing
- —
- Monthly P&I
- —
- Monthly cashflow
- —
- DSCR
- —
- Eligible?
- —
Personal DTI + credit; lowest rate.
DSCR
20% down · 8.5% · 30yr
- Down + closing
- —
- Monthly P&I
- —
- Monthly cashflow
- —
- DSCR
- —
- Eligible?
- —
No personal income docs; deal must DSCR.
Hard money
10% down · 12.0% · 12mo
- Down + closing
- —
- Monthly P&I
- —
- Monthly cashflow
- —
- DSCR
- —
- Eligible?
- —
Short-term bridge; refi at stabilization.
Rent comps 24 comps
| Address | Beds | Baths | Sqft | Rent | $/sqft | DOM | Units | Dist |
|---|---|---|---|---|---|---|---|---|
| 1404 Brittany Ln NE Lacey, WA | 1.0–2.0 | 1.0–2.0 | 950 | $2,133 | $2.25 | 2d | 11 | 0.11mi |
| 1203 Wynoochee Pl NE Olympia, WA | 4.0 | 3.0 | 1755 | $2,450 | $1.40 | 43d | 1 | 0.19mi |
| 8717 Wallingford Ln NE Lacey, WA | 2.0 | 2.0 | 1200 | $2,425 | $2.02 | 43d | 1 | 0.20mi |
| 8515 Litt Dr SE Olympia, WA | 2.0 | 1.0–2.0 | 798 | $2,075 | $2.60 | 43d | 25 | 0.36mi |
| 8675 Litt Dr SE Olympia, WA | 2.0 | 1.0–2.0 | 795 | $2,197 | $2.76 | 5d | 25 | 0.42mi |
| 8675 Litt Dr SE Olympia, WA | 1.0–2.0 | 1.0–2.0 | 835 | $2,245 | $2.69 | 43d | 19 | 0.42mi |
| 220 River Ridge Dr SE Lacey, WA | 1.0–2.0 | 1.0–2.0 | 783 | $1,850 | $2.36 | 13d | 3 | 0.51mi |
| 105 Newberry Ln SE Olympia, WA | 1.0–2.0 | 1.0–2.0 | 956 | $2,233 | $2.33 | 1d | 11 | 0.55mi |
| 9129 Skokomish Way NE Olympia, WA | 3.0 | 2.0 | 1460 | $2,650 | $1.82 | 21d | 1 | 0.64mi |
| 1419 Mamook Ct NE Olympia, WA | 2.0 | 2.0 | 1140 | $2,095 | $1.84 | 13d | 1 | 0.65mi |
| 1110 Copper Wood Ln SE Lacey, WA | 2.0–4.0 | 1.0–2.0 | 1134 | $1,742 | $1.54 | 5d | 1 | 0.70mi |
| 9320 Windsor Ln NE Olympia, WA | 1.0–2.0 | 1.0–2.0 | 973 | $2,181 | $2.24 | 1d | 11 | 0.82mi |
| 317 Trailblazer St SE Unit C Olympia, WA | 3.0 | 1.5 | 1040 | $1,850 | $1.78 | 21d | 1 | 0.89mi |
| 7815 3rd Ave SE Unit A Olympia, WA | 3.0 | 1.0 | 988 | $2,350 | $2.38 | 43d | 1 | 0.92mi |
| 316 Choker St SE Unit 4 Olympia, WA | 2.0 | 1.5 | 1060 | $1,795 | $1.69 | 13d | 1 | 0.97mi |
| 333 Choker St SE Unit B Olympia, WA | 3.0 | 1.5 | 1000 | $2,200 | $2.20 | 21d | 1 | 1.04mi |
| 7641 3rd Way SE Lacey, WA | 1.0–2.0 | 1.0–2.0 | 925 | $2,178 | $2.35 | 13d | 9 | 1.12mi |
| 8811 31st Ave NE Lacey, WA | 1.0–3.0 | 1.0–2.0 | 909 | $2,655 | $2.92 | 1d | 13 | 1.16mi |
| 8727 Hanna Ln NE Unit 05-202 * ONE MONTH FREE RENT Lacey, WA | 2.0 | 2.0 | 1015 | $2,045 | $2.01 | 43d | 1 | 1.17mi |
| 8739 Hanna Ln NE Unit 7202 Lacey, WA | 2.0 | 2.0 | 1015 | $2,095 | $2.06 | 43d | 1 | 1.18mi |
| 8736 Hanna Ln NE Unit 12-103 (ADA) Lacey, WA | 2.0 | 2.0 | 1015 | $2,095 | $2.06 | 21d | 1 | 1.20mi |
| 8755 Hanna Ln NE Unit 10-104 Lacey, WA | 2.0 | 2.5 | 1148 | $2,245 | $1.96 | 21d | 1 | 1.23mi |
| 7808 Pamela Ct SE Lacey, WA | 2.0 | 1.0 | 1170 | $2,250 | $1.92 | 13d | 1 | 1.23mi |
| 3200 Willamette Dr NE Lacey, WA | 1.0–3.0 | 1.0–2.0 | 975 | $2,716 | $2.79 | 1d | 10 | 1.31mi |
Listing history 19 events
-
2026-06-18days on market $99,000 Active 217 DOM
-
2026-06-17days on market $99,000 Active 216 DOM
-
2026-06-16days on market $99,000 Active 215 DOM
-
2026-06-15days on market $99,000 Active 214 DOM
-
2026-06-14days on market $99,000 Active 212 DOM
-
2026-06-13days on market $99,000 Active 211 DOM
-
2026-06-10days on market $99,000 Active 209 DOM
-
2026-06-09days on market $99,000 Active 208 DOM
-
2026-06-08days on market $99,000 Active 207 DOM
-
2026-06-07days on market $99,000 Active 206 DOM
-
2026-06-03days on market $99,000 Active 202 DOM
-
2026-06-02days on market $99,000 Active 201 DOM
-
2026-06-01days on market $99,000 Active 200 DOM
-
2026-05-31days on market $99,000 Active 199 DOM
-
2026-05-30days on market $99,000 Active 198 DOM
-
2026-04-17price $99,000
-
2026-03-05price $104,000
-
2026-01-10price $112,000
-
2025-11-13$129,000 Active
ⓘ Source: listings_history table (triggers on properties + properties_extension) + one-shot
backfill from property_details.listing_events for pre-trigger history.
Tax reassessment forecast WA · Resets to sale price
- Current annual tax
- $263 · $22/mo
- Projected year-2 tax
- $970 · $81/mo
- Expected delta
- +$707/yr (+$59/mo · 269.1%)
ⓘ Screening estimate from a state-policy table — verify with the county assessor before closing.
Climate risk First Street
- Flood 1/10 Low FEMA zone X (unshaded) · 0% chance over 30 yrs
- Wildfire 3/10 Moderate
- Heat 3/10 Moderate 6 d/yr ≥88°F today · 12 d/yr by 30 yrs out
- Wind 1/10 Low
- Air quality 6/10 Major 7 unhealthy d/yr today · 8 by 30 yrs out
Nearby sold comps map
Loading sold comps map…
Walkable amenities ~0.75 mi
Loading nearby amenities…
Taxation est. · year 1
- Rental income
- $27,606
- − Mortgage interest
- −$5,546
- − Property taxes
- −$263
- − Insurance
- −$495
- − Repairs & maintenance
- −$2,208
- − Management
- −$2,208
- − Depreciation
- −$2,880
- Taxable income
- $14,005
- Est. tax owed @ 24.0%
- −$3,361
- After-tax cash flow
- $11,459/yr
For passive investors: Depreciation is non-cash, so a rental often shows a tax loss while cash-flowing — sheltering income. Rental losses are passive: they offset passive income freely, and up to $25,000/yr can offset ordinary (W-2) income if you actively participate and your MAGI is under $100k (phasing out to $0 by $150k); unused losses carry forward. On sale, claimed depreciation is recaptured at up to 25%, and gains may owe capital-gains tax (a 1031 exchange can defer both). Figures are a year-1 estimate at your 24.0% rate — not tax advice; consult a CPA.
Schools (NCES district)
- District
- North Thurston Public Schools
- NCES district ID
- 5305850
- Math proficiency
- 51% ▬ 0.00%
- Reading proficiency
- 62% ▬ 0.00%
- Median HH income
- $62,338
- Composite
- 51.09/100
- National rank
- #3798
- State rank
- #80 of 291 in WA
Livability — Lacey
- Score
- 85/100
- State rank
- #33
- US rank
- #581
Category grades
Schools grade is shown separately in the Schools card above.
Census & demographics
- Census place
- Lacey, WA
- County
- Thurston County · 269,345 people
- City population
- 108,850
- Metro
- Olympia-Lacey-Tumwater, WA
- Population (ZIP)
- 29,177
- Household income
- $98,892
- Rent vs Own
- Severe rent burden
- 1202.0
Population outlook (Thurston County) Hauer SSP2
- Today (2025)
- 308,239 people
- By 2030
- 326,483 · +5.9%
- By 2040
- 359,890 · +16.8%
- By 2050
- 391,800 · +27.1%
- By 2075
- 468,024 · +51.8%
- By 2100
- 519,890 · +68.7%
Race, ethnicity, and origin ACS 2023
- Neighborhood character
- Diverse neighborhood (Simpson 0.58)
- Race & ethnicity
- White 62% Two or more races 14% Asian 11% Hispanic / Latino 10% Black 4% Pacific Islander 1%
- Hispanic origin (detail)
- Mexican 6%
- Common ancestry
- Portuguese 3% Lithuanian 2% Iranian 2%
- Foreign-born
- 14% · Canada, Vietnam, South Korea
- Languages at home
- 81% English-only · Spanish 7% Other Asian/Pacific 3% Tagalog/Filipino 2%
Political lean MEDSL · Thurston
- 2024 margin
- Strong D (+20.4) · D 58.5% · R 38.1% · Other 3.5%
- 2008→2024 swing
- -1.3pp toward R · 2008: 21.7pp · 2024: 20.4pp
- All cycles
- 2024: D+20.4 2020: D+18.6 2016: D+15.4 2012: D+19.0 2008: D+21.7
Not yet ingested
- Civics
- —
Market trends
- HPI YoY
- ▼ -203.16%
- Current HPI
- 323.7121
- Rent YoY
- ▲ 3.75%
- Metro
- Olympia-Lacey-Tumwater, WA
- State GDP YoY
- ▲ 4.65%
- F500 in state
- 22
Industry mix (Fortune 500 HQ in WA)
| Industry | F500 HQs | Revenue |
|---|---|---|
| Retail | 2 | $269B |
|
||
| Technology / Retail | 1 | $638B |
|
||
| Technology | 1 | $245B |
|
||
| Telecommunications | 1 | $38B |
|
||
| Food / Beverage | 1 | $36B |
|
||
| Automotive / Trucks | 1 | $34B |
|
||
Price history
-23.3% since first listed4 events — show timeline
- 2026-04-17 Price Changed $99,000 NWMLS as Distributed by MLS Grid
- 2026-03-05 Price Changed $104,000 NWMLS as Distributed by MLS Grid
- 2026-01-10 Price Changed $112,000 NWMLS as Distributed by MLS Grid
- 2025-11-13 Listed $129,000 NWMLS as Distributed by MLS Grid
Property tax history
+13.8%/yrLatest (2026): $263 · +32.0% YoY. Source: county tax records.
Cash-flow waterfall
monthlySold comps — $/sqft
last 12 mo · ≤1 miLoading sold comps…