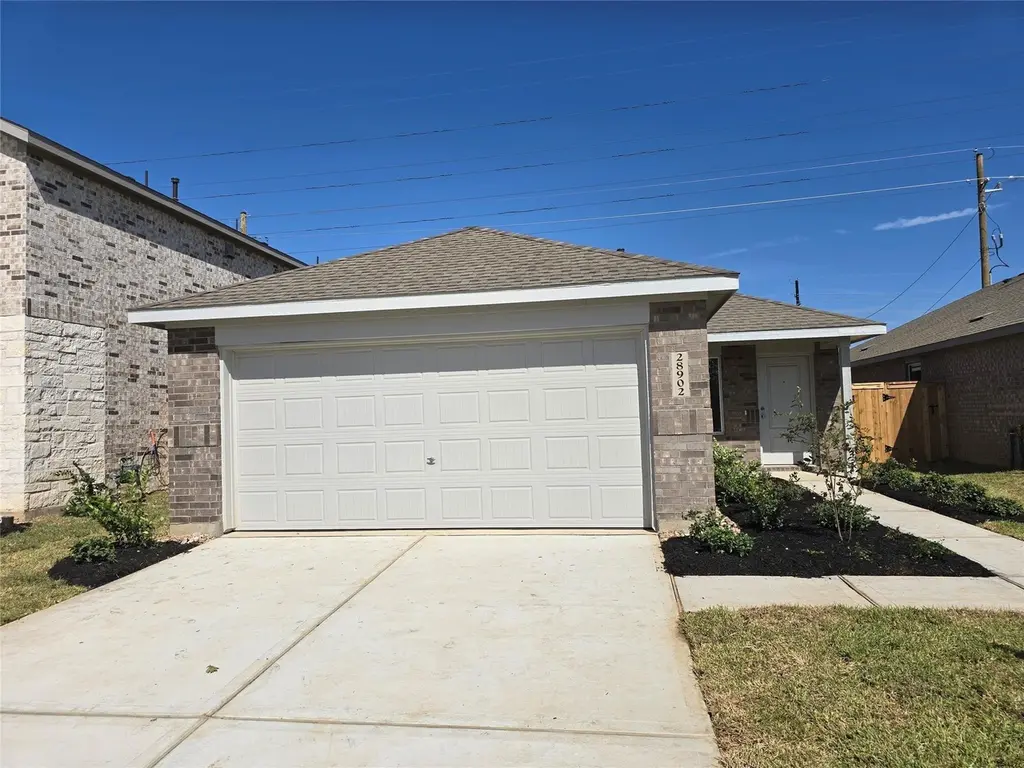
21510 Willow River Canyon Ln · Houston, TX
Flood risk 1/10 · Minimal
- FEMA flood zone
- X (unshaded)
- Chance of flooding over 30 yrs
- 0.0%
- Est. flood insurance / yr
- $507 – $1,088
Fire risk 7/10 · Major
- Est. fire insurance / yr
- $1,222 – $2,270
Heat risk 8/10 · Major
- Hot days now (above 111°F)
- 7 days/yr
- Hot days in 30 yrs
- 22 days/yr
Wind risk 9/10 · Severe
- Chance of severe wind over 30 yrs
- 99.0%
Air-quality risk 2/10 · Minimal
- Unhealthy air days now
- 1 days/yr
- Unhealthy air days in 30 yrs
- 1 days/yr
Risk factors via First Street. Map © Google.
Why this score? — see what drove the D grade
The composite is a weighted blend of 9 inputs, each scored 0–100. Each bar is that input's sub-score; the figure is the points it added to the 100-point composite (weight × sub-score).
- ARV discount +10.7/15.0
- Cash flow +9.9/30.0
- Condition / age +4.0/5.0
- Livability +3.7/5.0
- 1% rule +3.1/10.0
- Appreciation +2.9/10.0
- Schools +2.9/10.0
- DSCR +2.8/10.0
- Rent growth +1.6/5.0
$227,990
🖨 Deal sheet (PDF) 📄 Offer letter ✓ Due diligence
Listing remarks MLS
NEW Lennar Cottage Collection "Oakridge" Plan with Brick Elevation "H1" in Binford Creek! This single-level home showcases a spacious open floorplan shared between the kitchen, dining area and family room for easy entertaining during gatherings. An owner’s suite enjoys a private location in a rear corner of the home, complemented by an en-suite bathroom and walk-in closet. There are two secondary bedrooms along the side of the home, which are ideal for household members and hosting overnight guests.
Key facts
- Walk-in closet
- Open floorplan
- Secondary bedrooms
Tags
Neighborhood map
What this means for you Summary
Snapshot
- This is a 3-bed/2.0-bath single-family listed at $228k. Condition is rated good.
Deal economics
- At list price, monthly cash flow is $-141 ($-2k/yr) — negative.
- To cash-flow at today's rent, offer at most $208k (8.9% below list).
- To meet the 1% rule (rent ≥ 1% of price), the offer needs to be $186k (18.6% below list).
- Recommended offer: $186k (18.6% below list) — sets the bar for 1% rule.
- Cap rate 5.6% vs local median 3.2% in Houston — top-decile yield for the area; either an underpriced asset or a hidden risk that comps aren't pricing in. Stress-test before assuming the spread holds.
Location & tenants
- Location reads 74/100 on livability (#184 in TX, #4,771 nationally) — a middle-class / working-renter tenant base. Strengths: amenities A+, cost of living A+, housing A+; Watch: crime F.
- Waller ISD (rural): math 30% / reading 35% proficiency, ranked #532 of 826 in TX (top 64%) — families likely to look elsewhere, expect single-tenant / working-renter base with shorter leases.
- Zoned schools: Evelyn Turlington El (math 46% / reading 45%, grade D-, #1,112 of 4,322 statewide, top 26%, 1,084 students, 69% FRL); Schultz J H (math 31% / reading 37%, grade F, #892 of 1,662 statewide, top 55%, 1,120 students, 65% FRL); Waller H S (math 25% / reading 40%, grade F, #1,029 of 1,632 statewide, top 64%, 2,639 students, 62% FRL).
- Market conditions: Rents falling (-3.8%/yr); 1196 active listings in the ZIP; 2 comparable units currently listed for rent nearby; solid renter incomes; 29,883 units permitted in Harris County in 2024 (8,621 in 5+ unit buildings).
Forward outlook
- Local home prices are declining (-3.0%/yr); year-one equity from $2k of loan paydown is wiped out by about $7k of value loss. Plan a longer hold.
- Harris County population projected at +47% by 2050 — long-run rental-demand tailwind backs the buy-and-hold thesis.
Negotiation context
- It's been on market 23 days — a 2% lower offer ($225k) is reasonable based on typical stale-listing flexibility.
Risks & watch-outs
- Climate carrying-cost: severe wind risk, 99% chance of damaging wind over 30y; major wildfire risk; extreme-heat days projected 7→22/yr by 2055 (HVAC capex compounding) — expect insurance premiums to compound above CPI over the hold.
Questions for the listing agent
- What do current leases actually rent for vs. the listed asking? Can we see a recent rent roll and the last 12 months of T-12 income?
- What does the HOA fee cover, when was the last increase, and are there any pending special assessments or reserve-fund shortfalls?
- Is there a deadline driving the sale (1031 exchange, divorce, estate, relocation)? That informs how much negotiation room exists.
- Schools are D-rated, which usually means shorter tenancies and higher turnover. Who's the typical renter profile here, and what's been the actual vacancy rate?
- Crime grade is F in this area — have there been break-ins, vandalism, or insurance claims at this property in the last 3 years? What carrier currently insures it and at what premium?
- The area grade is low — what's the realistic commute time and amenity access for the typical tenant pool here? Any planned neighborhood developments (good or bad) we should know about?
- What's the average days-on-market for RENTAL listings here right now (not sales)? A rising rental-DOM trend means longer vacancies and softer asking-rent achievability than the comps imply.
- What's the recent tenant-quality profile in this submarket — average credit score on applications, eviction rate, late-payment / NSF rate, and stable-employment percentage? A property-management company in the area should have these aggregated.
- How much new for-sale + rental construction is in the pipeline within 1–3 miles? Heavy new supply typically softens prices + rents 12–24 months out; constrained supply supports both.
Investment metrics
- 1% rule
- 0.81% ✗
- Cap rate
- 5.55%
- Cash-on-cash
- -2.65%
- DSCR
- 0.88
- GRM
- 10.2
CMA / ARV
- ARV (median comp)
- $245,218
- List price
- $227,990
- Delta
- -7.03%
- Verdict
- FAIR
- Comps
- 20 within 1.0 mi
Show comp detail 12 sales within ~0.75 mi
| Address | Dist | Beds/Ba | Sqft | Sold | Price | $/sf | Match |
|---|---|---|---|---|---|---|---|
| 21519 Willow River Canyon Ln | 0.04mi | 3/2.0 | 1,273 (0%) | 4mo | $229,990 | $181 | 95 |
| 21618 Willow River Canyon Ln | 0.08mi | 3/2.0 | 1,273 (0%) | 3mo | $227,990 | $179 | 94 |
| 21803 Willow River Canyon Ln | 0.25mi | 3/2.0 | 1,273 (0%) | 2mo | $231,990 | $182 | 87 |
| 21526 Willow River Canyon Ln | 0.03mi | 3/2.0 | 1,409 (+11%) | 1mo | $232,990 | $165 | 80 |
| 21614 Willow River Canyon Ln | 0.07mi | 3/2.0 | 1,409 (+11%) | 2mo | $232,990 | $165 | 77 |
| 21515 Willow River Canyon Ln | 0.04mi | 3/2.0 | 1,409 (+11%) | 4mo | $232,990 | $165 | 77 |
| 21610 Willow River Canyon Ln | 0.06mi | 3/2.0 | 1,418 (+11%) | 2mo | $245,990 | $173 | 77 |
| 21511 Willow River Canyon Ln | 0.03mi | 3/2.0 | 1,418 (+11%) | 4mo | $245,990 | $173 | 76 |
| 21503 Willow River Canyon Ln | 0.03mi | 3/2.0 | 1,418 (+11%) | 4mo | $251,990 | $178 | 76 |
| 21638 Willow River Canyon Ln | 0.11mi | 3/2.0 | 1,409 (+11%) | 2mo | $232,990 | $165 | 75 |
| 21630 Willow River Canyon Ln | 0.10mi | 3/2.0 | 1,418 (+11%) | 2mo | $245,990 | $173 | 75 |
| 21642 Willow River Canyon Ln | 0.12mi | 3/2.0 | 1,418 (+11%) | 2mo | $247,990 | $175 | 73 |
Match score weights: distance 35% · size 25% · config 20% · recency 20%. Top-matched comps best support the ARV.
Projected returns pro-forma
-3.0% appreciation · 0.0% rent growth · sell at horizon
- IRR
- -24.2%
- Equity multiple
- 0.20×
- Total profit
- $-51,306
- Equity at exit
- $33,994
- IRR
- -31.5%
- Equity multiple
- -0.21×
- Total profit
- $-77,050
- Equity at exit
- $19,712
Cash invested: $63,837 (down + closing). Projections, not guarantees.
Landlord ↔ Tenant lean methodology
- Overall (STATE)
- 87 Strongly Landlord-Friendly
- State Texas
- 87 Strongly Landlord-Friendly · R+5
- County
- — inherits STATE
- City
- — inherits STATE
ZIP-level market 77484
- Home prices YoY
- -1.0%
- Rents YoY
- -3.8%
- Active inventory
- 1196
- Price-to-rent
- 10.2×
Monthly cashflow live
- Estimated rent
- $1,855 medium interval (Pro) →
- Mortgage (P&I)
- −$1,196
- Tax est. 1.5%
- −$285 /mo · $3,420/yr
- Insurance
- −$95
- HOA
- −$31
- Vacancy / Maint / Mgmt
- −$390
- Net cashflow
- $-141
Break-even live
Sensitivity live
| Price | -10% $17 | -5% $-62 | +0% $-141 | +5% $-220 | +10% $-298 |
|---|---|---|---|---|---|
| Rent | -10% $-287 | -5% $-214 | +0% $-141 | +5% $-68 | +10% $6 |
| Rate | -1.0pp $-26 | -0.5pp $-83 | base $-141 | +0.5pp $-200 | +1.0pp $-260 |
UW: 25.0% down · 7.5% · 30yr · 1.5% tax · 5.0% vac · 8.0% maint · 8.0% mgmt
Financing live
Cash to close
- Down payment
- $56,998
- Closing costs
- $6,840
- Reserves months
- —
- Total cash needed
- —
Loan-product check · same deal, 3 products live
Conventional
25% down · 7.5% · 30yr
- Down + closing
- —
- Monthly P&I
- —
- Monthly cashflow
- —
- DSCR
- —
- Eligible?
- —
Personal DTI + credit; lowest rate.
DSCR
20% down · 8.5% · 30yr
- Down + closing
- —
- Monthly P&I
- —
- Monthly cashflow
- —
- DSCR
- —
- Eligible?
- —
No personal income docs; deal must DSCR.
Hard money
10% down · 12.0% · 12mo
- Down + closing
- —
- Monthly P&I
- —
- Monthly cashflow
- —
- DSCR
- —
- Eligible?
- —
Short-term bridge; refi at stabilization.
Rent comps 2 comps
| Address | Beds | Baths | Sqft | Rent | $/sqft | DOM | Units | Dist |
|---|---|---|---|---|---|---|---|---|
| 21514 Barnridge Ct Waller, TX | 4.0 | 2.0 | 1655 | $1,895 | $1.15 | 7d | 1 | 0.15mi |
| 21707 Cottonwood Meadows Trl Waller, TX | 3.0 | 2.0 | 1373 | $1,749 | $1.27 | 26d | 1 | 0.23mi |
HOA detail
- Monthly dues
- $31 · $372/yr
Listing history 2 events
-
2026-05-07status Pending 531-char remark
Show marketing remark (531 chars)
NEW Lennar Cottage Collection "Oakridge" Plan with Brick Elevation "H1" in Binford Creek! This single-level home showcases a spacious open floorplan shared between the kitchen, dining area and family room for easy entertaining during gatherings. An owner’s suite enjoys a private location in a rear corner of the home, complemented by an en-suite bathroom and walk-in closet. There are two secondary bedrooms along the side of the home, which are ideal for household members and hosting overnight guests.
-
2026-04-14$227,990 Active 531-char remark
Show marketing remark (531 chars)
NEW Lennar Cottage Collection "Oakridge" Plan with Brick Elevation "H1" in Binford Creek! This single-level home showcases a spacious open floorplan shared between the kitchen, dining area and family room for easy entertaining during gatherings. An owner’s suite enjoys a private location in a rear corner of the home, complemented by an en-suite bathroom and walk-in closet. There are two secondary bedrooms along the side of the home, which are ideal for household members and hosting overnight guests.
ⓘ Source: listings_history table (triggers on properties + properties_extension) + one-shot
backfill from property_details.listing_events for pre-trigger history.
Climate risk First Street
- Flood 1/10 Low FEMA zone X (unshaded) · 0% chance over 30 yrs
- Wildfire 7/10 Severe
- Heat 8/10 Severe 7 d/yr ≥111°F today · 22 d/yr by 30 yrs out
- Wind 9/10 Extreme 99% chance of damaging wind over 30 yrs
- Air quality 2/10 Low 1 unhealthy d/yr today · 1 by 30 yrs out
Nearby sold comps map
Loading sold comps map…
Walkable amenities ~0.75 mi
Loading nearby amenities…
Taxation est. · year 1
- Rental income
- $22,264
- − Mortgage interest
- −$12,771
- − Property taxes
- −$3,420
- − Insurance
- −$1,140
- − Repairs & maintenance
- −$1,781
- − Management
- −$1,781
- − HOA
- −$372
- − Depreciation
- −$6,632
- Taxable loss
- −$5,633
- Est. tax savings @ 24.0%
- +$1,352
- After-tax cash flow
- $-338/yr
For passive investors: Depreciation is non-cash, so a rental often shows a tax loss while cash-flowing — sheltering income. Rental losses are passive: they offset passive income freely, and up to $25,000/yr can offset ordinary (W-2) income if you actively participate and your MAGI is under $100k (phasing out to $0 by $150k); unused losses carry forward. On sale, claimed depreciation is recaptured at up to 25%, and gains may owe capital-gains tax (a 1031 exchange can defer both). Figures are a year-1 estimate at your 24.0% rate — not tax advice; consult a CPA.
Condition & rehab AI · 12 photos
This single-family home is in good condition with a modern kitchen and bathrooms, and a well-maintained exterior. It has potential for further value increases through exterior painting and landscaping.
Value-add opportunities
- Both Painting the exterior brick — Enhances curb appeal and can increase both resale and rental value.
- Both Landscaping the front yard — Improves curb appeal and can increase both resale and rental value.
- Both Adding a smart home system — Enhances convenience and can increase both resale and rental value.
- Both Upgrading the flooring in the bathrooms — Improves aesthetics and can increase both resale and rental value.
Renovation cost estimate screening
Value-add ROI direction
- Both Painting the exterior brick — Enhances curb appeal and can increase both resale and rental value. ↑
- Both Landscaping the front yard — Improves curb appeal and can increase both resale and rental value. ↑
- Both Adding a smart home system — Enhances convenience and can increase both resale and rental value. ↑
- Both Upgrading the flooring in the bathrooms — Improves aesthetics and can increase both resale and rental value. ↑
ⓘ Cost ranges are severity-bucket heuristics (US national rule-of-thumb). Get contractor quotes + a written scope before underwriting a rehab budget.
Schools (NCES district)
- District
- Waller ISD
- NCES district ID
- 4844430
- Math proficiency
- 30% ▼ -23.00%
- Reading proficiency
- 35% ▼ -11.00%
- Median HH income
- $58,911
- Composite
- 29.12/100
- National rank
- #6593
- State rank
- #532 of 826 in TX
Livability — Houston
- Score
- 74/100
- State rank
- #184
- US rank
- #4771
Category grades
Schools grade is shown separately in the Schools card above.
Census & demographics
- County
- Harris County · 4,702,590 people
- City population
- 3,226,434
- Metro
- Houston-The Woodlands-Sugar Land, TX
- Population (ZIP)
- 14,348
- Household income
- $81,250
- Rent vs Own
- Severe rent burden
- 270.0
Population outlook (Harris County) Hauer SSP2
- Today (2025)
- 5,571,493 people
- By 2030
- 6,089,821 · +9.3%
- By 2040
- 7,142,806 · +28.2%
- By 2050
- 8,185,864 · +46.9%
- By 2075
- 10,574,329 · +89.8%
- By 2100
- 12,109,958 · +117.4%
Race, ethnicity, and origin ACS 2023
- Neighborhood character
- Diverse neighborhood (Simpson 0.66)
- Race & ethnicity
- White 47% Hispanic / Latino 31% Two or more races 16% Black 15%
- Hispanic origin (detail)
- Mexican 30%
- Common ancestry
- Slovak 2% Serbian 2% Iranian 1%
- Foreign-born
- 13% · Canada
- Languages at home
- 73% English-only · Spanish 24% Arabic 2%
Political lean MEDSL · Harris
- 2024 margin
- Lean D (+5.5) · D 52.0% · R 46.4% · Other 1.6%
- 2008→2024 swing
- +3.9pp toward D · 2008: 1.6pp · 2024: 5.5pp
- All cycles
- 2024: D+5.5 2020: D+13.3 2016: D+12.4 2012: D+0.1 2008: D+1.6
Not yet ingested
- Civics
- —
Market trends
- HPI YoY
- ▼ -4.17%
- Current HPI
- 397.85
- Rent YoY
- ▼ -3.77%
- Metro
- Houston-The Woodlands-Sugar Land, TX
- State GDP YoY
- ▲ 3.95%
- F500 in state
- 110
Industry mix (Fortune 500 HQ in TX)
| Industry | F500 HQs | Revenue |
|---|---|---|
| Energy | 16 | $1,198B |
|
||
| Technology | 5 | $198B |
|
||
| Engineering / Construction | 4 | $72B |
|
||
| Energy Services | 3 | $60B |
|
||
| Utilities | 3 | $41B |
|
||
| Healthcare | 2 | $330B |
|
||
Price history
2 events — show timeline
- 2026-05-07 Pending — HARMLS
- 2026-04-14 Listed $227,990 HARMLS
Cash-flow waterfall
monthlySold comps — $/sqft
last 12 mo · ≤1 miLoading sold comps…