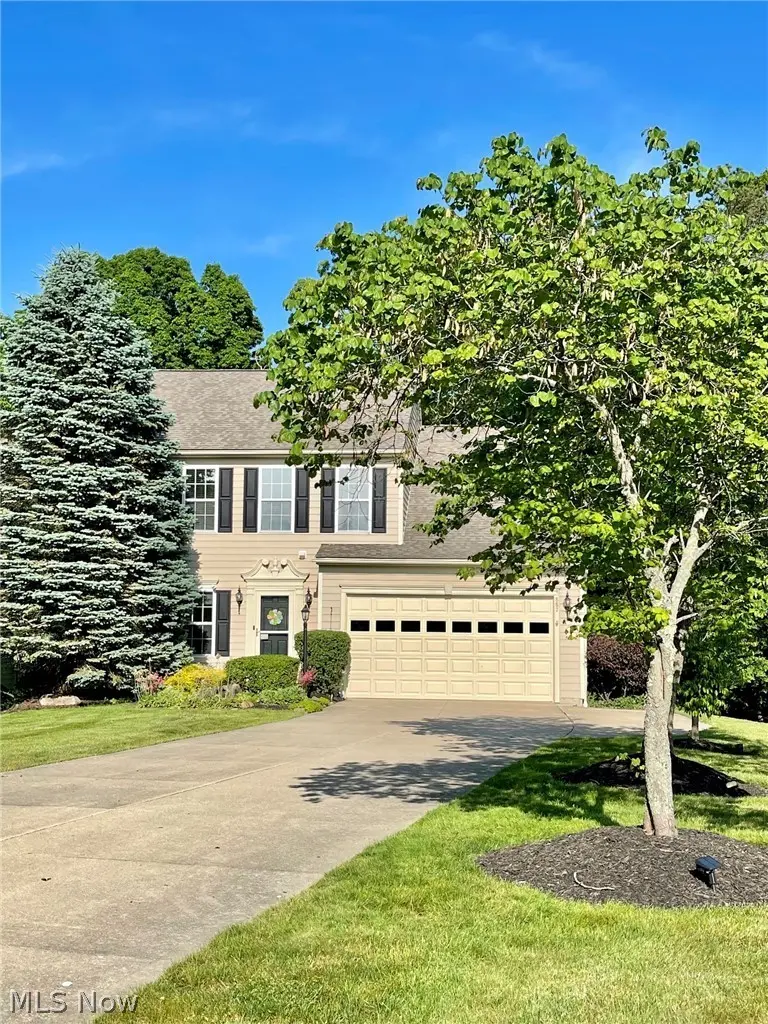
887 Willow Creek Dr · Akron, OH
Flood risk 1/10 · Minimal
- FEMA flood zone
- X (unshaded)
- Chance of flooding over 30 yrs
- 0.0%
- Est. flood insurance / yr
- $473 – $860
Fire risk 1/10 · Minimal
- Est. fire insurance / yr
- $713 – $1,323
Heat risk 3/10 · Minor
- Hot days now (above 97°F)
- 7 days/yr
- Hot days in 30 yrs
- 17 days/yr
Wind risk 1/10 · Minimal
- Chance of severe wind over 30 yrs
- —
Air-quality risk 2/10 · Minimal
- Unhealthy air days now
- 1 days/yr
- Unhealthy air days in 30 yrs
- 2 days/yr
Risk factors via First Street. Map © Google.
Why this score? — see what drove the C grade
The composite is a weighted blend of 9 inputs, each scored 0–100. Each bar is that input's sub-score; the figure is the points it added to the 100-point composite (weight × sub-score).
- Cash flow +25.0/30.0
- DSCR +8.2/10.0
- Schools +7.6/10.0
- 1% rule +6.8/10.0
- Livability +4.0/5.0
- Rent growth +2.5/5.0
- Condition / age +2.5/5.0
- ARV discount +0.2/15.0
- Appreciation +0.0/10.0
$460,000
🖨 Deal sheet 📄 Offer letter ✓ Due diligence
Listing remarks MLS
One of the best locations in the Willow Creek development with a prime lot overlooking the Sand Run metro park and a large, quite usable back yard accessible from the finished, walk-out lower level. Inside the front door is a formal living room (some owners have used as a formal dining), half bath, 1st floor laundry, a spacious family room and a recently remodeled kitchen with newer granite countertops, stainless steel appliances and custom finishes to the cabinets. The kitchen features a breakfast bar and large eating area with access to the upper level deck. The entire back of the house is fortunate to have plenty of windows to view the private, wooded lot. The second floor offers 4 nice size bedrooms, master bedroom with vaulted ceilings and updated bath with granite counters. The finished lower level is a walk out with two large entertaining spaces- the family room has a gas fireplace and stone wall and bar, the other section could be a nice play area for the kids or an in hom
Key facts
- Updated home
- Long driveway
- Wall of windows
Tags
Property features AI
Finance
- HOA & community: Homeowners association (Willow Creek); Monthly HOA fee of $215; HOA covers grounds maintenance and snow removal
Exterior
- Parking: Attached garage with electricity; 2 garage spaces; Paved driveway
- Utilities: Public water; Public sewer
- Home design: 2 stories; Faces west; Attached property
- Construction: Vinyl siding; Asphalt/fiberglass roof; Finished walk-out basement; Basement; Home warranty included
- Exterior features: Sprinkler/irrigation system; Deck; Patio; Front sprinklers; Wooded lot; Has a view
Interior
- Kitchen: Dishwasher; Range; Refrigerator
- Bedrooms: 4 main-level bedrooms
- Bathrooms: 3 full bathrooms; 1 half bathroom; 1 main-level bathroom
- Heating & cooling: Central air conditioning; Forced-air heating (gas)
- Interior features: Ceiling fans; High ceilings; Open floor plan; Pantry; Walk-in closets; Shutters on windows
- Laundry & utility: Main-level laundry
Neighborhood map
What this means for you Summary
Snapshot
- This is a 4-bed/3.5-bath single-family listed at $460k.
Deal economics
- At list price, monthly cash flow is $1k ($12k/yr) — positive.
- The deal already cash-flows at list — no discount required.
- Meets the 1% rule at list price ($5k rent vs $460k).
- Cap rate 8.9% vs local median 6.6% in Akron — top-decile yield for the area; either an underpriced asset or a hidden risk that comps aren't pricing in. Stress-test before assuming the spread holds.
Location & tenants
- Location reads 81/100 on livability (#104 in OH, #1,591 nationally) — a professional / high-income tenant draw. Strengths: amenities A+, commute A+, cost of living A+; Watch: crime F, employment F.
- Revere Local (rural): math 83% / reading 86% proficiency, ranked #17 of 656 in OH (top 3%) — strong family-tenant draw, lease renewals of 3-5y typical; only 5% free/reduced lunch — higher-income household profile.
- Market conditions: 112 active listings in the ZIP; 2 comparable units currently listed for rent nearby; high-income renter base; 1,114 units permitted in Summit County in 2024 (397 in 5+ unit buildings).
- At $5,429/mo this rent would consume 55% of the median local household income ($119k/yr) — very limited rent-growth headroom before tenants either downsize or default.
Forward outlook
- Local home prices are declining (-3.0%/yr); year-one equity from $3k of loan paydown is wiped out by about $14k of value loss. Plan a longer hold.
- Summit County population projected to shrink 6% by 2050 — rents likely to lag national; underwrite the cash flow, not the appreciation.
Negotiation context
- Only 13 days on market — expect competitive offers; lowballing is unlikely to land.
- 7 sale attempts since 17y ago with the ask held roughly flat each time — persistent listings suggest the price (not the market) is what's stuck; bring a comps-based counter.
- Current owner paid $354k; 30% above their basis — modest negotiation headroom, anchor on the comps not their cost.
Questions for the listing agent
- What does the HOA fee cover, when was the last increase, and are there any pending special assessments or reserve-fund shortfalls?
- Is there a deadline driving the sale (1031 exchange, divorce, estate, relocation)? That informs how much negotiation room exists.
- Crime grade is F in this area — have there been break-ins, vandalism, or insurance claims at this property in the last 3 years? What carrier currently insures it and at what premium?
- What's the average days-on-market for RENTAL listings here right now (not sales)? A rising rental-DOM trend means longer vacancies and softer asking-rent achievability than the comps imply.
- What's the recent tenant-quality profile in this submarket — average credit score on applications, eviction rate, late-payment / NSF rate, and stable-employment percentage? A property-management company in the area should have these aggregated.
- How much new for-sale + rental construction is in the pipeline within 1–3 miles? Heavy new supply typically softens prices + rents 12–24 months out; constrained supply supports both.
Investment metrics
- 1% rule
- 1.18% ✓
- Cap rate
- 8.91%
- Cash-on-cash
- 9.34%
- DSCR
- 1.42
- GRM
- 7.1
CMA / ARV
- ARV (on-the-fly)
- $396,126
- Comps found
- 12
Show comp detail 12 sales within ~0.75 mi
| Address | Dist | Beds/Ba | Sqft | Sold | Price | $/sf | Match |
|---|---|---|---|---|---|---|---|
| 863 Willow Creek Dr | 0.07mi | 4/3.5 | 2,294 (+2%) | 7mo | $405,000 | $177 | 87 |
| 837 Willow Creek Dr | 0.12mi | 4/3.5 | 2,398 (+7%) | 1mo | $471,000 | $196 | 82 |
| 2090 Sand Run Knolls Dr | 0.39mi | 4/2.5 | 2,356 (+5%) | 3mo | $439,900 | $187 | 66 |
| 2574 Sourek Rd | 0.53mi | 4/2.5 | 2,236 (-0%) | 6mo | $400,000 | $179 | 66 |
| 2267 Woodpark Rd | 0.50mi | 4/2.5 | 2,382 (+6%) | 7mo | $350,000 | $147 | 56 |
| 1091 Sanborn Dr | 0.54mi | 4/2.5 | 2,352 (+5%) | 9mo | $499,000 | $212 | 55 |
| 1056 Wycliff Ln | 0.51mi | 3/2.5 (-1) | 2,128 (-5%) | 8mo | $342,000 | $161 | 53 |
| 2474 Cardigan Dr | 0.41mi | 4/3.5 | 2,552 (+14%) | 7mo | $455,000 | $178 | 52 |
| 2331 Woodpark Rd | 0.38mi | 5/3.0 (+1) | 1,981 (-12%) | 6mo | $302,000 | $152 | 51 |
| 2523 Olentangy Dr | 0.61mi | 5/2.5 (+1) | 2,316 (+4%) | 8mo | $370,000 | $160 | 50 |
| 620 Beaverbrook Dr | 0.70mi | 4/2.5 | 2,486 (+11%) | 0mo | $400,000 | $161 | 44 |
| 535 Haskell Dr | 0.73mi | 4/3.0 | 2,486 (+11%) | 9mo | $386,000 | $155 | 38 |
Match score weights: distance 35% · size 25% · config 20% · recency 20%. Top-matched comps best support the ARV.
Projected returns pro-forma
-3.0% appreciation · 3.0% rent growth · sell at horizon
- IRR
- -2.2%
- Equity multiple
- 0.92×
- Total profit
- $-10,520
- Equity at exit
- $68,587
- IRR
- 7.6%
- Equity multiple
- 1.57×
- Total profit
- $73,685
- Equity at exit
- $39,772
Cash invested: $128,800 (down + closing). Projections, not guarantees.
Landlord ↔ Tenant lean methodology
- Overall (STATE)
- 73 Landlord-Friendly
- State Ohio
- 73 Landlord-Friendly · R+6
- County
- — inherits STATE
- City
- — inherits STATE
ZIP-level market 44333
- Active inventory
- 112
- Price-to-rent
- 7.1×
Monthly cashflow live
- Estimated rent
- $5,429 medium interval (Pro) →
- Mortgage (P&I)
- −$2,412
- Tax from tax record
- −$467 /mo · $5,609/yr
- Insurance
- −$192
- HOA
- −$215
- Vacancy / Maint / Mgmt
- −$1,140
- Net cashflow
- $1,003
Break-even live
UW: 25.0% down · 7.5% · 30yr · 1.5% tax · 5.0% vac · 8.0% maint · 8.0% mgmt
Financing live
Cash to close
- Down payment
- $115,000
- Closing costs
- $13,800
- Reserves months
- —
- Total cash needed
- —
Loan-product check · same deal, 3 products live
Conventional
25% down · 7.5% · 30yr
- Down + closing
- —
- Monthly P&I
- —
- Monthly cashflow
- —
- DSCR
- —
- Eligible?
- —
Personal DTI + credit; lowest rate.
DSCR
20% down · 8.5% · 30yr
- Down + closing
- —
- Monthly P&I
- —
- Monthly cashflow
- —
- DSCR
- —
- Eligible?
- —
No personal income docs; deal must DSCR.
Hard money
10% down · 12.0% · 12mo
- Down + closing
- —
- Monthly P&I
- —
- Monthly cashflow
- —
- DSCR
- —
- Eligible?
- —
Short-term bridge; refi at stabilization.
Rent comps 2 comps
| Address | Beds | Baths | Sqft | Rent | $/sqft | DOM | Units | Dist |
|---|---|---|---|---|---|---|---|---|
| 1000 Spring Hill DR Akron, OH | 1.0–3.0 | 1.0–2.5 | 1100 | $2,099 | $1.91 | 10d | 1 | 1.39mi |
| 676 Treeside Dr Unit 1496089P Akron, OH | 4.0 | 2.0 | 1506 | $7,887 | $5.24 | 14d | 1 | 1.40mi |
HOA detail
- Monthly dues
- $215 · $2,580/yr
- Likely covers
- gas
Listing history 10 events
-
2026-06-18days on market $460,000 Active 13 DOM
-
2026-06-17days on market $460,000 Active 12 DOM
-
2026-06-16days on market $460,000 Active 11 DOM
-
2026-06-15pricedays on market $460,000 Active 10 DOM
-
2026-06-13days on market $470,000 Active 8 DOM
-
2026-06-13days on market $470,000 Active 7 DOM
-
2026-06-09days on market $470,000 Active 4 DOM
-
2026-06-08days on market $470,000 Active 3 DOM
-
2026-06-07remarks 699-char remark
-
2026-06-07$470,000 Active 2 DOM
ⓘ Source: listings_history table (triggers on properties + properties_extension) + one-shot
backfill from property_details.listing_events for pre-trigger history.
Tax reassessment forecast OH · Partial reset (capped growth)
- Current annual tax
- $5,609 · $467/mo
- Projected year-2 tax
- $6,392 · $533/mo
- Expected delta
- +$784/yr (+$65/mo · 14.0%)
ⓘ Screening estimate from a state-policy table — verify with the county assessor before closing.
Climate risk First Street
- Flood 1/10 Low FEMA zone X (unshaded) · 0% chance over 30 yrs
- Wildfire 1/10 Low
- Heat 3/10 Moderate 7 d/yr ≥97°F today · 17 d/yr by 30 yrs out
- Wind 1/10 Low
- Air quality 2/10 Low 1 unhealthy d/yr today · 2 by 30 yrs out
Nearby sold comps map
Loading sold comps map…
Walkable amenities ~0.75 mi
Loading nearby amenities…
Taxation est. · year 1
- Rental income
- $65,152
- − Mortgage interest
- −$25,767
- − Property taxes
- −$5,609
- − Insurance
- −$2,300
- − Repairs & maintenance
- −$5,212
- − Management
- −$5,212
- − HOA
- −$2,580
- − Depreciation
- −$13,382
- Taxable income
- $5,090
- Est. tax owed @ 24.0%
- −$1,222
- After-tax cash flow
- $10,812/yr
For passive investors: Depreciation is non-cash, so a rental often shows a tax loss while cash-flowing — sheltering income. Rental losses are passive: they offset passive income freely, and up to $25,000/yr can offset ordinary (W-2) income if you actively participate and your MAGI is under $100k (phasing out to $0 by $150k); unused losses carry forward. On sale, claimed depreciation is recaptured at up to 25%, and gains may owe capital-gains tax (a 1031 exchange can defer both). Figures are a year-1 estimate at your 24.0% rate — not tax advice; consult a CPA.
Schools (NCES district)
- District
- Revere Local
- NCES district ID
- 3905005
- Math proficiency
- 83% ▼ -6.00%
- Reading proficiency
- 86% ▼ -2.00%
- Median HH income
- $94,991
- Composite
- 75.68/100
- National rank
- #129
- State rank
- #17 of 656 in OH
Livability — Akron
- Score
- 81/100
- State rank
- #104
- US rank
- #1591
Category grades
Schools grade is shown separately in the Schools card above.
Census & demographics
- Census place
- Akron, OH
- County
- Summit · 539,389 people
- City population
- 174,375
- Metro
- Akron, OH
- Population (ZIP)
- 19,884
- Household income
- $119,313
- Rent vs Own
- Severe rent burden
- 11.0
Population outlook (Summit County) Hauer SSP2
- Today (2025)
- 546,583 people
- By 2030
- 544,028 · -0.5%
- By 2040
- 531,363 · -2.8%
- By 2050
- 514,923 · -5.8%
- By 2075
- 481,765 · -11.9%
- By 2100
- 432,265 · -20.9%
Race, ethnicity, and origin ACS 2023
- Neighborhood character
- Predominantly White (84%)
- Race & ethnicity
- White 84% Black 6% Two or more races 5% Asian 3% Hispanic / Latino 3%
- Common ancestry
- Romanian 7% Slovak 2% Italian 2%
- Foreign-born
- 6% · Canada, China, South Korea
- Languages at home
- 93% English-only · Spanish 1% German/W. Germanic 1% Russian/Polish/Slavic 1%
Political lean MEDSL · Summit
- 2024 margin
- Lean D (+7.0) · D 53.0% · R 46.0%
- 2008→2024 swing
- -9.6pp toward R · 2008: 16.6pp · 2024: 7.0pp
- All cycles
- 2024: D+7.0 2020: D+9.6 2016: D+8.2 2012: D+14.8 2008: D+16.6
Not yet ingested
- Civics
- —
Market trends
- HPI YoY
- ▼ -192.29%
- Current HPI
- 198.396
- Rent YoY
- —
- Metro
- —
- State GDP YoY
- ▲ 1.98%
- F500 in state
- 48
Industry mix (Fortune 500 HQ in OH)
| Industry | F500 HQs | Revenue |
|---|---|---|
| Insurance | 3 | $145B |
|
||
| Industrial Machinery | 3 | $49B |
|
||
| Financial Services | 3 | $24B |
|
||
| Consumer Goods | 2 | $93B |
|
||
| Aerospace / Defense | 2 | $47B |
|
||
| Utilities | 2 | $33B |
|
||
Price history
+986.1% since first listed19 events — show timeline
- 2026-06-05 Listed $470,000 MLSNOW
- 2019-05-01 Sold (Public Records) $354,000 Public Records
- 2019-04-30 Sold (MLS) $354,000 MLSNOW
- 2019-04-23 Pending — MLSNOW
- 2019-03-16 Contingent — MLSNOW
- 2019-03-12 Listed $369,900 MLSNOW
- 2011-04-01 Sold (MLS) $273,900 MLSNOW
- 2011-03-31 Sold (Public Records) $273,900 Public Records
- 2011-03-21 Listing Removed — MLSNOW
- 2010-09-21 Listed $278,900 MLSNOW
- 2010-09-17 Listing Removed — MLSNOW
- 2010-06-02 Listed $278,900 MLSNOW
- 2010-05-21 Listing Removed — MLSNOW
- 2009-12-09 Listed $289,800 MLSNOW
- 2009-12-08 Listing Removed — MLSNOW
- 2009-07-09 Listed $307,900 MLSNOW
- 2009-07-06 Listing Removed — MLSNOW
- 2009-05-06 Listed $339,900 MLSNOW
- 2003-11-06 Sold (Public Records) $43,275 Public Records
Property tax history
+2.4%/yrLatest (2025): $5,609 · +0.2% YoY. Source: county tax records.
Cash-flow waterfall
monthlySold comps — $/sqft
last 12 mo · ≤1 miLoading sold comps…