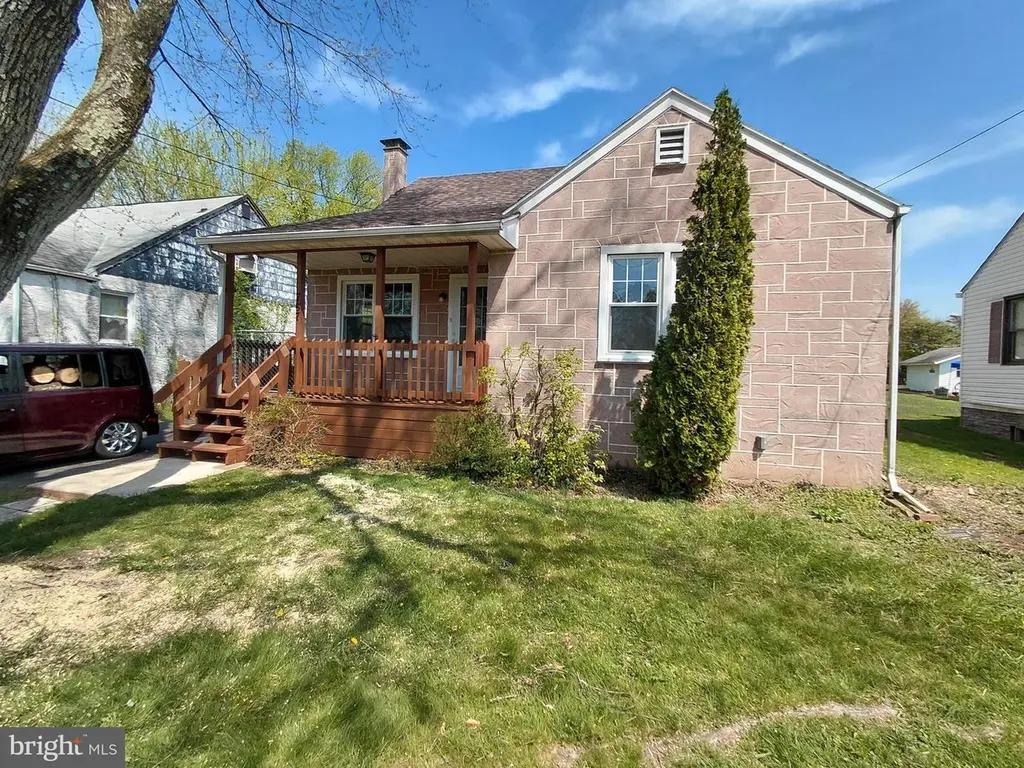
767 Lincoln Rd · Exeter, PA
Flood risk No data
- FEMA flood zone
- —
- Chance of flooding over 30 yrs
- %
- Est. flood insurance / yr
- —
Fire risk No data
- Est. fire insurance / yr
- —
Heat risk No data
- Hot days now (above °F)
- days/yr
- Hot days in 30 yrs
- days/yr
Wind risk No data
- Chance of severe wind over 30 yrs
- %
Air-quality risk No data
- Unhealthy air days now
- days/yr
- Unhealthy air days in 30 yrs
- days/yr
Risk factors via First Street. Map © Google.
Why this score? — see what drove the F grade
The composite is a weighted blend of 9 inputs, each scored 0–100. Each bar is that input's sub-score; the figure is the points it added to the 100-point composite (weight × sub-score).
- Cash flow +13.2/30.0
- Schools +4.5/10.0
- DSCR +4.0/10.0
- Livability +3.8/5.0
- 1% rule +3.7/10.0
- Rent growth +2.5/5.0
- Condition / age +2.5/5.0
- ARV discount +0.0/15.0
- Appreciation +0.0/10.0
$274,900
🖨 Deal sheet 📄 Offer letter ✓ Due diligence
Listing remarks
New listing…. .four-sided Perma stone Cape Code with brand new roof. Outside features include double hung vinyl replacement windows, aluminum capping on soffit, facia and windows. Both side porch and front porch are roof covered with fresh painting. Big back yard with outdoor shed. Inside features: extra-large living room for sectional sofa and big screen TV plus new carpet. Eat in kitchen with new vinyl flooring, ceiling fan, freshly painted cabinets and dual drain ceramic sink. Master bedroom on first floor with hardwood flooring. Second bedroom on first floor with hardwood flooring. Upstairs bedroom is over 420 square feet with hardwood flooring as well. Entire home is freshly pai
Key facts
- 7,840 sq ft lot
- Built 1948
- Listed 13 days
Neighborhood map
What this means for you Summary
Snapshot
- This is a 3-bed/1.0-bath single-family listed at $275k.
Deal economics
- At list price, monthly cash flow is $-4 ($-45/yr) — negative.
- To cash-flow at today's rent, offer at most $274k (0.2% below list).
- To meet the 1% rule (rent ≥ 1% of price), the offer needs to be $240k (12.7% below list).
- Recommended offer: $240k (12.7% below list) — sets the bar for 1% rule.
- Cap rate 6.3% vs local median 4.1% in Exeter — top-decile yield for the area; either an underpriced asset or a hidden risk that comps aren't pricing in. Stress-test before assuming the spread holds.
Location & tenants
- Location reads 76/100 on livability (#392 in PA, #3,546 nationally) — a middle-class / working-renter tenant base. Strengths: cost of living A+, health & safety A+, housing A; Watch: schools C-, amenities F, commute F.
- Exeter Township SD (suburban): math 41% / reading 60% proficiency, ranked #141 of 539 in PA (top 26%) — acceptable for families but not a draw, mixed tenant base, ~2y average lease.
- Market conditions: 83 active listings in the ZIP; 1 comparable units currently listed for rent nearby; 258 units permitted in Berks County in 2024 (27 in 5+ unit buildings).
Forward outlook
- Local home prices are declining (-3.0%/yr); year-one equity from $2k of loan paydown is wiped out by about $8k of value loss. Plan a longer hold.
- Berks County population projected at +3% by 2050 — modest demand growth; plan on rents tracking national, not racing it.
Negotiation context
- Only 13 days on market — expect competitive offers; lowballing is unlikely to land.
Risks & watch-outs
- Watch-outs: built in 1948 — expect roof / HVAC / electrical / plumbing capex.
Questions for the listing agent
- What do current leases actually rent for vs. the listed asking? Can we see a recent rent roll and the last 12 months of T-12 income?
- Built in 1948 — when were the roof, HVAC, electrical panel, plumbing, and water heater last replaced?
- Is there a deadline driving the sale (1031 exchange, divorce, estate, relocation)? That informs how much negotiation room exists.
- The area grade is low — what's the realistic commute time and amenity access for the typical tenant pool here? Any planned neighborhood developments (good or bad) we should know about?
- What's the average days-on-market for RENTAL listings here right now (not sales)? A rising rental-DOM trend means longer vacancies and softer asking-rent achievability than the comps imply.
- What's the recent tenant-quality profile in this submarket — average credit score on applications, eviction rate, late-payment / NSF rate, and stable-employment percentage? A property-management company in the area should have these aggregated.
- How much new for-sale + rental construction is in the pipeline within 1–3 miles? Heavy new supply typically softens prices + rents 12–24 months out; constrained supply supports both.
Investment metrics
- 1% rule
- 0.87% ✗
- Cap rate
- 6.28%
- Cash-on-cash
- -0.06%
- DSCR
- 1.00
- GRM
- 9.5
CMA / ARV
- ARV (on-the-fly)
- $195,640
- Comps found
- 12
Show comp detail 12 sales within ~0.75 mi
| Address | Dist | Beds/Ba | Sqft | Sold | Price | $/sf | Match |
|---|---|---|---|---|---|---|---|
| 219 Shockley Dr | 0.16mi | 3/1.0 | 1,222 (-9%) | 3mo | $325,000 | $266 | 76 |
| 419 Allenbrook Ln | 0.44mi | 3/2.0 | 1,344 (+0%) | 12mo | $125,500 | $93 | 65 |
| 319 Fairview Chapel Rd | 0.59mi | 3/2.0 | 1,375 (+3%) | 2mo | $385,000 | $280 | 63 |
| 1377 Claire Dr | 0.50mi | 3/1.0 | 1,276 (-5%) | 11mo | $274,000 | $215 | 59 |
| 515 Buddies Ct | 0.63mi | 3/2.0 | 1,408 (+5%) | 5mo | $330,000 | $234 | 54 |
| 510 Caravelle Ln | 0.47mi | 3/2.0 | 1,456 (+9%) | 10mo | $136,000 | $93 | 51 |
| 52 Keystone Rd | 0.54mi | 3/2.0 | 1,456 (+9%) | 8mo | $130,000 | $89 | 50 |
| 122 Ritz Ave | 0.54mi | 3/2.0 | 1,456 (+9%) | 10mo | $127,500 | $88 | 48 |
| 217 Knollwood Ln | 0.40mi | 2/2.0 (-1) | 1,156 (-14%) | 3mo | $100,000 | $87 | 47 |
| 36 Keystone Rd | 0.56mi | 3/2.0 | 1,232 (-8%) | 11mo | $129,900 | $105 | 47 |
| 1411 Claire Dr | 0.46mi | 3/2.0 | 1,150 (-14%) | 6mo | $241,000 | $210 | 45 |
| 1257 Highview Pl | 0.62mi | 3/2.0 | 1,540 (+15%) | 9mo | $225,000 | $146 | 35 |
Match score weights: distance 35% · size 25% · config 20% · recency 20%. Top-matched comps best support the ARV.
Projected returns pro-forma
-3.0% appreciation · 3.0% rent growth · sell at horizon
- IRR
- -16.4%
- Equity multiple
- 0.42×
- Total profit
- $-44,750
- Equity at exit
- $40,988
- IRR
- -8.1%
- Equity multiple
- 0.49×
- Total profit
- $-39,129
- Equity at exit
- $23,768
Cash invested: $76,972 (down + closing). Projections, not guarantees.
Landlord ↔ Tenant lean methodology
- Overall (STATE)
- 62 Landlord-Friendly
- State Pennsylvania
- 62 Landlord-Friendly · EVEN
- County
- — inherits STATE
- City
- — inherits STATE
ZIP-level market 19508
- Home prices YoY
- -25.6%
- Active inventory
- 83
- Price-to-rent
- 9.5×
Monthly cashflow live
- Estimated rent
- $2,400 medium interval (Pro) →
- Mortgage (P&I)
- −$1,442
- Tax est. 1.5%
- −$344 /mo · $4,124/yr
- Insurance
- −$115
- HOA
- −$0
- Vacancy / Maint / Mgmt
- −$504
- Net cashflow
- $-4
Break-even live
UW: 25.0% down · 7.5% · 30yr · 1.5% tax · 5.0% vac · 8.0% maint · 8.0% mgmt
Financing live
Cash to close
- Down payment
- $68,725
- Closing costs
- $8,247
- Reserves months
- —
- Total cash needed
- —
Loan-product check · same deal, 3 products live
Conventional
25% down · 7.5% · 30yr
- Down + closing
- —
- Monthly P&I
- —
- Monthly cashflow
- —
- DSCR
- —
- Eligible?
- —
Personal DTI + credit; lowest rate.
DSCR
20% down · 8.5% · 30yr
- Down + closing
- —
- Monthly P&I
- —
- Monthly cashflow
- —
- DSCR
- —
- Eligible?
- —
No personal income docs; deal must DSCR.
Hard money
10% down · 12.0% · 12mo
- Down + closing
- —
- Monthly P&I
- —
- Monthly cashflow
- —
- DSCR
- —
- Eligible?
- —
Short-term bridge; refi at stabilization.
Rent comps 1 comps
| Address | Beds | Baths | Sqft | Rent | $/sqft | DOM | Units | Dist |
|---|---|---|---|---|---|---|---|---|
| 1251 Buddies Pl Birdsboro, PA | 3.0 | 2.0 | 1040 | $2,400 | $2.31 | 12d | 1 | 0.64mi |
Listing history 2 events
-
2026-06-18remarks 692-char remark
-
2026-06-18$274,900 Pending 13 DOM
ⓘ Source: listings_history table (triggers on properties + properties_extension) + one-shot
backfill from property_details.listing_events for pre-trigger history.
Nearby sold comps map
Loading sold comps map…
Walkable amenities ~0.75 mi
Loading nearby amenities…
Taxation est. · year 1
- Rental income
- $28,800
- − Mortgage interest
- −$15,399
- − Property taxes
- −$4,124
- − Insurance
- −$1,374
- − Repairs & maintenance
- −$2,304
- − Management
- −$2,304
- − Depreciation
- −$7,997
- Taxable loss
- −$4,702
- Est. tax savings @ 24.0%
- +$1,128
- After-tax cash flow
- $1,083/yr
For passive investors: Depreciation is non-cash, so a rental often shows a tax loss while cash-flowing — sheltering income. Rental losses are passive: they offset passive income freely, and up to $25,000/yr can offset ordinary (W-2) income if you actively participate and your MAGI is under $100k (phasing out to $0 by $150k); unused losses carry forward. On sale, claimed depreciation is recaptured at up to 25%, and gains may owe capital-gains tax (a 1031 exchange can defer both). Figures are a year-1 estimate at your 24.0% rate — not tax advice; consult a CPA.
Schools (NCES district)
- District
- Exeter Township SD
- NCES district ID
- 4209480
- Math proficiency
- 41% ▼ -8.00%
- Reading proficiency
- 60% ▼ -11.00%
- Median HH income
- $71,744
- Composite
- 45.21/100
- National rank
- #2669
- State rank
- #141 of 539 in PA
Livability — Exeter
- Score
- 76/100
- State rank
- #392
- US rank
- #3546
Category grades
Schools grade is shown separately in the Schools card above.
Census & demographics
- Census place
- Lorane, PA
- Population (ZIP)
- 15,066
Population outlook (Berks County) Hauer SSP2
- Today (2025)
- 425,767 people
- By 2030
- 428,814 · +0.7%
- By 2040
- 433,463 · +1.8%
- By 2050
- 439,426 · +3.2%
- By 2075
- 478,647 · +12.4%
- By 2100
- 518,507 · +21.8%
Race, ethnicity, and origin ACS 2023
- Neighborhood character
- Predominantly White (90%)
- Race & ethnicity
- White 90% Two or more races 6% Hispanic / Latino 3% Black 1%
- Common ancestry
- Romanian 6% Iranian 3% Lithuanian 2%
- Foreign-born
- 1% · Canada
- Languages at home
- 98% English-only · Spanish 1% Other Indo-European 1%
Political lean MEDSL · Berks
- 2024 margin
- R (+12.2) · D 43.4% · R 55.6%
- 2008→2024 swing
- -21.4pp toward R · 2008: 9.2pp · 2024: -12.2pp
- All cycles
- 2024: R+12.2 2020: R+8.2 2016: R+10.2 2012: R+0.6 2008: D+9.2
Not yet ingested
- Civics
- —
Market trends
- HPI YoY
- ▼ -94.00%
- Current HPI
- 273.8199
- Rent YoY
- —
- Metro
- —
- State GDP YoY
- ▲ 1.68%
- F500 in state
- 34
Industry mix (Fortune 500 HQ in PA)
| Industry | F500 HQs | Revenue |
|---|---|---|
| Healthcare | 2 | $309B |
|
||
| Insurance | 2 | $27B |
|
||
| Telecommunications / Media | 1 | $124B |
|
||
| Industrial Distribution | 1 | $22B |
|
||
| Financial Services | 1 | $20B |
|
||
| Chemicals / Materials | 1 | $18B |
|
||
Cash-flow waterfall
monthlySold comps — $/sqft
last 12 mo · ≤1 miLoading sold comps…