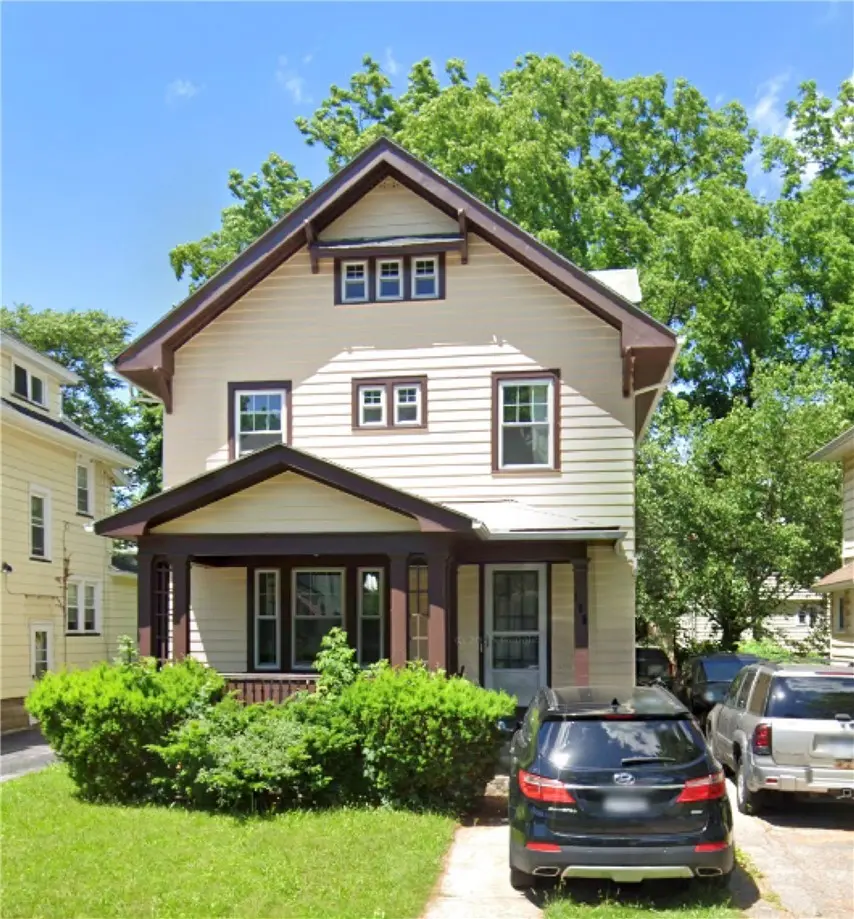
138 Ellicott St · Rochester, NY
Flood risk 4/10 · Minor
- FEMA flood zone
- X (unshaded)
- Chance of flooding over 30 yrs
- 0.2%
- Est. flood insurance / yr
- $473 – $860
Fire risk 1/10 · Minimal
- Est. fire insurance / yr
- $691 – $1,283
Heat risk 2/10 · Minimal
- Hot days now (above 96°F)
- 7 days/yr
- Hot days in 30 yrs
- 15 days/yr
Wind risk 1/10 · Minimal
- Chance of severe wind over 30 yrs
- —
Air-quality risk 2/10 · Minimal
- Unhealthy air days now
- 1 days/yr
- Unhealthy air days in 30 yrs
- 1 days/yr
Risk factors via First Street. Map © Google.
Why this score? — see what drove the D grade
The composite is a weighted blend of 9 inputs, each scored 0–100. Each bar is that input's sub-score; the figure is the points it added to the 100-point composite (weight × sub-score).
- Cash flow +15.0/30.0
- ARV discount +7.5/15.0
- 1% rule +5.0/10.0
- DSCR +5.0/10.0
- Livability +3.8/5.0
- Rent growth +2.5/5.0
- Condition / age +2.5/5.0
- Schools +1.9/10.0
- Appreciation +0.0/10.0
$34,900
🖨 Deal sheet 📄 Offer letter ✓ Due diligence
Listing remarks
PRICED WELL BELOW ASSESSED VALUE - BRING YOUR PAINTBRUSH AND YOUR VISION BOARD ——> This CLASSIC THREE BEDROOM COLONIAL in a HIGHLY SOUGHT AFTER NEIGHBORHOOD is waiting for you to restore it to the CROWN JEWEL OF THE 19TH WARD! * * * ORIGINAL CHARACTER * * * and * * * CLASSIC ARCHITECTURAL CHARM * * * can be FOUND THROUGHOUT! LARGE COVERED FRONT PORCH, BRIGHT AND CHEERY EAT-IN KITCHEN, FORMAL DINING ROOM, WELL APPOINTED LIVING SPACE with OVERSIZED FRONT WINDOW, * * * BRICK FIREPLACE with ORIGINAL BUILT-INS * * * , GUM WOOD TRIM & LEADED GLASS. The PRIMARY BEDROOM offers a * * * QUAINT SLEEPING PORCH * * * for those hot summer nights. FULL WALK-UP AT
Key facts
- Leaded glass
- Formal dining room
- Gum wood trim
Tags
Property features AI
Exterior
- Parking: Detached garage (1 car)
- Utilities: Electricity connected; Public water connected; Sewer connected; High-speed internet available
- Home design: Two-story residence; Existing (resale) property
- Construction: Composite siding; Block foundation
- Exterior features: Blacktop driveway; Fully fenced yard; Rectangular residential lot (approx. 39 x 105); City street frontage
Interior
- Kitchen: Eat-in kitchen
- Bedrooms: Total rooms: 6
- Flooring: Carpet; Hardwood; Laminate; Varies
- Bathrooms: 1 full bathroom
- Heating & cooling: Forced air gas heating
- Interior features: Separate/formal dining room; Eat-in kitchen; Separate/formal living room; Natural woodwork; Additional finished spaces (recreation, other)
- Laundry & utility: Laundry located in basement; Gas water heater
Neighborhood map
What this means for you Summary
Snapshot
- This is a 3-bed/1.0-bath single-family listed at $35k.
Deal economics
- At list price, monthly cash flow is $1k ($15k/yr) — positive.
- The deal already cash-flows at list — no discount required.
- Meets the 1% rule at list price ($2k rent vs $35k).
- Cap rate 49.8% vs local median 9.3% in Rochester — top-decile yield for the area; either an underpriced asset or a hidden risk that comps aren't pricing in. Stress-test before assuming the spread holds.
Location & tenants
- Location reads 76/100 on livability (#222 in NY, #3,482 nationally) — a middle-class / working-renter tenant base. Strengths: commute A+, cost of living A+, housing A+; Watch: schools D+, crime F, employment F.
- Rochester City School District (urban): math 21% / reading 26% proficiency, ranked #589 of 590 in NY (top 100%) — low school quality limits family demand, transient renter base, plan for 1-2y turnover; 82% free/reduced lunch — lower-income household profile, screen leases tightly.
- Market conditions: 48 active listings in the ZIP; 16 comparable units currently listed for rent nearby; rentals at typical pace (median 15d on market — plan ~3-4 weeks tenant-placement turnaround); 1,169 units permitted in Monroe County in 2024 (591 in 5+ unit buildings).
Forward outlook
- Local home prices are declining (-3.0%/yr); year-one equity from $241 of loan paydown is wiped out by about $1k of value loss. Plan a longer hold.
- Monroe County population projected to shrink 6% by 2050 — rents likely to lag national; underwrite the cash flow, not the appreciation.
- At projected returns (-3.0% appreciation + 3.0% rent growth), your $10k cash investment doubles in ~1 year — after that, you're playing with house money.
Negotiation context
- Only 7 days on market — expect competitive offers; lowballing is unlikely to land.
Risks & watch-outs
- Watch-outs: property tax is 3.6% of price; built in 1925 — expect roof / HVAC / electrical / plumbing capex.
Questions for the listing agent
- Built in 1925 — when were the roof, HVAC, electrical panel, plumbing, and water heater last replaced?
- Property tax is high relative to price — has the assessment been appealed recently, and will the sale trigger a re-assessment?
- Is there a deadline driving the sale (1031 exchange, divorce, estate, relocation)? That informs how much negotiation room exists.
- Schools are D-rated, which usually means shorter tenancies and higher turnover. Who's the typical renter profile here, and what's been the actual vacancy rate?
- Crime grade is F in this area — have there been break-ins, vandalism, or insurance claims at this property in the last 3 years? What carrier currently insures it and at what premium?
- The area grade is low — what's the realistic commute time and amenity access for the typical tenant pool here? Any planned neighborhood developments (good or bad) we should know about?
- What's the average days-on-market for RENTAL listings here right now (not sales)? A rising rental-DOM trend means longer vacancies and softer asking-rent achievability than the comps imply.
- What's the recent tenant-quality profile in this submarket — average credit score on applications, eviction rate, late-payment / NSF rate, and stable-employment percentage? A property-management company in the area should have these aggregated.
- How much new for-sale + rental construction is in the pipeline within 1–3 miles? Heavy new supply typically softens prices + rents 12–24 months out; constrained supply supports both.
Investment metrics
- 1% rule
- 5.69% ✓
- Cap rate
- 49.84%
- Cash-on-cash
- 155.52%
- DSCR
- 7.92
- GRM
- 1.5
CMA / ARV
- ARV (median comp)
- $205,576
- List price
- $34,900
- Delta
- -83.02%
- Verdict
- UNDERPRICED
- Comps
- 20 within 1.0 mi
Show comp detail 12 sales within ~0.75 mi
| Address | Dist | Beds/Ba | Sqft | Sold | Price | $/sf | Match |
|---|---|---|---|---|---|---|---|
| 138 Ellicott St | 0.00mi | 3/1.0 | 1,894 (0%) | 0mo | $123,150 | $65 | 100 |
| 14 Burlington Ave | 0.15mi | 3/1.5 | 1,721 (-9%) | 1mo | $230,000 | $134 | 75 |
| 35 Milton St | 0.32mi | 4/2.0 (+1) | 1,811 (-4%) | 4mo | $185,000 | $102 | 66 |
| 295 Terrace Park | 0.27mi | 3/2.0 | 1,685 (-11%) | 2mo | $185,000 | $110 | 63 |
| 117 Millbank St | 0.21mi | 4/2.0 (+1) | 1,639 (-14%) | 1mo | $173,000 | $106 | 58 |
| 71 Inglewood Dr | 0.65mi | 4/1.0 (+1) | 1,949 (+3%) | 3mo | $170,000 | $87 | 57 |
| 71 Aberdeen St | 0.47mi | 4/1.5 (+1) | 1,740 (-8%) | 2mo | $245,000 | $141 | 56 |
| 51 W High Ter | 0.33mi | 3/1.5 | 1,631 (-14%) | 5mo | $145,000 | $89 | 55 |
| 305 Aldine St | 0.51mi | 3/1.5 | 2,136 (+13%) | 1mo | $217,500 | $102 | 52 |
| 469 Arnett Blvd | 0.59mi | 4/2.0 (+1) | 2,060 (+9%) | 3mo | $125,000 | $61 | 47 |
| 53 Congress Ave | 0.41mi | 4/2.0 (+1) | 1,625 (-14%) | 2mo | $205,000 | $126 | 47 |
| 1283 Plymouth Ave S | 0.62mi | 4/2.0 (+1) | 1,621 (-14%) | 1mo | $200,000 | $123 | 38 |
Match score weights: distance 35% · size 25% · config 20% · recency 20%. Top-matched comps best support the ARV.
Projected returns pro-forma
-3.0% appreciation · 3.0% rent growth · sell at horizon
- IRR
- —
- Equity multiple
- 8.68×
- Total profit
- $75,075
- Equity at exit
- $5,204
- IRR
- —
- Equity multiple
- 18.35×
- Total profit
- $169,516
- Equity at exit
- $3,018
Cash invested: $9,772 (down + closing). Projections, not guarantees.
Landlord ↔ Tenant lean methodology
- Overall (STATE)
- 15 Strongly Tenant-Friendly
- State New York
- 15 Strongly Tenant-Friendly · D+10
- County
- — inherits STATE
- City
- — inherits STATE
ZIP-level market 14619
- Home prices YoY
- -10.0%
- Active inventory
- 48
- Price-to-rent
- 1.5×
Monthly cashflow live
- Estimated rent
- $1,987 high interval (Pro) →
- Mortgage (P&I)
- −$183
- Tax from tax record
- −$106 /mo · $1,269/yr
- Insurance
- −$15
- HOA
- −$0
- Vacancy / Maint / Mgmt
- −$417
- Net cashflow
- $1,266
Break-even live
UW: 25.0% down · 7.5% · 30yr · 1.5% tax · 5.0% vac · 8.0% maint · 8.0% mgmt
Financing live
Cash to close
- Down payment
- $8,725
- Closing costs
- $1,047
- Reserves months
- —
- Total cash needed
- —
Loan-product check · same deal, 3 products live
Conventional
25% down · 7.5% · 30yr
- Down + closing
- —
- Monthly P&I
- —
- Monthly cashflow
- —
- DSCR
- —
- Eligible?
- —
Personal DTI + credit; lowest rate.
DSCR
20% down · 8.5% · 30yr
- Down + closing
- —
- Monthly P&I
- —
- Monthly cashflow
- —
- DSCR
- —
- Eligible?
- —
No personal income docs; deal must DSCR.
Hard money
10% down · 12.0% · 12mo
- Down + closing
- —
- Monthly P&I
- —
- Monthly cashflow
- —
- DSCR
- —
- Eligible?
- —
Short-term bridge; refi at stabilization.
Rent comps 16 comps
| Address | Beds | Baths | Sqft | Rent | $/sqft | DOM | Units | Dist |
|---|---|---|---|---|---|---|---|---|
| 485 Sawyer St Rochester, NY | 3.0 | 1.0 | 1400 | $1,900 | $1.36 | 2d | 1 | 0.13mi |
| 485 Sawyer St Unit 1 Rochester, NY | 3.0 | 1.0 | 1400 | $1,900 | $1.36 | 43d | 1 | 0.13mi |
| 79 Evangeline St Rochester, NY | 3.0 | 2.0 | 1876 | $2,500 | $1.33 | 2d | 1 | 0.18mi |
| 793 Woodbine Ave Rochester, NY | 4.0 | 1.0 | 1700 | $2,200 | $1.29 | 2d | 1 | 0.25mi |
| 132 Anthony St Rochester, NY | 3.0 | 1.0 | 1260 | $1,500 | $1.19 | 3d | 1 | 0.34mi |
| 102 Virginia Ave Rochester, NY | 4.0 | 1.5 | 1453 | $2,150 | $1.48 | 2d | 1 | 0.38mi |
| 1317 Genesee St Rochester, NY | 3.0 | 2.0 | 1720 | $2,550 | $1.48 | 2d | 1 | 0.66mi |
| 190 Warwick Ave Rochester, NY | 3.0 | 1.5 | 1240 | $1,400 | $1.13 | 43d | 1 | 0.73mi |
| 161 Fillmore St Rochester, NY | 4.0 | 2.0 | 1612 | $1,400 | $0.87 | 14d | 1 | 0.92mi |
| 249 1/2 Columbia Ave #249 Rochester, NY | 3.0 | 1.0 | 1600 | $1,300 | $0.81 | 14d | 1 | 0.99mi |
| 32 Stanton St Rochester, NY | 3.0 | 1.0 | 1390 | $1,500 | $1.08 | 10d | 1 | 1.03mi |
| 48 Thorndale Ter Rochester, NY | 4.0 | 1.5 | 1700 | $1,400 | $0.82 | 14d | 1 | 1.04mi |
| 193 Reynolds St Rochester, NY | 3.0 | 1.5 | 1342 | $1,800 | $1.34 | 21d | 1 | 1.17mi |
| 478 Tremont St Rochester, NY | 3.0 | 2.0 | 1424 | $1,500 | $1.05 | 43d | 1 | 1.25mi |
| 175 Lattimore Rd Rochester, NY | 3.0 | 1.0 | 1480 | $2,265 | $1.53 | 14d | 1 | 1.44mi |
| 1331 Mt Hope Ave Rochester, NY | 2.0 | 1.0–2.0 | 949 | $2,725 | $2.87 | 2d | 5 | 1.47mi |
Listing history 2 events
-
2026-05-08status Pending 1115-char remark
-
2026-05-01$34,900 Active 1115-char remark
ⓘ Source: listings_history table (triggers on properties + properties_extension) + one-shot
backfill from property_details.listing_events for pre-trigger history.
Tax reassessment forecast NY · Partial reset (capped growth)
- Current annual tax
- $1,269 · $106/mo
- Projected year-2 tax
- $1,269 · $106/mo
- Expected delta
- $0/yr ($0/mo · 0.0%)
ⓘ Screening estimate from a state-policy table — verify with the county assessor before closing.
Climate risk First Street
- Flood 4/10 Moderate FEMA zone X (unshaded) · 20% chance over 30 yrs
- Wildfire 1/10 Low
- Heat 2/10 Low 7 d/yr ≥96°F today · 15 d/yr by 30 yrs out
- Wind 1/10 Low
- Air quality 2/10 Low 1 unhealthy d/yr today · 1 by 30 yrs out
Nearby sold comps map
Loading sold comps map…
Walkable amenities ~0.75 mi
Loading nearby amenities…
Taxation est. · year 1
- Rental income
- $23,845
- − Mortgage interest
- −$1,955
- − Property taxes
- −$1,269
- − Insurance
- −$174
- − Repairs & maintenance
- −$1,908
- − Management
- −$1,908
- − Depreciation
- −$1,015
- Taxable income
- $15,616
- Est. tax owed @ 24.0%
- −$3,748
- After-tax cash flow
- $11,450/yr
For passive investors: Depreciation is non-cash, so a rental often shows a tax loss while cash-flowing — sheltering income. Rental losses are passive: they offset passive income freely, and up to $25,000/yr can offset ordinary (W-2) income if you actively participate and your MAGI is under $100k (phasing out to $0 by $150k); unused losses carry forward. On sale, claimed depreciation is recaptured at up to 25%, and gains may owe capital-gains tax (a 1031 exchange can defer both). Figures are a year-1 estimate at your 24.0% rate — not tax advice; consult a CPA.
Schools (NCES district)
- District
- Rochester City School District
- NCES district ID
- 3624750
- Math proficiency
- 21% ▬ 0.00%
- Reading proficiency
- 26% ▲ 4.00%
- Median HH income
- $30,923
- Composite
- 18.98/100
- National rank
- #8850
- State rank
- #589 of 590 in NY
Livability — Rochester
- Score
- 76/100
- State rank
- #222
- US rank
- #3482
Category grades
Schools grade is shown separately in the Schools card above.
Census & demographics
- Census place
- Rochester, NY
- City population
- 432,803
- Population (ZIP)
- 14,223
Population outlook (Monroe County) Hauer SSP2
- Today (2025)
- 759,460 people
- By 2030
- 757,154 · -0.3%
- By 2040
- 740,644 · -2.5%
- By 2050
- 714,443 · -5.9%
- By 2075
- 645,883 · -15.0%
- By 2100
- 547,084 · -28.0%
Race, ethnicity, and origin ACS 2023
- Neighborhood character
- Predominantly Black (66%)
- Race & ethnicity
- Black 66% White 20% Two or more races 8% Hispanic / Latino 6% Asian 1%
- Hispanic origin (detail)
- Puerto Rican 5%
- Common ancestry
- Romanian 2% Swedish 1% Lithuanian 1%
- Foreign-born
- 8% · Canada
- Languages at home
- 92% English-only · Spanish 3% Arabic 1% French/Haitian/Cajun 1%
Political lean MEDSL · Monroe
- 2024 margin
- D (+19.1) · D 59.5% · R 40.5%
- 2008→2024 swing
- +1.4pp toward D · 2008: 17.7pp · 2024: 19.1pp
- All cycles
- 2024: D+19.1 2020: D+21.0 2016: D+14.1 2012: D+17.4 2008: D+17.7
Not yet ingested
- Civics
- —
Market trends
- HPI YoY
- ▼ -30.67%
- Current HPI
- 276.3851
- Rent YoY
- —
- Metro
- —
- State GDP YoY
- ▲ 2.60%
- F500 in state
- 92
Industry mix (Fortune 500 HQ in NY)
| Industry | F500 HQs | Revenue |
|---|---|---|
| Financial Services | 10 | $950B |
|
||
| Consumer Goods | 9 | $162B |
|
||
| Insurance | 4 | $225B |
|
||
| Telecommunications | 2 | $144B |
|
||
| Pharmaceuticals | 2 | $112B |
|
||
| Media / Entertainment | 2 | $69B |
|
||
Price history
+252.9% since first listed3 events — show timeline
- 2026-06-16 Sold (MLS) $123,150 UNYREIS
- 2026-05-08 Pending — UNYREIS
- 2026-05-01 Listed $34,900 UNYREIS
Property tax history
+5.1%/yrLatest (2025): $1,269 · -6.3% YoY. Source: county tax records.
Cash-flow waterfall
monthlySold comps — $/sqft
last 12 mo · ≤1 miLoading sold comps…