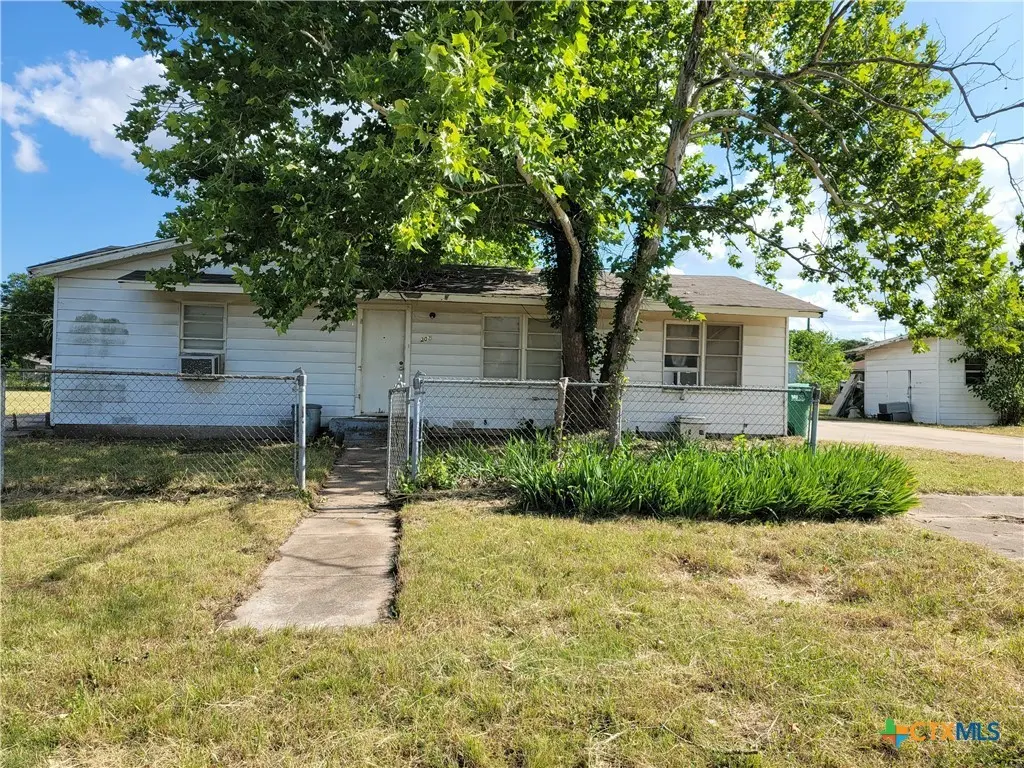
202 W Bobwhite Ln · Harker Heights, TX
Flood risk 1/10 · Minimal
- FEMA flood zone
- X (unshaded)
- Chance of flooding over 30 yrs
- 0.0%
- Est. flood insurance / yr
- $507 – $1,088
Fire risk 4/10 · Minor
- Est. fire insurance / yr
- $1,222 – $2,270
Heat risk 8/10 · Major
- Hot days now (above 107°F)
- 7 days/yr
- Hot days in 30 yrs
- 24 days/yr
Wind risk 6/10 · Moderate
- Chance of severe wind over 30 yrs
- 62.0%
Air-quality risk 1/10 · Minimal
- Unhealthy air days now
- 0 days/yr
- Unhealthy air days in 30 yrs
- 0 days/yr
Risk factors via First Street. Map © Google.
Why this score? — see what drove the B- grade
The composite is a weighted blend of 9 inputs, each scored 0–100. Each bar is that input's sub-score; the figure is the points it added to the 100-point composite (weight × sub-score).
- Cash flow +30.0/30.0
- 1% rule +10.0/10.0
- DSCR +10.0/10.0
- ARV discount +7.5/15.0
- Livability +4.0/5.0
- Schools +3.0/10.0
- Rent growth +2.7/5.0
- Condition / age +2.5/5.0
- Appreciation +0.0/10.0
$75,000
🖨 Deal sheet 📄 Offer letter ✓ Due diligence
Listing remarks
Opportunity awaits at 202 W Bobwhite Ln in Harker Heights! This 2-bedroom, 1-bath home offers approximately 1,108 sqft of living space and is ready for its next owner to add personal touches and make it shine. Featuring a functional layout and comfortable living areas, this property presents an excellent opportunity for first-time buyers, investors, or anyone looking to build equity through light cosmetic improvements. The home would benefit from new doors, interior cleaning, and fresh paint, providing a great canvas for customization. Conveniently located near shopping, dining, schools, parks, and major roadways, this property combines affordability, potential, and a desirable location. Do
Key facts
- 0.51 acre lot
- Garage
- Built 1976
Property features AI
Exterior
- Parking: 1-car garage; Garage faces rear
- Utilities: Public water; Public sewer
- Home design: Single-story home; Resale property
- Construction: Brick veneer exterior; Composition/shingle roof; Pillar/post/pier foundation; Year built per assessor
- Exterior features: Located outside city limits; Half to one acre lot
Interior
- Kitchen: Eat-in kitchen; Pantry
- Bedrooms: Bedroom 2 (Main level, 10x10); Additional bedroom (Main level, 11x11)
- Flooring: Carpet; Tile
- Bathrooms: 1 full bathroom
- Heating & cooling: Central heating; Central air conditioning
- Interior features: Ceiling fan(s); Eat-in kitchen; Pantry
Neighborhood map
What this means for you Summary
Snapshot
- This is a 2-bed/1.0-bath single-family listed at $75k.
Deal economics
- At list price, monthly cash flow is $382 ($5k/yr) — positive.
- The deal already cash-flows at list — no discount required.
- Meets the 1% rule at list price ($1k rent vs $75k).
- Cap rate 12.4% vs local median 3.8% in Harker Heights — top-decile yield for the area; either an underpriced asset or a hidden risk that comps aren't pricing in. Stress-test before assuming the spread holds.
Location & tenants
- Location reads 79/100 on livability (#61 in TX, #2,271 nationally) — a middle-class / working-renter tenant base. Strengths: cost of living A+, housing A+, health & safety A+; Watch: amenities F, commute F.
- Killeen ISD (urban): math 31% / reading 38% proficiency, ranked #524 of 826 in TX (top 63%) — families likely to look elsewhere, expect single-tenant / working-renter base with shorter leases.
- Market conditions: Rents flat; 267 active listings in the ZIP; 40 comparable units currently listed for rent nearby; rentals lingering (median 44d on market — plan ~5-8 weeks vacancy on turnover, expect pricing pressure); 65% of comp listings sitting > 30 days — soft ceiling on asking rent; solid renter incomes; 3,222 units permitted in Bell County in 2024 (246 in 5+ unit buildings).
Forward outlook
- Local home prices are declining (-3.0%/yr); year-one equity from $519 of loan paydown is wiped out by about $2k of value loss. Plan a longer hold.
- Bell County population projected at +21% by 2050 — long-run rental-demand tailwind backs the buy-and-hold thesis.
- At projected returns (-3.0% appreciation + 0.9% rent growth), your $21k cash investment doubles in ~7 years — after that, you're playing with house money.
Negotiation context
- Only 3 days on market — expect competitive offers; lowballing is unlikely to land.
Risks & watch-outs
- Watch-outs: property tax is 3.6% of price.
- Climate carrying-cost: major wind risk, 62% chance of damaging wind over 30y; extreme-heat days projected 7→24/yr by 2055 (HVAC capex compounding) — expect insurance premiums to compound above CPI over the hold.
Questions for the listing agent
- Built in 1976 — when were the roof, HVAC, electrical panel, plumbing, and water heater last replaced?
- Property tax is high relative to price — has the assessment been appealed recently, and will the sale trigger a re-assessment?
- Is there a deadline driving the sale (1031 exchange, divorce, estate, relocation)? That informs how much negotiation room exists.
- What's the average days-on-market for RENTAL listings here right now (not sales)? A rising rental-DOM trend means longer vacancies and softer asking-rent achievability than the comps imply.
- What's the recent tenant-quality profile in this submarket — average credit score on applications, eviction rate, late-payment / NSF rate, and stable-employment percentage? A property-management company in the area should have these aggregated.
- How much new for-sale + rental construction is in the pipeline within 1–3 miles? Heavy new supply typically softens prices + rents 12–24 months out; constrained supply supports both.
Investment metrics
- 1% rule
- 1.74% ✓
- Cap rate
- 12.41%
- Cash-on-cash
- 21.86%
- DSCR
- 1.97
- GRM
- 4.8
CMA / ARV
- ARV (on-the-fly)
- $150,688
- Comps found
- 4
Show comp detail 4 sales within ~0.75 mi
| Address | Dist | Beds/Ba | Sqft | Sold | Price | $/sf | Match |
|---|---|---|---|---|---|---|---|
| 211 W Robin Ln | 0.18mi | 3/2.0 (+1) | 1,116 (+1%) | 5mo | $177,000 | $159 | 77 |
| 115 E Stacie Rd | 0.44mi | 2/1.0 | 1,152 (+4%) | 7mo | $58,000 | $50 | 67 |
| 201 Clore Rd | 0.47mi | 3/2.0 (+1) | 1,104 (-0%) | 10mo | $149,999 | $136 | 60 |
| 122 W Stacie Rd | 0.24mi | 3/1.0 (+1) | 975 (-12%) | 21mo | $118,000 | $121 | 46 |
Match score weights: distance 35% · size 25% · config 20% · recency 20%. Top-matched comps best support the ARV.
Projected returns pro-forma
-3.0% appreciation · 0.93% rent growth · sell at horizon
- IRR
- 11.9%
- Equity multiple
- 1.46×
- Total profit
- $9,639
- Equity at exit
- $11,183
- IRR
- 18.9%
- Equity multiple
- 2.41×
- Total profit
- $29,668
- Equity at exit
- $6,485
Cash invested: $21,000 (down + closing). Projections, not guarantees.
Landlord ↔ Tenant lean methodology
- Overall (STATE)
- 87 Strongly Landlord-Friendly
- State Texas
- 87 Strongly Landlord-Friendly · R+5
- County
- — inherits STATE
- City
- — inherits STATE
ZIP-level market 76548
- Home prices YoY
- -25.2%
- Rents YoY
- 0.9%
- Active inventory
- 267
- Price-to-rent
- 4.8×
Monthly cashflow live
- Estimated rent
- $1,307 high interval (Pro) →
- Mortgage (P&I)
- −$393
- Tax from tax record
- −$226 /mo · $2,709/yr
- Insurance
- −$31
- HOA
- −$0
- Vacancy / Maint / Mgmt
- −$275
- Net cashflow
- $382
Break-even live
UW: 25.0% down · 7.5% · 30yr · 1.5% tax · 5.0% vac · 8.0% maint · 8.0% mgmt
Financing live
Cash to close
- Down payment
- $18,750
- Closing costs
- $2,250
- Reserves months
- —
- Total cash needed
- —
Loan-product check · same deal, 3 products live
Conventional
25% down · 7.5% · 30yr
- Down + closing
- —
- Monthly P&I
- —
- Monthly cashflow
- —
- DSCR
- —
- Eligible?
- —
Personal DTI + credit; lowest rate.
DSCR
20% down · 8.5% · 30yr
- Down + closing
- —
- Monthly P&I
- —
- Monthly cashflow
- —
- DSCR
- —
- Eligible?
- —
No personal income docs; deal must DSCR.
Hard money
10% down · 12.0% · 12mo
- Down + closing
- —
- Monthly P&I
- —
- Monthly cashflow
- —
- DSCR
- —
- Eligible?
- —
Short-term bridge; refi at stabilization.
Rent comps 40 comps
| Address | Beds | Baths | Sqft | Rent | $/sqft | DOM | Units | Dist |
|---|---|---|---|---|---|---|---|---|
| 806 White Meadow Ln Unit B Harker Heights, TX | 3.0 | 2.0 | 1390 | $1,450 | $1.04 | 44d | 1 | 0.11mi |
| 206 W Mockingbird Ln Unit D Harker Heights, TX | 2.0 | 1.0 | 958 | $795 | $0.83 | 23d | 1 | 0.22mi |
| 1102 S Ann Blvd Harker Heights, TX | 3.0 | 1.5 | 1139 | $1,350 | $1.19 | 44d | 1 | 0.24mi |
| 502 S Mary Jo Dr Harker Heights, TX | 3.0 | 2.0 | 1100 | $1,900 | $1.73 | 44d | 1 | 0.26mi |
| 505 Bonnie Dr Unit B Harker Heights, TX | 3.0 | 2.0 | 1373 | $1,300 | $0.95 | 44d | 1 | 0.26mi |
| 105 E Cardinal Ln Harker Heights, TX | 2.0 | 1.0 | 700 | $695 | $0.99 | 44d | 1 | 0.30mi |
| 700 S Amy Ln Unit 104 Harker Heights, TX | 2.0 | 1.0 | 848 | $824 | $0.97 | 44d | 1 | 0.45mi |
| 700 S Amy Ln Unit 103 Harker Heights, TX | 2.0 | 1.0 | 848 | $764 | $0.90 | 44d | 1 | 0.45mi |
| 106 W Kathey Rd Unit B Harker Heights, TX | 3.0 | 2.0 | 1336 | $1,395 | $1.04 | 23d | 1 | 0.46mi |
| 705 S Amy Ln Unit B Harker Heights, TX | 2.0 | 1.5 | 1000 | $950 | $0.95 | 44d | 1 | 0.49mi |
| 203 Dale Earnhardt Dr Unit A Harker Heights, TX | 3.0 | 2.0 | 1161 | $1,199 | $1.03 | 44d | 1 | 0.51mi |
| 409 S Amy Ln Unit C Harker Heights, TX | 3.0 | 2.0 | 1178 | $900 | $0.76 | 23d | 1 | 0.51mi |
| 406 Brittney Way Unit D Harker Heights, TX | 3.0 | 2.0 | 1154 | $950 | $0.82 | 44d | 1 | 0.54mi |
| 409 Brittney Way Harker Heights, TX | 3.0 | 2.0 | 1154 | $895 | $0.78 | 23d | 1 | 0.56mi |
| 209 Elbert Ln Unit A Harker Heights, TX | 2.0 | 2.0 | 1035 | $1,395 | $1.35 | 14d | 1 | 0.57mi |
| 219 E Beeline Ln Unit A Harker Heights, TX | 2.0 | 1.0 | 840 | $1,050 | $1.25 | 44d | 1 | 0.57mi |
| 214 Dale Earnhardt Dr Unit A Harker Heights, TX | 3.0 | 2.0 | 1161 | $1,300 | $1.12 | 23d | 1 | 0.62mi |
| 200 Randy Blvd Unit B Harker Heights, TX | 2.0 | 1.0 | 954 | $900 | $0.94 | 44d | 1 | 0.63mi |
| 221 Dale Earnhardt Dr Unit A Harker Heights, TX | 3.0 | 2.0 | 1125 | $1,300 | $1.16 | 14d | 1 | 0.65mi |
| 230 N Mary Jo Dr Apt A Harker Heights, TX | 3.0 | 2.5 | 1329 | $1,550 | $1.17 | 44d | 1 | 0.65mi |
| 220 Dale Earnhardt Dr Unit B Harker Heights, TX | 3.0 | 2.0 | 1204 | $1,147 | $0.95 | 23d | 1 | 0.66mi |
| 220 Dale Earnhardt Dr Harker Heights, TX | 3.0 | 2.0 | 1204 | $1,147 | $0.95 | 14d | 1 | 0.66mi |
| 104 W Farm to Market 2410 Rd Unit C Harker Heights, TX | 2.0 | 1.5 | 1008 | $795 | $0.79 | 44d | 1 | 0.76mi |
| 302 Jeff Gordon Dr Unit A Harker Heights, TX | 3.0 | 2.0 | 1158 | $1,195 | $1.03 | 14d | 1 | 0.77mi |
| 915 Rebecca Ln Harker Heights, TX | 3.0 | 2.0 | 1268 | $1,275 | $1.01 | 14d | 1 | 0.86mi |
| 316 Jeff Gordon Dr Unit A Harker Heights, TX | 3.0 | 2.0 | 1158 | $1,495 | $1.29 | 23d | 1 | 0.87mi |
| 316 Jeff Gordon Dr Unit B Harker Heights, TX | 3.0 | 2.0 | 1158 | $1,395 | $1.20 | 44d | 1 | 0.87mi |
| 521 E Veterans Memorial Blvd #66 Harker Heights, TX | 3.0 | 2.0 | 1216 | $1,200 | $0.99 | 44d | 1 | 1.06mi |
| 5401 Rose Garden Loop Unit A Killeen, TX | 3.0 | 2.0 | 1279 | $1,550 | $1.21 | 23d | 1 | 1.19mi |
| 5403 Rose Garden Loop Unit A Killeen, TX | 3.0 | 2.0 | 1328 | $1,550 | $1.17 | 44d | 1 | 1.20mi |
| 201 Lookout Ridge Blvd Apt 120 Harker Heights, TX | 2.0 | 2.0 | 900 | $1,145 | $1.27 | 44d | 1 | 1.26mi |
| 201 Lookout Ridge Blvd Apt 320 Harker Heights, TX | 2.0 | 2.0 | 900 | $1,045 | $1.16 | 44d | 1 | 1.27mi |
| 5415 Rose Garden Loop Unit B Killeen, TX | 3.0 | 2.0 | 1325 | $1,600 | $1.21 | 44d | 1 | 1.27mi |
| 201 Lookout Ridge Blvd Apt 321 Harker Heights, TX | 2.0 | 2.0 | 900 | $1,095 | $1.22 | 44d | 1 | 1.28mi |
| 201 Lookout Ridge Blvd Unit 224 Harker Heights, TX | 2.0 | 2.0 | 900 | $1,095 | $1.22 | 23d | 1 | 1.28mi |
| 201 Lookout Ridge Blvd Apt 223 Harker Heights, TX | 2.0 | 2.0 | 900 | $1,170 | $1.30 | 44d | 1 | 1.28mi |
| 5116 Rose Garden Loop Unit 1 Killeen, TX | 3.0 | 2.0 | 1279 | $1,650 | $1.29 | 44d | 1 | 1.29mi |
| 5116 Rose Garden Loop Killeen, TX | 3.0 | 2.0 | 1279 | $1,675 | $1.31 | 44d | 1 | 1.29mi |
| 5112 Rose Garden Loop Killeen, TX | 3.0 | 2.0 | 1245 | $1,750 | $1.41 | 44d | 1 | 1.30mi |
| 5110 Rose Garden Loop Killeen, TX | 3.0 | 2.0 | 1245 | $1,750 | $1.41 | 44d | 1 | 1.31mi |
Listing history 4 events
-
2026-06-16statusdays on market $75,000 Pending 3 DOM
-
2026-06-15days on market $75,000 Active 2 DOM
-
2026-06-14remarks 699-char remark
-
2026-06-14$75,000 Active 1 DOM
ⓘ Source: listings_history table (triggers on properties + properties_extension) + one-shot
backfill from property_details.listing_events for pre-trigger history.
Tax reassessment forecast TX · Resets to sale price
- Current annual tax
- $2,709 · $226/mo
- Projected year-2 tax
- $2,709 · $226/mo
- Expected delta
- $0/yr ($0/mo · 0.0%)
ⓘ Screening estimate from a state-policy table — verify with the county assessor before closing.
Climate risk First Street
- Flood 1/10 Low FEMA zone X (unshaded) · 0% chance over 30 yrs
- Wildfire 4/10 Moderate
- Heat 8/10 Severe 7 d/yr ≥107°F today · 24 d/yr by 30 yrs out
- Wind 6/10 Major 62% chance of damaging wind over 30 yrs
- Air quality 1/10 Low 0 unhealthy d/yr today · 0 by 30 yrs out
Nearby sold comps map
Loading sold comps map…
Walkable amenities ~0.75 mi
Loading nearby amenities…
Taxation est. · year 1
- Rental income
- $15,688
- − Mortgage interest
- −$4,201
- − Property taxes
- −$2,709
- − Insurance
- −$375
- − Repairs & maintenance
- −$1,255
- − Management
- −$1,255
- − Depreciation
- −$2,182
- Taxable income
- $3,711
- Est. tax owed @ 24.0%
- −$891
- After-tax cash flow
- $3,699/yr
For passive investors: Depreciation is non-cash, so a rental often shows a tax loss while cash-flowing — sheltering income. Rental losses are passive: they offset passive income freely, and up to $25,000/yr can offset ordinary (W-2) income if you actively participate and your MAGI is under $100k (phasing out to $0 by $150k); unused losses carry forward. On sale, claimed depreciation is recaptured at up to 25%, and gains may owe capital-gains tax (a 1031 exchange can defer both). Figures are a year-1 estimate at your 24.0% rate — not tax advice; consult a CPA.
Schools (NCES district)
- District
- Killeen ISD
- NCES district ID
- 4825660
- Math proficiency
- 31% ▼ -16.00%
- Reading proficiency
- 38% ▼ -3.00%
- Median HH income
- $47,665
- Composite
- 29.69/100
- National rank
- #6458
- State rank
- #524 of 826 in TX
Livability — Harker Heights
- Score
- 79/100
- State rank
- #61
- US rank
- #2271
Category grades
Schools grade is shown separately in the Schools card above.
Census & demographics
- Census place
- Harker Heights, TX
- County
- Bell County · 345,090 people
- City population
- 33,729
- Metro
- Killeen-Temple, TX
- Population (ZIP)
- 33,729
- Household income
- $80,520
- Rent vs Own
- Severe rent burden
- 672.0
Population outlook (Bell County) Hauer SSP2
- Today (2025)
- 371,114 people
- By 2030
- 389,104 · +4.8%
- By 2040
- 420,592 · +13.3%
- By 2050
- 447,779 · +20.7%
- By 2075
- 499,130 · +34.5%
- By 2100
- 505,680 · +36.3%
Race, ethnicity, and origin ACS 2023
- Neighborhood character
- Highly diverse neighborhood (Simpson 0.72)
- Race & ethnicity
- White 40% Black 27% Hispanic / Latino 22% Two or more races 13% Asian 3% Pacific Islander 2% Native American 1%
- Hispanic origin (detail)
- Mexican 14% Puerto Rican 3%
- Common ancestry
- Iranian 3% Lithuanian 2% Italian 2%
- Foreign-born
- 10% · Canada, Vietnam, South Korea
- Languages at home
- 83% English-only · Spanish 9% French/Haitian/Cajun 2% German/W. Germanic 1%
Political lean MEDSL · Bell
- 2024 margin
- R (+16.2) · D 41.3% · R 57.6% · Other 1.1%
- 2008→2024 swing
- -6.5pp toward R · 2008: -9.8pp · 2024: -16.2pp
- All cycles
- 2024: R+16.2 2020: R+8.5 2016: R+15.1 2012: R+16.4 2008: R+9.8
Not yet ingested
- Civics
- —
Market trends
- HPI YoY
- ▼ -52.76%
- Current HPI
- 156.4499
- Rent YoY
- ▲ 0.93%
- Metro
- Killeen-Temple, TX
- State GDP YoY
- ▲ 3.95%
- F500 in state
- 110
Industry mix (Fortune 500 HQ in TX)
| Industry | F500 HQs | Revenue |
|---|---|---|
| Energy | 16 | $1,198B |
|
||
| Technology | 5 | $198B |
|
||
| Engineering / Construction | 4 | $72B |
|
||
| Energy Services | 3 | $60B |
|
||
| Utilities | 3 | $41B |
|
||
| Healthcare | 2 | $330B |
|
||
Price history
3 events — show timeline
- 2026-06-13 Listed $75,000 CTXMLS
- 2006-12-27 Sold (Public Records) — Public Records
- 1984-11-16 Sold (Public Records) — Public Records
Property tax history
+9.3%/yrLatest (2026): $2,709 · +1.4% YoY. Source: county tax records.
Cash-flow waterfall
monthlySold comps — $/sqft
last 12 mo · ≤1 miLoading sold comps…