5180 E Sabal Palm Blvd #234 · Tamarac, FL
Flood risk 1/10 · Minimal
- FEMA flood zone
- X (unshaded)
- Chance of flooding over 30 yrs
- 0.0%
- Est. flood insurance / yr
- $507 – $1,088
Fire risk 1/10 · Minimal
- Est. fire insurance / yr
- $947 – $1,759
Heat risk 10/10 · Severe
- Hot days now (above 106°F)
- 7 days/yr
- Hot days in 30 yrs
- 27 days/yr
Wind risk 10/10 · Severe
- Chance of severe wind over 30 yrs
- 99.0%
Air-quality risk 3/10 · Minor
- Unhealthy air days now
- 3 days/yr
- Unhealthy air days in 30 yrs
- 3 days/yr
Risk factors via First Street. Map © Google.
Why this score? — see what drove the C+ grade
The composite is a weighted blend of 9 inputs, each scored 0–100. Each bar is that input's sub-score; the figure is the points it added to the 100-point composite (weight × sub-score).
- Cash flow +26.0/30.0
- 1% rule +10.0/10.0
- DSCR +8.7/10.0
- ARV discount +7.5/15.0
- Schools +4.1/10.0
- Livability +3.8/5.0
- Condition / age +2.5/5.0
- Rent growth +2.2/5.0
- Appreciation +0.0/10.0
$103,000
🖨 Deal sheet 📄 Offer letter ✓ Due diligence
Listing remarks
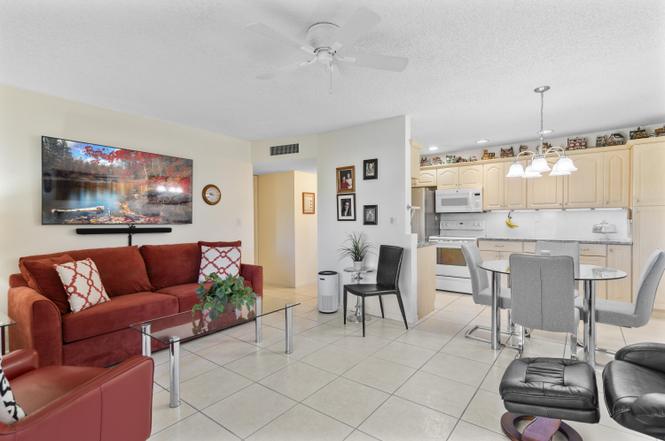
Bright & Airy well-kept 1/1 condo located at Sabal Palm Village in Tamarac, 55+ Community. This immaculate cozy unit is located on the 2nd floor, Large open concept kitchen wooden cabinets w/ additional cabinetry, newer quartz counter tops, under cabinet lighting, SS fridge & white appliances. Tile flooring throughout, A/C 2017, W/ Heater 2018, Newer impact hurricane windows. Large M/bedroom w/ custom wall closet (great for extra storing) & walk-in. Enclosed patio features impact windows, electric blinds with remote - Can be used as a Den/Office. Laundry room on premises located on same floor, unit comes w/ extra storage. The association offers a clubhouse with library, fi
Key facts
- Ss fridge
- Open concept kitchen
- White appliances
Tags
Property features AI
Finance
- Other: Building name: 5180; Living area recorded as 680; Building area total 680 (per public records)
- HOA & community: Monthly HOA fee; HOA amenities include billiard room, clubhouse, fitness center, pool, shuffleboard court, storage, tennis courts, on-site manager, community room, library, sidewalks, and street lights; Senior community; Pets not allowed
Exterior
- Utilities: Public water; Public sewer; Three-phase electric; Cable available; Sewer available; Water available
- Home design: Condominium; Resale property; Faces north; Three-story building; Entry level living area
- Construction: CBS construction
- Exterior features: Entry-level living area; Not waterfront
Interior
- Kitchen: Disposal; Dishwasher; Electric range; Microwave; Refrigerator; Water softener
- Bedrooms: One main-level bedroom
- Bathrooms: One full bathroom; One half bathroom
- Heating & cooling: Central electric heating; Central air conditioning; Ceiling fan(s)
- Interior features: Entrance foyer; Walk-in closet(s); Closet cabinetry; Unfurnished
Neighborhood map
What this means for you Summary
Snapshot
- This is a 1-bed/2.0-bath condo listed at $103k.
Deal economics
- At list price, monthly cash flow is $256 ($3k/yr) — positive.
- The deal already cash-flows at list — no discount required.
- Meets the 1% rule at list price ($2k rent vs $103k).
- Recommended offer: $94k (9.0% below list) — sets the bar for market timing.
- Cap rate 9.3% vs local median 3.9% in Tamarac — top-decile yield for the area; either an underpriced asset or a hidden risk that comps aren't pricing in. Stress-test before assuming the spread holds.
Location & tenants
- Location reads 76/100 on livability (#239 in FL, #3,785 nationally) — a middle-class / working-renter tenant base. Strengths: housing A+, health & safety A+, cost of living A-; Watch: employment C-, amenities F, commute F.
- Broward (suburban): math 42% / reading 53% proficiency, ranked #46 of 73 in FL (top 63%) — families likely to look elsewhere, expect single-tenant / working-renter base with shorter leases.
- Zoned schools: Broadview Elementary School (math 29% / reading 38%, grade F, #1,758 of 2,144 statewide, top 83%, 742 students, 86% FRL); Lauderdale Lakes Middle School (math 21% / reading 26%, grade F, #536 of 571 statewide, top 95%, 816 students, 79% FRL); Boyd H. Anderson High School (math 10% / reading 14%, grade F, #622 of 667 statewide, top 93%, 2,038 students, 72% FRL) — zoned schools average 79% FRL vs 51% district-wide (28 pts higher); higher-poverty schools than district average — tighter screening recommended.
- Zoned-school proficiency averages 23% at this address vs 48% district-wide (-24 pts) — the specific schools serving this property underperform the Broward average; the district grade overstates school quality for this exact location.
- Market conditions: Rents soft (-1.4%/yr); 821 active listings in the ZIP; 34 comparable units currently listed for rent nearby; rentals at typical pace (median 14d on market — plan ~3-4 weeks tenant-placement turnaround); 2,111 units permitted in Broward County in 2024 (1,265 in 5+ unit buildings).
Forward outlook
- Local home prices are declining (-3.0%/yr); year-one equity from $712 of loan paydown is wiped out by about $3k of value loss. Plan a longer hold.
- Broward County population projected at +34% by 2050 — long-run rental-demand tailwind backs the buy-and-hold thesis.
Negotiation context
- It's been on market 107 days — a 9% lower offer ($94k) is reasonable based on typical stale-listing flexibility.
- 4 sale attempts since 11y ago; this cycle's ask has dropped $7k (6%) from the opening price — seller is motivated, your offer sets the floor, not the list.
- Current owner paid $45k; list at $103k implies a 129% gain — meaningful room to come down on a strong offer.
Risks & watch-outs
- Watch-outs: HOA is 22% of rent.
- Climate carrying-cost: severe wind risk, 99% chance of damaging wind over 30y; extreme-heat days projected 7→27/yr by 2055 (HVAC capex compounding) — expect insurance premiums to compound above CPI over the hold.
Questions for the listing agent
- It's been on market 107 days. Have you received any prior offers? Is the seller open to a 9% concession, seller financing, or rate buy-down credit?
- Built in 1974 — when were the roof, HVAC, electrical panel, plumbing, and water heater last replaced?
- What does the HOA fee cover, when was the last increase, and are there any pending special assessments or reserve-fund shortfalls?
- Any open or pending special assessments — roof, HVAC, plumbing, elevator, façade? What's the per-unit balance and payoff schedule, and is the seller paying it off at close or rolling it to the buyer?
- Why hasn't it sold? Are there any deal-killer items the seller is aware of (foundation, flood, title, zoning, code violations)?
- Is there a deadline driving the sale (1031 exchange, divorce, estate, relocation)? That informs how much negotiation room exists.
- Schools are B-rated — typically a magnet for longer-tenancy family renters. What's the average tenant stay here, and is there a school-zone premium baked into asking?
- What's the average days-on-market for RENTAL listings here right now (not sales)? A rising rental-DOM trend means longer vacancies and softer asking-rent achievability than the comps imply.
- What's the recent tenant-quality profile in this submarket — average credit score on applications, eviction rate, late-payment / NSF rate, and stable-employment percentage? A property-management company in the area should have these aggregated.
- How much new apartment / multifamily construction is in the pipeline within 1–3 miles? Heavy new supply (>2% of stock underway) typically softens rents 12–24 months out; light construction supports rent growth.
Investment metrics
- 1% rule
- 1.59% ✓
- Cap rate
- 9.28%
- Cash-on-cash
- 10.67%
- DSCR
- 1.47
- GRM
- 5.2
CMA / ARV
No comps found within radius.
Projected returns pro-forma
-3.0% appreciation · 0.0% rent growth · sell at horizon
- IRR
- -4.8%
- Equity multiple
- 0.83×
- Total profit
- $-4,945
- Equity at exit
- $15,358
- IRR
- -0.6%
- Equity multiple
- 0.97×
- Total profit
- $-955
- Equity at exit
- $8,906
Cash invested: $28,840 (down + closing). Projections, not guarantees.
Landlord ↔ Tenant lean methodology
- Overall (STATE)
- 87 Strongly Landlord-Friendly
- State Florida
- 87 Strongly Landlord-Friendly · R+3
- County
- — inherits STATE
- City
- — inherits STATE
ZIP-level market 33319
- Rents YoY
- -1.4%
- Active inventory
- 821
- Price-to-rent
- 5.2×
Monthly cashflow live
- Estimated rent
- $1,642 high interval (Pro) →
- Mortgage (P&I)
- −$540
- Tax from tax record
- −$98 /mo · $1,176/yr
- Insurance
- −$43
- HOA
- −$360
- Vacancy / Maint / Mgmt
- −$345
- Net cashflow
- $256
Break-even live
UW: 25.0% down · 7.5% · 30yr · 1.5% tax · 5.0% vac · 8.0% maint · 8.0% mgmt
Financing live
Cash to close
- Down payment
- $25,750
- Closing costs
- $3,090
- Reserves months
- —
- Total cash needed
- —
Loan-product check · same deal, 3 products live
Conventional
25% down · 7.5% · 30yr
- Down + closing
- —
- Monthly P&I
- —
- Monthly cashflow
- —
- DSCR
- —
- Eligible?
- —
Personal DTI + credit; lowest rate.
DSCR
20% down · 8.5% · 30yr
- Down + closing
- —
- Monthly P&I
- —
- Monthly cashflow
- —
- DSCR
- —
- Eligible?
- —
No personal income docs; deal must DSCR.
Hard money
10% down · 12.0% · 12mo
- Down + closing
- —
- Monthly P&I
- —
- Monthly cashflow
- —
- DSCR
- —
- Eligible?
- —
Short-term bridge; refi at stabilization.
Rent comps 34 comps
| Address | Beds | Baths | Sqft | Rent | $/sqft | DOM | Units | Dist |
|---|---|---|---|---|---|---|---|---|
| 5780 Rock Island Rd #360 Tamarac, FL | 1.0 | 1.0 | 690 | $1,750 | $2.54 | 4d | 1 | 0.07mi |
| 5780 Rock Island Rd #360 Tamarac, FL | 1.0 | 1.0 | 690 | $1,750 | $2.54 | 7d | 1 | 0.07mi |
| 5760 Rock Island Rd Tamarac, FL | 1.0–2.0 | 1.0–2.0 | 655 | $1,599 | $2.44 | 10d | 3 | 0.08mi |
| 5760 Rock Island Rd Tamarac, FL | 1.0–2.0 | 1.0–2.0 | 655 | $1,575 | $2.40 | 4d | 3 | 0.08mi |
| 5740 Rock Island Rd Tamarac, FL | 1.0 | 1.0 | 722 | $1,722 | $2.38 | 24d | 1 | 0.12mi |
| 5740 Rock Island Rd #299 Tamarac, FL | 1.0 | 1.0 | 750 | $1,895 | $2.53 | 14d | 1 | 0.12mi |
| 5686 Rock Island Rd Tamarac, FL | 1.0 | 1.0 | 655 | $1,675 | $2.56 | 15d | 2 | 0.14mi |
| 5672 Rock Island Rd Tamarac, FL | 1.0 | 1.0 | 717 | $1,748 | $2.44 | 3d | 2 | 0.16mi |
| 5612 Rock Island Rd #154 Tamarac, FL | 1.0 | 1.0 | 695 | $1,690 | $2.43 | 15d | 1 | 0.22mi |
| 5628 Rock Island Rd Tamarac, FL | 1.0–2.0 | 1.0–2.0 | 867 | $1,700 | $1.96 | 5d | 2 | 0.26mi |
| 4033 Lakeside Dr #4033 Tamarac, FL | 2.0 | 1.0 | 720 | $1,700 | $2.36 | 24d | 1 | 0.86mi |
| 4010 Lakeside Dr #4010 Tamarac, FL | 2.0 | 1.0 | 720 | $1,700 | $2.36 | 1d | 1 | 0.86mi |
| 4010 Lakeside Dr #4010 Tamarac, FL | 2.0 | 1.0 | 720 | $1,750 | $2.43 | 17d | 1 | 0.86mi |
| 4016 Lakeside Dr Unit 4016 Tamarac, FL | 2.0 | 1.0 | 720 | $1,800 | $2.50 | 11d | 1 | 0.86mi |
| 6150 NW 62nd St Tamarac, FL | 1.0 | 1.0 | 660 | $1,525 | $2.31 | 24d | 2 | 0.86mi |
| 6021 NW 61st Ave #207 Tamarac, FL | 1.0 | 1.0 | 660 | $1,350 | $2.05 | 2d | 1 | 0.89mi |
| 5851 NW 62nd Ave #305 Tamarac, FL | 1.0 | 1.0 | 660 | $1,500 | $2.27 | 24d | 1 | 0.90mi |
| 5940 NW 64th Ave #106 Fort Lauderdale, FL | 1.0 | 1.0 | 660 | $1,400 | $2.12 | 24d | 1 | 0.94mi |
| 5801 NW 62nd Ave #106 Tamarac, FL | 1.0 | 1.0 | 660 | $1,350 | $2.05 | 24d | 1 | 0.94mi |
| 5890 NW 64th Ave #308 Tamarac, FL | 1.0 | 1.0 | 660 | $1,500 | $2.27 | 2d | 1 | 0.94mi |
| 1400 Avon Ln North Lauderdale, FL | 1.0–3.0 | 1.0–2.0 | 1070 | $1,637 | $1.53 | 2d | 58 | 0.95mi |
| 6050 NW 64th Ave #307 Fort Lauderdale, FL | 1.0 | 1.0 | 660 | $1,375 | $2.08 | 24d | 1 | 0.95mi |
| 5860 NW 64th Ave Tamarac, FL | 1.0–2.0 | 1.0–2.0 | 770 | $1,485 | $1.93 | 24d | 2 | 0.99mi |
| 5860 NW 64th Ave Tamarac, FL | 1.0–2.0 | 1.0–2.0 | 770 | $1,450 | $1.88 | 7d | 3 | 0.99mi |
| 6020 NW 64th Ave Tamarac, FL | 1.0–2.0 | 1.0–2.0 | 770 | $1,425 | $1.85 | 24d | 4 | 1.00mi |
| 6020 NW 64th Ave Tamarac, FL | 1.0–2.0 | 1.0–2.0 | 770 | $1,400 | $1.82 | 4d | 3 | 1.00mi |
| 6300 NW 62nd St Tamarac, FL | 1.0–2.0 | 1.0–2.0 | 770 | $1,350 | $1.75 | 2d | 3 | 1.01mi |
| 5750 NW 64th Ave #305 Tamarac, FL | 1.0 | 1.0 | 660 | $1,650 | $2.50 | 20d | 1 | 1.02mi |
| 6000 NW 64th Ave #106 Fort Lauderdale, FL | 1.0 | 1.0 | 660 | $1,450 | $2.20 | 7d | 1 | 1.03mi |
| 7575 Hampton Blvd North Lauderdale, FL | 1.0 | 1.0 | 720 | $1,815 | $2.52 | 3d | 5 | 1.15mi |
| 8140 SW 22nd St North Lauderdale, FL | 1.0 | 1.5 | 695 | $1,527 | $2.20 | 18d | 1 | 1.20mi |
| 8140 SW 22nd St North Lauderdale, FL | 1.0–2.0 | 1.5–2.0 | 764 | $1,672 | $2.19 | 16d | 2 | 1.20mi |
| 7900 Hampton Blvd North Lauderdale, FL | 1.0–2.0 | 1.0–2.0 | 925 | $1,748 | $1.89 | 2d | 35 | 1.32mi |
| 5600 SW 12th St North Lauderdale, FL | 1.0–3.0 | 1.0–2.0 | 892 | $1,750 | $1.96 | 18d | 3 | 1.43mi |
HOA detail condo
- Monthly dues
- $360 · $4,320/yr
- Likely covers
- electric
- Assessments
- None detected in remarks — confirm with the listing agent.
Listing history 28 events
-
2026-06-18days on market $103,000 Active 107 DOM
-
2026-06-17days on market $103,000 Active 106 DOM
-
2026-06-16days on market $103,000 Active 105 DOM
-
2026-06-15days on market $103,000 Active 104 DOM
-
2026-06-13days on market $103,000 Active 102 DOM
-
2026-06-09days on market $103,000 Active 98 DOM
-
2026-06-07days on market $103,000 Active 96 DOM
-
2026-06-04days on market $103,000 Active 93 DOM
-
2026-06-03days on market $103,000 Active 92 DOM
-
2026-06-02days on market $103,000 Active 91 DOM
-
2026-06-01days on market $103,000 Active 90 DOM
-
2026-05-31days on market $103,000 Active 89 DOM
-
2026-04-13price $103,000
-
2026-03-02$110,000 Active
-
2026-02-28historical
-
2025-08-30$110,000 Active
-
2025-08-27historical
-
2025-07-21price $110,000
-
2025-04-10price $120,000
-
2025-03-03$110,000 Active
-
2015-04-30soldstatus $45,000 Sold
-
2015-04-30soldstatus $45,000
-
2015-03-10status Pending
-
2015-02-12price $48,000
-
2015-01-20$55,000 Active
-
2008-09-08soldstatus $60,000
-
2000-08-22soldstatus $15,000
-
1986-01-01soldstatus $30,000
ⓘ Source: listings_history table (triggers on properties + properties_extension) + one-shot
backfill from property_details.listing_events for pre-trigger history.
Tax reassessment forecast FL · Resets to sale price
- Current annual tax
- $1,176 · $98/mo
- Projected year-2 tax
- $1,176 · $98/mo
- Expected delta
- $0/yr ($0/mo · 0.0%)
ⓘ Screening estimate from a state-policy table — verify with the county assessor before closing.
Climate risk First Street
- Flood 1/10 Low FEMA zone X (unshaded) · 0% chance over 30 yrs
- Wildfire 1/10 Low
- Heat 10/10 Extreme 7 d/yr ≥106°F today · 27 d/yr by 30 yrs out
- Wind 10/10 Extreme 99% chance of damaging wind over 30 yrs
- Air quality 3/10 Moderate 3 unhealthy d/yr today · 3 by 30 yrs out
Nearby sold comps map
Loading sold comps map…
Walkable amenities ~0.75 mi
Loading nearby amenities…
Taxation est. · year 1
- Rental income
- $19,709
- − Mortgage interest
- −$5,770
- − Property taxes
- −$1,176
- − Insurance
- −$515
- − Repairs & maintenance
- −$1,577
- − Management
- −$1,577
- − HOA
- −$4,320
- − Depreciation
- −$2,996
- Taxable income
- $1,778
- Est. tax owed @ 24.0%
- −$427
- After-tax cash flow
- $2,650/yr
For passive investors: Depreciation is non-cash, so a rental often shows a tax loss while cash-flowing — sheltering income. Rental losses are passive: they offset passive income freely, and up to $25,000/yr can offset ordinary (W-2) income if you actively participate and your MAGI is under $100k (phasing out to $0 by $150k); unused losses carry forward. On sale, claimed depreciation is recaptured at up to 25%, and gains may owe capital-gains tax (a 1031 exchange can defer both). Figures are a year-1 estimate at your 24.0% rate — not tax advice; consult a CPA.
Schools (NCES district)
- District
- Broward
- NCES district ID
- 1200180
- Math proficiency
- 42% ▼ -18.00%
- Reading proficiency
- 53% ▼ -5.00%
- Median HH income
- $52,139
- Composite
- 40.88/100
- National rank
- #3621
- State rank
- #46 of 73 in FL
Livability — Tamarac
- Score
- 76/100
- State rank
- #239
- US rank
- #3785
Category grades
Schools grade is shown separately in the Schools card above.
Census & demographics
- Census place
- Tamarac, FL
- County
- Broward County · 1,963,430 people
- Metro
- Miami-Fort Lauderdale-Pompano Beach, FL
- Population (ZIP)
- 54,450
- Household income
- $58,388
- Rent vs Own
- Severe rent burden
- 2809.0
Population outlook (Broward County) Hauer SSP2
- Today (2025)
- 2,207,033 people
- By 2030
- 2,360,704 · +7.0%
- By 2040
- 2,661,208 · +20.6%
- By 2050
- 2,946,698 · +33.5%
- By 2075
- 3,602,273 · +63.2%
- By 2100
- 3,970,984 · +79.9%
Race, ethnicity, and origin ACS 2023
- Neighborhood character
- Diverse neighborhood (Simpson 0.58)
- Race & ethnicity
- Black 61% Hispanic / Latino 17% White 15% Two or more races 11% Asian 4%
- Hispanic origin (detail)
- Puerto Rican 4% Cuban 2% Dominican 1%
- Common ancestry
- Hispanic 13% Romanian 1% Italian 1%
- Foreign-born
- 46% · Canada, Jamaica, Vietnam
- Languages at home
- 64% English-only · Spanish 15% French/Haitian/Cajun 15% Other Indo-European 2%
Political lean MEDSL · Broward
- 2024 margin
- D (+17.0) · D 58.0% · R 41.0%
- 2008→2024 swing
- -17.8pp toward R · 2008: 34.7pp · 2024: 17.0pp
- All cycles
- 2024: D+17.0 2020: D+29.8 2016: D+35.0 2012: D+34.9 2008: D+34.7
Not yet ingested
- Civics
- —
Market trends
- HPI YoY
- ▼ -202.84%
- Current HPI
- 328.4307
- Rent YoY
- ▼ -1.38%
- Metro
- Miami-Fort Lauderdale-Pompano Beach, FL
- State GDP YoY
- ▲ 3.28%
- F500 in state
- 36
Industry mix (Fortune 500 HQ in FL)
| Industry | F500 HQs | Revenue |
|---|---|---|
| Industrial Technology | 2 | $29B |
|
||
| Insurance | 2 | $17B |
|
||
| Retail | 1 | $60B |
|
||
| Technology Distribution | 1 | $58B |
|
||
| Homebuilding | 1 | $35B |
|
||
| Technology Manufacturing | 1 | $35B |
|
||
Price history
+243.3% since first listed16 events — show timeline
- 2026-04-13 Price Changed $103,000 Beaches MLS
- 2026-03-02 Listed $110,000 Beaches MLS
- 2026-02-28 Listing Removed — Beaches MLS
- 2025-08-30 Listed $110,000 Beaches MLS
- 2025-08-27 Listing Removed — Beaches MLS
- 2025-07-21 Price Changed $110,000 Beaches MLS
- 2025-04-10 Price Changed $120,000 Beaches MLS
- 2025-03-03 Listed $110,000 Beaches MLS
- 2015-04-30 Sold (MLS) $45,000 MARMLS
- 2015-04-30 Sold (Public Records) $45,000 Public Records
- 2015-03-10 Pending — MARMLS
- 2015-02-12 Price Changed $48,000 MARMLS
- 2015-01-20 Listed $55,000 MARMLS
- 2008-09-08 Sold (Public Records) $60,000 Public Records
- 2000-08-22 Sold (Public Records) $15,000 Public Records
- 1986-01-01 Sold (Public Records) $30,000 Public Records
Property tax history
+4.0%/yrLatest (2025): $1,176 · +3.8% YoY. Source: county tax records.
Cash-flow waterfall
monthlySold comps — $/sqft
last 12 mo · ≤1 miLoading sold comps…