 Fourplex
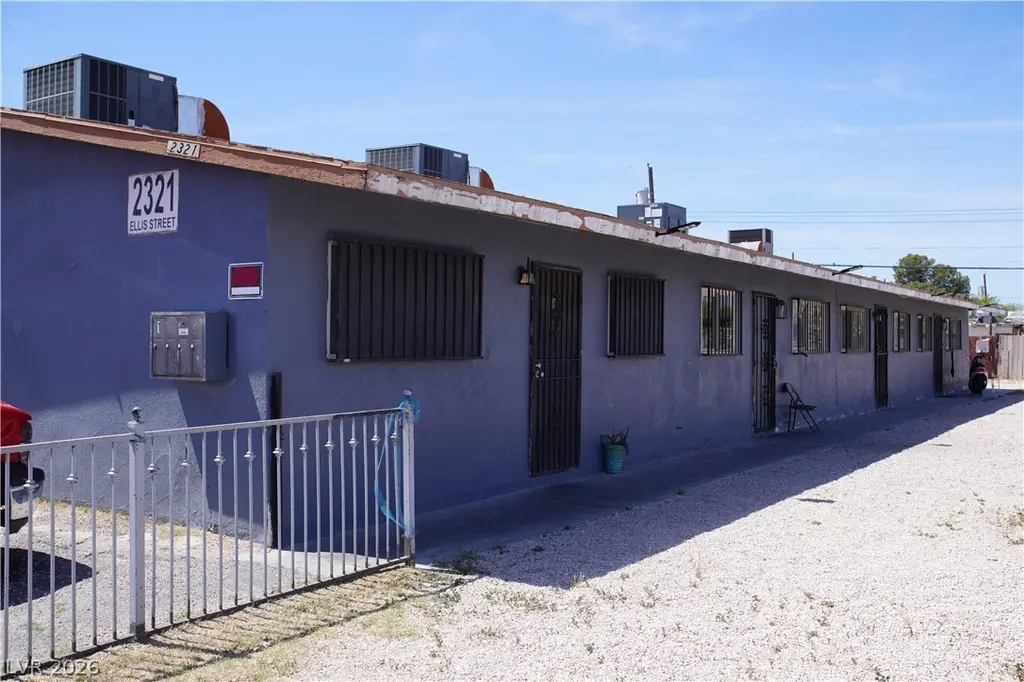
2321 Ellis St · North Las Vegas, NV
Flood risk 1/10 · Minimal
- FEMA flood zone
- X (unshaded)
- Chance of flooding over 30 yrs
- 0.0%
- Est. flood insurance / yr
- $507 – $1,088
Fire risk 1/10 · Minimal
- Est. fire insurance / yr
- $490 – $910
Heat risk 8/10 · Major
- Hot days now (above 108°F)
- 7 days/yr
- Hot days in 30 yrs
- 19 days/yr
Wind risk 1/10 · Minimal
- Chance of severe wind over 30 yrs
- —
Air-quality risk 4/10 · Minor
- Unhealthy air days now
- 4 days/yr
- Unhealthy air days in 30 yrs
- 5 days/yr
Risk factors via First Street. Map © Google.
Why this score? — see what drove the D grade
The composite is a weighted blend of 9 inputs, each scored 0–100. Each bar is that input's sub-score; the figure is the points it added to the 100-point composite (weight × sub-score).
- Cash flow +15.1/30.0
- ARV discount +7.5/15.0
- DSCR +4.6/10.0
- Livability +3.7/5.0
- Rent growth +3.3/5.0
- 1% rule +2.8/10.0
- Schools +2.6/10.0
- Condition / age +2.5/5.0
- Appreciation +0.0/10.0
$619,000
🖨 Deal sheet (PDF) 📄 Offer letter ✓ Due diligence
Multi-family units
County records classify this as Multi-Family (2-4 Unit). Listing-text estimate: 4 units. confirmed
Listing remarks MLS
2321 Ellis Street in North Las Vegas, NV 89030 is a single-story fourplex built in 1963, featuring four 2-bedroom, 1-bath units (total 8 beds, 4 baths) with tile flooring, basic appliances, on-site laundry, and ample parking. Conveniently located near schools, shopping, and transit, it offers a solid income-producing opportunity with strong rental potential.
Key facts
- Ample parking
- Tile flooring
- On-site laundry
Tags
Neighborhood map
What this means for you Summary
Snapshot
- This is a 4 × 2-bed/1.0-bath units multifamily listed at $619k.
Deal economics
- At list price, monthly cash flow is $202 ($2k/yr) — positive. Per door: $50/mo.
- The deal already cash-flows at list — no discount required.
- To meet the 1% rule (rent ≥ 1% of price), the offer needs to be $482k (22.1% below list).
- Recommended offer: $482k (22.1% below list) — sets the bar for 1% rule.
Location & tenants
- Location reads 74/100 on livability (#14 in NV, #4,471 nationally) — a middle-class / working-renter tenant base. Strengths: commute A+, housing A+, cost of living B; Watch: crime D+, schools F, amenities F.
- Clark County School District (urban): math 21% / reading 39% proficiency, ranked #11 of 17 in NV (top 65%) — families likely to look elsewhere, expect single-tenant / working-renter base with shorter leases.
- Market conditions: Rents rising (+3.0%/yr); 151 active listings in the ZIP; 14,754 units permitted in Clark County in 2024 (2,301 in 5+ unit buildings).
- At $4,825/mo this rent would consume 121% of the median local household income ($48k/yr) (locally 2821% of renters already pay >50% of income on rent) — very limited rent-growth headroom before tenants either downsize or default.
Forward outlook
- Local home prices are declining (-3.0%/yr); year-one equity from $4k of loan paydown is wiped out by about $19k of value loss. Plan a longer hold.
- Clark County population projected at +36% by 2050 — long-run rental-demand tailwind backs the buy-and-hold thesis.
Negotiation context
- It's been on market 58 days — a 3% lower offer ($600k) is reasonable based on typical stale-listing flexibility.
- 5 sale attempts since 16y ago; this cycle's ask has dropped $51k (8%) from the opening price — seller is motivated, your offer sets the floor, not the list.
Risks & watch-outs
- Climate carrying-cost: extreme-heat days projected 7→19/yr by 2055 (HVAC capex compounding) — expect insurance premiums to compound above CPI over the hold.
Questions for the listing agent
- It's been on market 58 days. Have you received any prior offers? Is the seller open to a 22% concession, seller financing, or rate buy-down credit?
- Can we see the unit-by-unit rent roll, current vacancy, and any below-market leases? What's the average tenancy length?
- What capital expenditures (roof, boiler, parking lot, exteriors) have been made in the last 5 years, and what's planned in the next 2?
- Built in 1963 — when were the roof, HVAC, electrical panel, plumbing, and water heater last replaced?
- Is there a deadline driving the sale (1031 exchange, divorce, estate, relocation)? That informs how much negotiation room exists.
- Schools are F-rated, which usually means shorter tenancies and higher turnover. Who's the typical renter profile here, and what's been the actual vacancy rate?
- Crime grade is D in this area — have there been break-ins, vandalism, or insurance claims at this property in the last 3 years? What carrier currently insures it and at what premium?
- The area grade is low — what's the realistic commute time and amenity access for the typical tenant pool here? Any planned neighborhood developments (good or bad) we should know about?
- What's the average days-on-market for RENTAL listings here right now (not sales)? A rising rental-DOM trend means longer vacancies and softer asking-rent achievability than the comps imply.
- What's the recent tenant-quality profile in this submarket — average credit score on applications, eviction rate, late-payment / NSF rate, and stable-employment percentage? A property-management company in the area should have these aggregated.
- How much new apartment / multifamily construction is in the pipeline within 1–3 miles? Heavy new supply (>2% of stock underway) typically softens rents 12–24 months out; light construction supports rent growth.
Investment metrics
- 1% rule
- 0.78% ✗
- Cap rate
- 6.68%
- Cash-on-cash
- 1.40%
- DSCR
- 1.06
- GRM
- 10.7
CMA / ARV
No comps found within radius.
Projected returns pro-forma
-3.0% appreciation · 3.04% rent growth · sell at horizon
- IRR
- -14.1%
- Equity multiple
- 0.49×
- Total profit
- $-87,614
- Equity at exit
- $92,295
- IRR
- -5.4%
- Equity multiple
- 0.65×
- Total profit
- $-60,340
- Equity at exit
- $53,520
Cash invested: $173,320 (down + closing). Projections, not guarantees.
Landlord ↔ Tenant lean methodology
- Overall (STATE)
- 71 Landlord-Friendly
- State Nevada
- 71 Landlord-Friendly · R+1
- County
- — inherits STATE
- City
- — inherits STATE
ZIP-level market 89030
- Home prices YoY
- -27.7%
- Rents YoY
- 3.0%
- Active inventory
- 151
- Price-to-rent
- 42.8×
Monthly cashflow live
- Estimated rent
- $4,825 high interval (Pro) →
- Mortgage (P&I)
- −$3,246
- Tax from tax record
- −$106 /mo · $1,275/yr
- Insurance
- −$258
- HOA
- −$0
- Vacancy / Maint / Mgmt
- −$1,013
- Net cashflow
- $202
Break-even live
Sensitivity live
| Price | -10% $552 | -5% $377 | +0% $202 | +5% $-680 | +10% $-894 |
|---|---|---|---|---|---|
| Rent | -10% $-180 | -5% $11 | +0% $202 | +5% $392 | +10% $583 |
| Rate | -1.0pp $513 | -0.5pp $359 | base $202 | +0.5pp $41 | +1.0pp $-122 |
4-unit breakdown (identical units grouped — click to expand)
| Units | Beds | Baths | Est. rent |
|---|---|---|---|
| 4× units | 2 | 1 | $4,824 |
| #1 | 2 | 1 | $1,206 |
| #2 | 2 | 1 | $1,206 |
| #3 | 2 | 1 | $1,206 |
| #4 | 2 | 1 | $1,206 |
| Total (4 units) | $4,825 | ||
UW: 25.0% down · 7.5% · 30yr · 1.5% tax · 5.0% vac · 8.0% maint · 8.0% mgmt
Financing live
Cash to close
- Down payment
- $154,750
- Closing costs
- $18,570
- Reserves months
- —
- Total cash needed
- —
Loan-product check · same deal, 3 products live
Conventional
25% down · 7.5% · 30yr
- Down + closing
- —
- Monthly P&I
- —
- Monthly cashflow
- —
- DSCR
- —
- Eligible?
- —
Personal DTI + credit; lowest rate.
DSCR
20% down · 8.5% · 30yr
- Down + closing
- —
- Monthly P&I
- —
- Monthly cashflow
- —
- DSCR
- —
- Eligible?
- —
No personal income docs; deal must DSCR.
Hard money
10% down · 12.0% · 12mo
- Down + closing
- —
- Monthly P&I
- —
- Monthly cashflow
- —
- DSCR
- —
- Eligible?
- —
Short-term bridge; refi at stabilization.
Listing history 37 events
-
2026-06-18days on market $619,000 Active 58 DOM
-
2026-06-17days on market $619,000 Active 57 DOM
-
2026-06-16days on market $619,000 Active 56 DOM
-
2026-06-15days on market $619,000 Active 55 DOM
-
2026-06-13days on market $619,000 Active 53 DOM
-
2026-06-09days on market $619,000 Active 49 DOM
-
2026-06-08days on market $619,000 Active 48 DOM
-
2026-06-07days on market $619,000 Active 47 DOM
-
2026-06-03days on market $619,000 Active 43 DOM
-
2026-06-02days on market $619,000 Active 42 DOM
-
2026-06-01days on market $619,000 Active 41 DOM
-
2026-05-31pricedays on market $619,000 Active 40 DOM
-
2026-05-07price $659,000 360-char remark
Show marketing remark (360 chars)
2321 Ellis Street in North Las Vegas, NV 89030 is a single-story fourplex built in 1963, featuring four 2-bedroom, 1-bath units (total 8 beds, 4 baths) with tile flooring, basic appliances, on-site laundry, and ample parking. Conveniently located near schools, shopping, and transit, it offers a solid income-producing opportunity with strong rental potential.
-
2026-04-20$670,000 Active 360-char remark
Show marketing remark (360 chars)
2321 Ellis Street in North Las Vegas, NV 89030 is a single-story fourplex built in 1963, featuring four 2-bedroom, 1-bath units (total 8 beds, 4 baths) with tile flooring, basic appliances, on-site laundry, and ample parking. Conveniently located near schools, shopping, and transit, it offers a solid income-producing opportunity with strong rental potential.
-
2024-11-06soldstatus $589,000 Closed 441-char remark
Show marketing remark (441 chars)
Welcome to 2321 Ellis St, a well-maintained fourplex offering four 2-bedroom, 1-bath units, each featuring modern upgrades, open living spaces, and on-site laundry. With ample parking and a prime location near schools, shopping, and public transport, this property is perfect for investors seeking steady rental income and low vacancy rates. Don’t miss out on this excellent investment opportunity in a growing area of North Las Vegas!
-
2024-11-06soldstatus $589,000
Show marketing remark (441 chars)
Welcome to 2321 Ellis St, a well-maintained fourplex offering four 2-bedroom, 1-bath units, each featuring modern upgrades, open living spaces, and on-site laundry. With ample parking and a prime location near schools, shopping, and public transport, this property is perfect for investors seeking steady rental income and low vacancy rates. Don’t miss out on this excellent investment opportunity in a growing area of North Las Vegas!
-
2024-09-16historical Active Under Contract 441-char remark
Show marketing remark (441 chars)
Welcome to 2321 Ellis St, a well-maintained fourplex offering four 2-bedroom, 1-bath units, each featuring modern upgrades, open living spaces, and on-site laundry. With ample parking and a prime location near schools, shopping, and public transport, this property is perfect for investors seeking steady rental income and low vacancy rates. Don’t miss out on this excellent investment opportunity in a growing area of North Las Vegas!
-
2024-08-09price $595,000 441-char remark
Show marketing remark (441 chars)
Welcome to 2321 Ellis St, a well-maintained fourplex offering four 2-bedroom, 1-bath units, each featuring modern upgrades, open living spaces, and on-site laundry. With ample parking and a prime location near schools, shopping, and public transport, this property is perfect for investors seeking steady rental income and low vacancy rates. Don’t miss out on this excellent investment opportunity in a growing area of North Las Vegas!
-
2024-07-29$625,000 Active 441-char remark
Show marketing remark (441 chars)
Welcome to 2321 Ellis St, a well-maintained fourplex offering four 2-bedroom, 1-bath units, each featuring modern upgrades, open living spaces, and on-site laundry. With ample parking and a prime location near schools, shopping, and public transport, this property is perfect for investors seeking steady rental income and low vacancy rates. Don’t miss out on this excellent investment opportunity in a growing area of North Las Vegas!
-
2024-07-22historical
-
2024-07-17price $624,900
-
2024-06-14price $629,900
-
2024-05-31$649,900 Active
-
2019-07-30soldstatus $315,000 Sold
-
2019-07-30soldstatus $315,000
-
2019-06-09status Pending
-
2019-06-06price $310,000
-
2019-06-04price $320,000
-
2019-04-22$350,000 Active
-
2010-07-01historical
-
2010-07-01soldstatus $84,000
-
2010-07-01soldstatus $84,000
-
2010-02-23$84,000
-
2006-07-11soldstatus $430,000
-
1995-12-04soldstatus $106,000
-
1987-06-04soldstatus $87,734
-
1986-06-12soldstatus $85,100
ⓘ Source: listings_history table (triggers on properties + properties_extension) + one-shot
backfill from property_details.listing_events for pre-trigger history.
Tax reassessment forecast NV · Resets to sale price
- Current annual tax
- $1,275 · $106/mo
- Projected year-2 tax
- $3,652 · $304/mo
- Expected delta
- +$2,377/yr (+$198/mo · 186.5%)
ⓘ Screening estimate from a state-policy table — verify with the county assessor before closing.
Climate risk First Street
- Flood 1/10 Low FEMA zone X (unshaded) · 0% chance over 30 yrs
- Wildfire 1/10 Low
- Heat 8/10 Severe 7 d/yr ≥108°F today · 19 d/yr by 30 yrs out
- Wind 1/10 Low
- Air quality 4/10 Moderate 4 unhealthy d/yr today · 5 by 30 yrs out
Nearby sold comps map
Loading sold comps map…
Walkable amenities ~0.75 mi
Loading nearby amenities…
Taxation est. · year 1
- Rental income
- $57,900
- − Mortgage interest
- −$34,674
- − Property taxes
- −$1,275
- − Insurance
- −$3,095
- − Repairs & maintenance
- −$4,632
- − Management
- −$4,632
- − Depreciation
- −$18,007
- Taxable loss
- −$8,415
- Est. tax savings @ 24.0%
- +$2,020
- After-tax cash flow
- $4,438/yr
For passive investors: Depreciation is non-cash, so a rental often shows a tax loss while cash-flowing — sheltering income. Rental losses are passive: they offset passive income freely, and up to $25,000/yr can offset ordinary (W-2) income if you actively participate and your MAGI is under $100k (phasing out to $0 by $150k); unused losses carry forward. On sale, claimed depreciation is recaptured at up to 25%, and gains may owe capital-gains tax (a 1031 exchange can defer both). Figures are a year-1 estimate at your 24.0% rate — not tax advice; consult a CPA.
Schools (NCES district)
- District
- Clark County School District
- NCES district ID
- 3200060
- Math proficiency
- 21% ▼ -13.00%
- Reading proficiency
- 39% ▼ -8.00%
- Median HH income
- $53,611
- Composite
- 26.48/100
- National rank
- #7211
- State rank
- #11 of 17 in NV
Livability — North Las Vegas
- Score
- 74/100
- State rank
- #14
- US rank
- #4471
Category grades
Schools grade is shown separately in the Schools card above.
Census & demographics
- Census place
- North Las Vegas, NV
- County
- Clark County · 2,306,105 people
- City population
- 274,675
- Metro
- Las Vegas-Henderson-Paradise, NV
- Population (ZIP)
- 51,341
- Household income
- $47,937
- Rent vs Own
- Severe rent burden
- 2821.0
Population outlook (Clark County) Hauer SSP2
- Today (2025)
- 2,504,101 people
- By 2030
- 2,693,770 · +7.6%
- By 2040
- 3,061,208 · +22.2%
- By 2050
- 3,400,072 · +35.8%
- By 2075
- 4,139,522 · +65.3%
- By 2100
- 4,596,916 · +83.6%
Race, ethnicity, and origin ACS 2023
- Neighborhood character
- Predominantly Hispanic (73%)
- Race & ethnicity
- Hispanic / Latino 73% Two or more races 26% Black 14% White 8% Native American 2% Asian 1%
- Hispanic origin (detail)
- Mexican 65%
- Foreign-born
- 33% · Canada
- Languages at home
- 34% English-only · Spanish 64% Other Asian/Pacific 1%
Political lean MEDSL · Clark
- 2024 margin
- Toss-up / Even · D 50.4% · R 47.8% · Other 1.7%
- 2008→2024 swing
- -16.5pp toward R · 2008: 19.1pp · 2024: 2.6pp
- All cycles
- 2024: D+2.6 2020: D+9.3 2016: D+10.7 2012: D+14.5 2008: D+19.1
Not yet ingested
- Civics
- —
Market trends
- HPI YoY
- ▼ -117.09%
- Current HPI
- 305.5742
- Rent YoY
- ▲ 3.04%
- Metro
- Las Vegas-Henderson-Paradise, NV
- State GDP YoY
- ▲ 3.08%
- F500 in state
- 6
Industry mix (Fortune 500 HQ in NV)
| Industry | F500 HQs | Revenue |
|---|---|---|
| Hotels / Casinos | 3 | $36B |
|
||
Price history
+674.4% since first listed25 events — show timeline
- 2026-05-07 Price Changed $659,000 GLVAR
- 2026-04-20 Listed $670,000 GLVAR
- 2024-11-06 Sold (Public Records) $589,000 Public Records
- 2024-11-06 Sold (MLS) $589,000 GLVAR
- 2024-09-16 Contingent — GLVAR
- 2024-08-09 Price Changed $595,000 GLVAR
- 2024-07-29 Listed $625,000 GLVAR
- 2024-07-22 Listing Removed — GLVAR
- 2024-07-17 Price Changed $624,900 GLVAR
- 2024-06-14 Price Changed $629,900 GLVAR
- 2024-05-31 Listed $649,900 GLVAR
- 2019-07-30 Sold (Public Records) $315,000 Public Records
- 2019-07-30 Sold (MLS) $315,000 GLVAR
- 2019-06-09 Pending — GLVAR
- 2019-06-06 Price Changed $310,000 GLVAR
- 2019-06-04 Price Changed $320,000 GLVAR
- 2019-04-22 Listed $350,000 GLVAR
- 2010-07-01 Sold (Public Records) $84,000 Public Records
- 2010-07-01 Sold (MLS) $84,000 GLVAR
- 2010-07-01 Listing Removed — GLVAR
- 2010-02-23 Listed $84,000 GLVAR
- 2006-07-11 Sold (Public Records) $430,000 Public Records
- 1995-12-04 Sold (Public Records) $106,000 Public Records
- 1987-06-04 Sold (Public Records) $87,734 Public Records
- 1986-06-12 Sold (Public Records) $85,100 Public Records
Property tax history
+0.4%/yrLatest (2025): $1,275 · +7.8% YoY. Source: county tax records.
Cash-flow waterfall
monthlySold comps — $/sqft
last 12 mo · ≤1 miLoading sold comps…