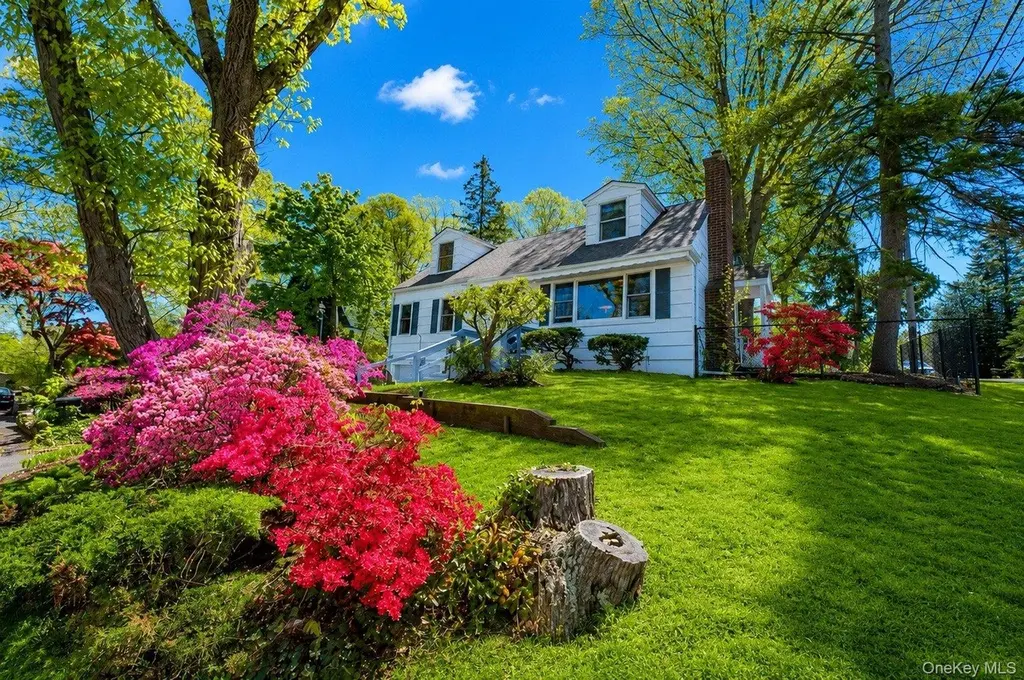
10 Mckenzie St · Huntington, NY
Flood risk 1/10 · Minimal
- FEMA flood zone
- X (unshaded)
- Chance of flooding over 30 yrs
- 0.0%
- Est. flood insurance / yr
- $473 – $860
Fire risk 1/10 · Minimal
- Est. fire insurance / yr
- $691 – $1,283
Heat risk 5/10 · Moderate
- Hot days now (above 97°F)
- 7 days/yr
- Hot days in 30 yrs
- 15 days/yr
Wind risk 8/10 · Major
- Chance of severe wind over 30 yrs
- 80.0%
Air-quality risk 4/10 · Minor
- Unhealthy air days now
- 4 days/yr
- Unhealthy air days in 30 yrs
- 6 days/yr
Risk factors via First Street. Map © Google.
Why this score? — see what drove the C- grade
The composite is a weighted blend of 9 inputs, each scored 0–100. Each bar is that input's sub-score; the figure is the points it added to the 100-point composite (weight × sub-score).
- ARV discount +15.0/15.0
- Cash flow +14.0/30.0
- Schools +4.6/10.0
- DSCR +4.3/10.0
- 1% rule +4.1/10.0
- Rent growth +4.0/5.0
- Livability +3.5/5.0
- Condition / age +2.5/5.0
- Appreciation +0.0/10.0
$779,000
🖨 Deal sheet 📄 Offer letter ✓ Due diligence
Listing remarks
This Nantucket Cape boasts beautiful waterviews overlooking Huntington Harbor. This 4 bedroom 2 bathroom updated house blends the classic coastal charm with ambiance. The interior offers all wood floors, a large living room with a woodburning stone fireplace and a large picture window with harbor views. The kitchen with all stainless steel appliances, new microwave, glass stovetop, farm sink and corian countertops with a side door entry all open to designated dining area and an entertainment room with vaulted ceilings and wooden beams, a wood burning stone fireplace with brand new pella sliding doors (with auto mini blinds built into glass) that leads out to the backyard and brick patio. Up
Key facts
- 7,841 sq ft lot
- Garage
- Built 1956
Property features AI
Exterior
- Parking: Garage; 1-car garage
- Utilities: Cesspool sewer; Public trash collection; Water connected
- Home design: Single family residence; Living area based on plans
- Construction: Frame construction; Full unfinished basement
- Exterior features: Frame construction; Not waterfront
Interior
- Kitchen: Dishwasher; Oven; Range; Refrigerator
- Bedrooms: Includes a first-floor bedroom
- Flooring: Hardwood
- Bathrooms: Two full bathrooms
- Heating & cooling: Oil heating with baseboard; No central cooling
- Interior features: First-floor bedroom; First-floor full bath; Cathedral ceilings; Open floorplan; Walk-through kitchen
- Laundry & utility: Washer; Dryer
Neighborhood map
What this means for you Summary
Snapshot
- This is a 4-bed/2.0-bath single-family listed at $779k.
Deal economics
- At list price, monthly cash flow is $103 ($1k/yr) — positive.
- The deal already cash-flows at list — no discount required.
- To meet the 1% rule (rent ≥ 1% of price), the offer needs to be $709k (8.9% below list).
- Recommended offer: $709k (8.9% below list) — sets the bar for 1% rule.
- Cap rate 6.5% vs local median 2.2% in Huntington — top-decile yield for the area; either an underpriced asset or a hidden risk that comps aren't pricing in. Stress-test before assuming the spread holds.
Location & tenants
- Location reads 69/100 on livability (#495 in NY) — a middle-class / working-renter tenant base. Strengths: crime A+, employment A+, housing A; Watch: amenities F, commute F, cost of living F.
- Huntington Union Free School District (suburban): math 45% / reading 52% proficiency, ranked #328 of 590 in NY (top 56%) — families likely to look elsewhere, expect single-tenant / working-renter base with shorter leases.
- Zoned schools: Southdown School (math 24% / reading 34%, grade F, #1,729 of 2,108 statewide, top 84%, 289 students, 58% FRL); J Taylor Finley Middle School (math 25% / reading 44%, grade F, #483 of 729 statewide, top 68%, 623 students, 58% FRL); Huntington High School (math 91% / reading 92%, grade A+, #197 of 1,100 statewide, top 18%, 1,410 students, 56% FRL) — zoned schools average 58% FRL vs 34% district-wide (24 pts higher); higher-poverty schools than district average — tighter screening recommended.
- Market conditions: Rents rising fast (+6.1%/yr); 261 active listings in the ZIP; 3 comparable units currently listed for rent nearby; rentals leasing fast (median 13d on market — plan ~1-2 weeks tenant-placement turnaround); high-income renter base; 1,366 units permitted in Suffolk County in 2024 (216 in 5+ unit buildings).
- At $7,095/mo this rent would consume 46% of the median local household income ($183k/yr) (locally 479% of renters already pay >50% of income on rent) — very limited rent-growth headroom before tenants either downsize or default.
Forward outlook
- Local home prices are declining (-3.0%/yr); year-one equity from $5k of loan paydown is wiped out by about $23k of value loss. Plan a longer hold.
- Suffolk County population projected to shrink 5% by 2050 — rents likely to lag national; underwrite the cash flow, not the appreciation.
Negotiation context
- It's been on market 27 days — a 2% lower offer ($767k) is reasonable based on typical stale-listing flexibility.
- Current owner paid $560k; 39% above their basis — modest negotiation headroom, anchor on the comps not their cost.
Risks & watch-outs
- Watch-outs: built in 1956 — expect roof / HVAC / electrical / plumbing capex.
- Climate carrying-cost: severe wind risk, 80% chance of damaging wind over 30y; extreme-heat days projected 7→15/yr by 2055 (HVAC capex compounding) — expect insurance premiums to compound above CPI over the hold.
Questions for the listing agent
- Built in 1956 — when were the roof, HVAC, electrical panel, plumbing, and water heater last replaced?
- Is there a deadline driving the sale (1031 exchange, divorce, estate, relocation)? That informs how much negotiation room exists.
- Schools are A-rated — typically a magnet for longer-tenancy family renters. What's the average tenant stay here, and is there a school-zone premium baked into asking?
- What's the average days-on-market for RENTAL listings here right now (not sales)? A rising rental-DOM trend means longer vacancies and softer asking-rent achievability than the comps imply.
- What's the recent tenant-quality profile in this submarket — average credit score on applications, eviction rate, late-payment / NSF rate, and stable-employment percentage? A property-management company in the area should have these aggregated.
- How much new for-sale + rental construction is in the pipeline within 1–3 miles? Heavy new supply typically softens prices + rents 12–24 months out; constrained supply supports both.
Investment metrics
- 1% rule
- 0.91% ✗
- Cap rate
- 6.45%
- Cash-on-cash
- 0.57%
- DSCR
- 1.03
- GRM
- 9.2
CMA / ARV
- ARV (median comp)
- $1,107,183
- List price
- $779,000
- Delta
- -29.64%
- Verdict
- UNDERPRICED
- Comps
- 20 within 1.0 mi
Show comp detail 7 sales within ~0.75 mi
| Address | Dist | Beds/Ba | Sqft | Sold | Price | $/sf | Match |
|---|---|---|---|---|---|---|---|
| 65 Preston St | 0.42mi | 3/2.0 (-1) | 1,943 (-2%) | 8mo | $750,000 | $386 | 67 |
| 8 Lovers Ln | 0.37mi | 4/2.5 | 2,100 (+6%) | 7mo | $610,000 | $290 | 64 |
| 24 Cherry Pl | 0.26mi | 3/2.5 (-1) | 1,750 (-11%) | 2mo | $900,000 | $514 | 60 |
| 66 Glenna Little Trl | 0.21mi | 4/2.5 | 2,200 (+11%) | 17mo | $777,827 | $354 | 55 |
| 5 Emil Ct | 0.68mi | 4/2.5 | 2,048 (+4%) | 11mo | $1,050,000 | $513 | 50 |
| 6 Emil Ct | 0.67mi | 4/2.5 | 2,190 (+11%) | 3mo | $835,000 | $381 | 46 |
| 2 Briarcliff Pl | 0.45mi | 3/2.0 (-1) | 1,692 (-14%) | 13mo | $825,000 | $488 | 39 |
Match score weights: distance 35% · size 25% · config 20% · recency 20%. Top-matched comps best support the ARV.
Projected returns pro-forma
-3.0% appreciation · 6.14% rent growth · sell at horizon
- IRR
- -11.8%
- Equity multiple
- 0.56×
- Total profit
- $-96,378
- Equity at exit
- $116,151
- IRR
- 1.5%
- Equity multiple
- 1.12×
- Total profit
- $26,440
- Equity at exit
- $67,354
Cash invested: $218,120 (down + closing). Projections, not guarantees.
Landlord ↔ Tenant lean methodology
- Overall (STATE)
- 15 Strongly Tenant-Friendly
- State New York
- 15 Strongly Tenant-Friendly · D+10
- County
- — inherits STATE
- City
- — inherits STATE
ZIP-level market 11743
- Rents YoY
- 6.1%
- Active inventory
- 261
- Price-to-rent
- 9.2×
Monthly cashflow live
- Estimated rent
- $7,095 medium interval (Pro) →
- Mortgage (P&I)
- −$4,085
- Tax from tax record
- −$1,092 /mo · $13,104/yr
- Insurance
- −$325
- HOA
- −$0
- Vacancy / Maint / Mgmt
- −$1,490
- Net cashflow
- $103
Break-even live
UW: 25.0% down · 7.5% · 30yr · 1.5% tax · 5.0% vac · 8.0% maint · 8.0% mgmt
Financing live
Cash to close
- Down payment
- $194,750
- Closing costs
- $23,370
- Reserves months
- —
- Total cash needed
- —
Loan-product check · same deal, 3 products live
Conventional
25% down · 7.5% · 30yr
- Down + closing
- —
- Monthly P&I
- —
- Monthly cashflow
- —
- DSCR
- —
- Eligible?
- —
Personal DTI + credit; lowest rate.
DSCR
20% down · 8.5% · 30yr
- Down + closing
- —
- Monthly P&I
- —
- Monthly cashflow
- —
- DSCR
- —
- Eligible?
- —
No personal income docs; deal must DSCR.
Hard money
10% down · 12.0% · 12mo
- Down + closing
- —
- Monthly P&I
- —
- Monthly cashflow
- —
- DSCR
- —
- Eligible?
- —
Short-term bridge; refi at stabilization.
Rent comps 3 comps
| Address | Beds | Baths | Sqft | Rent | $/sqft | DOM | Units | Dist |
|---|---|---|---|---|---|---|---|---|
| 1 Pine Pt Huntington, NY | 5.0 | 3.0 | 2550 | $13,000 | $5.10 | 1d | 1 | 0.75mi |
| 41 Potter Ln Halesite, NY | 3.0 | 3.0 | 1892 | $5,000 | $2.64 | 43d | 1 | 1.22mi |
| 41 Potter Ln Halesite, NY | 3.0 | 3.0 | 1892 | $4,200 | $2.22 | 13d | 1 | 1.22mi |
Listing history 10 events
-
2026-06-02status $779,000 Pending 27 DOM
-
2026-06-01days on market $779,000 Active 27 DOM
-
2026-05-31days on market $779,000 Active 26 DOM
-
2026-05-14price $779,000 1842-char remark
-
2026-05-05$799,000 Active 1842-char remark
-
2021-11-24soldstatus $560,000
-
2001-05-03soldstatus $357,500
-
1997-11-06soldstatus $239,000
-
1994-08-18soldstatus $219,000
-
1992-10-27soldstatus $215,000
ⓘ Source: listings_history table (triggers on properties + properties_extension) + one-shot
backfill from property_details.listing_events for pre-trigger history.
Tax reassessment forecast NY · Partial reset (capped growth)
- Current annual tax
- $13,104 · $1,092/mo
- Projected year-2 tax
- $13,135 · $1,095/mo
- Expected delta
- +$30/yr (+$3/mo · 0.2%)
ⓘ Screening estimate from a state-policy table — verify with the county assessor before closing.
Climate risk First Street
- Flood 1/10 Low FEMA zone X (unshaded) · 0% chance over 30 yrs
- Wildfire 1/10 Low
- Heat 5/10 Major 7 d/yr ≥97°F today · 15 d/yr by 30 yrs out
- Wind 8/10 Severe 80% chance of damaging wind over 30 yrs
- Air quality 4/10 Moderate 4 unhealthy d/yr today · 6 by 30 yrs out
Nearby sold comps map
Loading sold comps map…
Walkable amenities ~0.75 mi
Loading nearby amenities…
Taxation est. · year 1
- Rental income
- $85,135
- − Mortgage interest
- −$43,636
- − Property taxes
- −$13,104
- − Insurance
- −$3,895
- − Repairs & maintenance
- −$6,811
- − Management
- −$6,811
- − Depreciation
- −$22,662
- Taxable loss
- −$11,784
- Est. tax savings @ 24.0%
- +$2,828
- After-tax cash flow
- $4,063/yr
For passive investors: Depreciation is non-cash, so a rental often shows a tax loss while cash-flowing — sheltering income. Rental losses are passive: they offset passive income freely, and up to $25,000/yr can offset ordinary (W-2) income if you actively participate and your MAGI is under $100k (phasing out to $0 by $150k); unused losses carry forward. On sale, claimed depreciation is recaptured at up to 25%, and gains may owe capital-gains tax (a 1031 exchange can defer both). Figures are a year-1 estimate at your 24.0% rate — not tax advice; consult a CPA.
Schools (NCES district)
- District
- Huntington Union Free School District
- NCES district ID
- 3615090
- Math proficiency
- 45% ▼ -8.00%
- Reading proficiency
- 52% ▼ -1.00%
- Median HH income
- $93,547
- Composite
- 45.68/100
- National rank
- #2578
- State rank
- #328 of 590 in NY
Livability — Huntington
- Score
- 69/100
- State rank
- #495
- US rank
- #8704
Category grades
Schools grade is shown separately in the Schools card above.
Census & demographics
- Census place
- Huntington, NY
- County
- Suffolk County · 679,920 people
- City population
- 43,490
- Metro
- New York-Newark-Jersey City, NY-NJ-PA
- Population (ZIP)
- 43,490
- Household income
- $183,187
- Rent vs Own
- Severe rent burden
- 479.0
Population outlook (Suffolk County) Hauer SSP2
- Today (2025)
- 1,505,262 people
- By 2030
- 1,498,318 · -0.5%
- By 2040
- 1,471,101 · -2.3%
- By 2050
- 1,424,848 · -5.3%
- By 2075
- 1,337,157 · -11.2%
- By 2100
- 1,217,720 · -19.1%
Race, ethnicity, and origin ACS 2023
- Neighborhood character
- Predominantly White (75%)
- Race & ethnicity
- White 75% Hispanic / Latino 12% Two or more races 10% Asian 5% Black 4%
- Hispanic origin (detail)
- Puerto Rican 4%
- Common ancestry
- Romanian 6% Scotch-Irish 3% Slovak 2%
- Foreign-born
- 11% · Canada, China, Jamaica
- Languages at home
- 83% English-only · Spanish 9% Other Indo-European 3% Chinese 1%
Political lean MEDSL · Suffolk
- 2024 margin
- Lean R (+10.0) · D 45.0% · R 55.0%
- 2008→2024 swing
- -16.0pp toward R · 2008: 6.0pp · 2024: -10.0pp
- All cycles
- 2024: R+10.0 2020: R+0.0 2016: R+8.2 2012: D+2.9 2008: D+6.0
Not yet ingested
- Civics
- —
Market trends
- HPI YoY
- ▼ -659.59%
- Current HPI
- 279.0693
- Rent YoY
- ▲ 6.14%
- Metro
- New York-Newark-Jersey City, NY-NJ-PA
- State GDP YoY
- ▲ 2.60%
- F500 in state
- 92
Industry mix (Fortune 500 HQ in NY)
| Industry | F500 HQs | Revenue |
|---|---|---|
| Financial Services | 10 | $950B |
|
||
| Consumer Goods | 9 | $162B |
|
||
| Insurance | 4 | $225B |
|
||
| Telecommunications | 2 | $144B |
|
||
| Pharmaceuticals | 2 | $112B |
|
||
| Media / Entertainment | 2 | $69B |
|
||
Price history
+262.3% since first listed8 events — show timeline
- 2026-06-01 Pending — OneKey® MLS as Distributed by MLS Grid
- 2026-05-14 Price Changed $779,000 OneKey® MLS as Distributed by MLS Grid
- 2026-05-05 Listed $799,000 OneKey® MLS as Distributed by MLS Grid
- 2021-11-24 Sold (Public Records) $560,000 Public Records
- 2001-05-03 Sold (Public Records) $357,500 Public Records
- 1997-11-06 Sold (Public Records) $239,000 Public Records
- 1994-08-18 Sold (Public Records) $219,000 Public Records
- 1992-10-27 Sold (Public Records) $215,000 Public Records
Property tax history
+2.8%/yrLatest (2025): $13,104 · +0.0% YoY. Source: county tax records.
Cash-flow waterfall
monthlySold comps — $/sqft
last 12 mo · ≤1 miLoading sold comps…