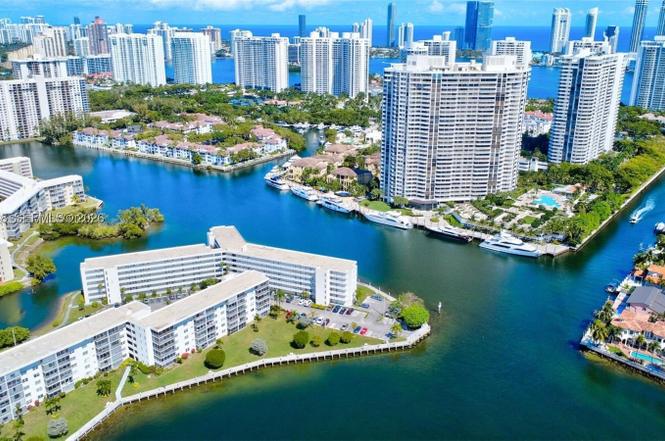
3030 Marcos Dr Unit T301 · Aventura, FL
Flood risk 7/10 · Major
- FEMA flood zone
- AE
- Chance of flooding over 30 yrs
- 0.91%
- Est. flood insurance / yr
- $1,737 – $8,500
Fire risk 1/10 · Minimal
- Est. fire insurance / yr
- $947 – $1,759
Heat risk 10/10 · Severe
- Hot days now (above 103°F)
- 6 days/yr
- Hot days in 30 yrs
- 22 days/yr
Wind risk 10/10 · Severe
- Chance of severe wind over 30 yrs
- 99.0%
Air-quality risk 2/10 · Minimal
- Unhealthy air days now
- 1 days/yr
- Unhealthy air days in 30 yrs
- 2 days/yr
Risk factors via First Street. Map © Google.
Why this score? — see what drove the B- grade
The composite is a weighted blend of 9 inputs, each scored 0–100. Each bar is that input's sub-score; the figure is the points it added to the 100-point composite (weight × sub-score).
- Cash flow +24.2/30.0
- 1% rule +9.3/10.0
- DSCR +7.8/10.0
- ARV discount +7.5/15.0
- Appreciation +5.3/10.0
- Schools +5.0/10.0
- Livability +4.0/5.0
- Rent growth +2.7/5.0
- Condition / age +2.5/5.0
$255,000
🖨 Deal sheet 📄 Offer letter ✓ Due diligence
Listing remarks
Fall in love with your captivating waterfront sanctuary! This beautifully remodeled, move-in ready corner home features a bright open floor plan and modern finishes. Enjoy a gated community just minutes from shopping and dining. BEAUTIFUL COMMUNITY +55 WITH AN AMAZING WATER VIEW, 24 HOURS SECURITY, GATED COMMUNITY, BEAUTIFULLY 2 BDRM 2 BTH, OPENED KITCHEN, WOOD AND CERAMIC FLOORS, COURTESY BUS, BINGO, BILLIARD, BOWLING, MOVIES, 5 POOLS 2 HEATED, FREE LIVE SHOWS DURING SEASON, GYM, SAUNA PLUS MUCH MORE AMENITIES. LOWEST SELLING PRICE IN AVENTURA AND LOW HOA MONTHLY PAYMENT.
Key facts
- Gated community
- Remodeled corner
- Water view
Tags
Property features AI
Finance
- Other: Pets allowed with restrictions (conditional)
- HOA & community: Monthly association fee of $615; Association covers management, amenities, common areas, cable TV, internet, laundry, grounds and structure maintenance, parking, pest control, reserve fund, trash and water; Association amenities include boat dock, marina, pier, clubhouse, fitness center, pool, billiard room, library, storage, bike storage, laundry, transportation service and elevators; Senior community
Exterior
- Parking: Assigned detached garage space; Guest parking; One covered parking space
- Security: Security guard; Smoke detectors
- Utilities: Cable available
- Home design: Condo/attached property; Six-story building; Unit on entry level 3, entry located on level 3; East-facing; Updated/remodeled
- Construction: Brick and block construction; Resale property
- Exterior features: Balcony; Deck; Open porch/patio; Fruit trees; Storm/security shutters; Association pool; Bayfront and lakefront access with navigable water and lake privileges; Complex fenced
Interior
- Kitchen: Electric range; Self-cleaning oven; Refrigerator
- Flooring: Ceramic tile; Hardwood; Laminate; Tile; Wood
- Bathrooms: 2 full bathrooms
- Heating & cooling: Central heating (electric); Central air conditioning (electric)
- Interior features: Blinds and sliding window coverings; Accessible hallways; Closet cabinetry; Eat-in kitchen; Living/dining room; Pantry; Tub/shower
- Laundry & utility: Common area laundry
Neighborhood map
What this means for you Summary
Snapshot
- This is a 2-bed/2.0-bath condo listed at $255k.
Deal economics
- At list price, monthly cash flow is $84 ($1k/yr) — positive.
- The deal already cash-flows at list — no discount required.
- Meets the 1% rule at list price ($4k rent vs $255k).
- Recommended offer: $224k (12.0% below list) — sets the bar for market timing.
- Cap rate 8.7% vs local median 2.6% in Aventura — top-decile yield for the area; either an underpriced asset or a hidden risk that comps aren't pricing in. Stress-test before assuming the spread holds.
Location & tenants
- Location reads 80/100 on livability (#127 in FL, #1,834 nationally) — a professional / high-income tenant draw. Strengths: schools A+, health & safety A+, amenities A; Watch: crime D+, cost of living F.
- Market conditions: Rents flat; 1870 active listings in the ZIP; 10,051 units permitted in Miami-Dade County in 2024 (7,758 in 5+ unit buildings).
- At $3,639/mo this rent would consume 65% of the median local household income ($67k/yr) (locally 3106% of renters already pay >50% of income on rent) — very limited rent-growth headroom before tenants either downsize or default.
Forward outlook
- In year one you build about $3k of equity ($2k loan paydown + $1k appreciation (0.5% local appreciation)).
- Miami-Dade County population projected at +28% by 2050 — long-run rental-demand tailwind backs the buy-and-hold thesis.
- By year 9, paydown + projected appreciation supports a ~$31k cash-out refi (75% LTV) — recoverable capital for the next deal without selling this one.
Negotiation context
- It's been on market 135 days — a 12% lower offer ($224k) is reasonable based on typical stale-listing flexibility.
- 2 sale attempts since 13y ago with the ask held roughly flat each time — persistent listings suggest the price (not the market) is what's stuck; bring a comps-based counter.
- Current owner paid $168k; list at $255k implies a 52% gain — meaningful room to come down on a strong offer.
Risks & watch-outs
- Watch-outs: flood insurance adds $427/mo.
- Climate carrying-cost: in FEMA flood zone AE (mandatory federal flood insurance); severe wind risk, 99% chance of damaging wind over 30y; extreme-heat days projected 6→22/yr by 2055 (HVAC capex compounding) — expect insurance premiums to compound above CPI over the hold.
Questions for the listing agent
- It's been on market 135 days. Have you received any prior offers? Is the seller open to a 12% concession, seller financing, or rate buy-down credit?
- Built in 1968 — when were the roof, HVAC, electrical panel, plumbing, and water heater last replaced?
- What's the actual annual flood-insurance premium (NFIP or private), and is the property in a SFHA with mandatory coverage?
- What does the HOA fee cover, when was the last increase, and are there any pending special assessments or reserve-fund shortfalls?
- Any open or pending special assessments — roof, HVAC, plumbing, elevator, façade? What's the per-unit balance and payoff schedule, and is the seller paying it off at close or rolling it to the buyer?
- Why hasn't it sold? Are there any deal-killer items the seller is aware of (foundation, flood, title, zoning, code violations)?
- Is there a deadline driving the sale (1031 exchange, divorce, estate, relocation)? That informs how much negotiation room exists.
- Schools are A-rated — typically a magnet for longer-tenancy family renters. What's the average tenant stay here, and is there a school-zone premium baked into asking?
- Crime grade is D in this area — have there been break-ins, vandalism, or insurance claims at this property in the last 3 years? What carrier currently insures it and at what premium?
- What's the average days-on-market for RENTAL listings here right now (not sales)? A rising rental-DOM trend means longer vacancies and softer asking-rent achievability than the comps imply.
- What's the recent tenant-quality profile in this submarket — average credit score on applications, eviction rate, late-payment / NSF rate, and stable-employment percentage? A property-management company in the area should have these aggregated.
- How much new apartment / multifamily construction is in the pipeline within 1–3 miles? Heavy new supply (>2% of stock underway) typically softens rents 12–24 months out; light construction supports rent growth.
Investment metrics
- 1% rule
- 1.43% ✓
- Cap rate
- 8.69%
- Cash-on-cash
- 8.58%
- DSCR
- 1.38
- GRM
- 5.8
CMA / ARV
No comps found within radius.
Projected returns pro-forma
0.53% appreciation · 0.94% rent growth · sell at horizon
- IRR
- -0.7%
- Equity multiple
- 0.97×
- Total profit
- $-2,443
- Equity at exit
- $80,833
- IRR
- 2.5%
- Equity multiple
- 1.27×
- Total profit
- $19,270
- Equity at exit
- $102,764
Cash invested: $71,400 (down + closing). Projections, not guarantees.
Landlord ↔ Tenant lean methodology
- Overall (STATE)
- 87 Strongly Landlord-Friendly
- State Florida
- 87 Strongly Landlord-Friendly · R+3
- County
- — inherits STATE
- City
- — inherits STATE
ZIP-level market 33160
- Home prices YoY
- 0.2%
- Rents YoY
- 0.9%
- Active inventory
- 1870
- Price-to-rent
- 5.8×
Monthly cashflow live
- Estimated rent
- $3,639 medium interval (Pro) →
- Mortgage (P&I)
- −$1,337
- Tax from tax record
- −$306 /mo · $3,667/yr
- Insurance
- −$106
- Flood insurance flood zone
- −$427 /mo · $5,118/yr
- HOA
- −$615
- Vacancy / Maint / Mgmt
- −$764
- Net cashflow
- $84
Break-even live
UW: 25.0% down · 7.5% · 30yr · 1.5% tax · 5.0% vac · 8.0% maint · 8.0% mgmt
Financing live
Cash to close
- Down payment
- $63,750
- Closing costs
- $7,650
- Reserves months
- —
- Total cash needed
- —
Loan-product check · same deal, 3 products live
Conventional
25% down · 7.5% · 30yr
- Down + closing
- —
- Monthly P&I
- —
- Monthly cashflow
- —
- DSCR
- —
- Eligible?
- —
Personal DTI + credit; lowest rate.
DSCR
20% down · 8.5% · 30yr
- Down + closing
- —
- Monthly P&I
- —
- Monthly cashflow
- —
- DSCR
- —
- Eligible?
- —
No personal income docs; deal must DSCR.
Hard money
10% down · 12.0% · 12mo
- Down + closing
- —
- Monthly P&I
- —
- Monthly cashflow
- —
- DSCR
- —
- Eligible?
- —
Short-term bridge; refi at stabilization.
HOA detail condo
- Monthly dues
- $615 · $7,380/yr
- Likely covers
- waterpoolgymsecurity
- Assessments
- None detected in remarks — confirm with the listing agent.
Listing history 18 events
-
2026-06-18days on market $255,000 Active 135 DOM
-
2026-06-17days on market $255,000 Active 134 DOM
-
2026-06-16days on market $255,000 Active 133 DOM
-
2026-06-15days on market $255,000 Active 132 DOM
-
2026-06-13days on market $255,000 Active 130 DOM
-
2026-06-09days on market $255,000 Active 126 DOM
-
2026-06-08days on market $255,000 Active 125 DOM
-
2026-06-07days on market $255,000 Active 124 DOM
-
2026-06-04days on market $255,000 Active 121 DOM
-
2026-06-03days on market $255,000 Active 120 DOM
-
2026-06-02days on market $255,000 Active 119 DOM
-
2026-06-01days on market $255,000 Active 118 DOM
-
2026-05-31days on market $255,000 Active 117 DOM
-
2026-02-03$255,000 Active
-
2014-02-28historical
-
2013-08-27$209,900 Active
-
2004-12-29soldstatus $167,500
-
1973-01-01soldstatus $35,000
ⓘ Source: listings_history table (triggers on properties + properties_extension) + one-shot
backfill from property_details.listing_events for pre-trigger history.
Tax reassessment forecast FL · Resets to sale price
- Current annual tax
- $3,667 · $306/mo
- Projected year-2 tax
- $3,667 · $306/mo
- Expected delta
- $0/yr ($0/mo · 0.0%)
ⓘ Screening estimate from a state-policy table — verify with the county assessor before closing.
Climate risk First Street
- Flood 7/10 Severe FEMA zone AE · 91% chance over 30 yrs
- Wildfire 1/10 Low
- Heat 10/10 Extreme 6 d/yr ≥103°F today · 22 d/yr by 30 yrs out
- Wind 10/10 Extreme 99% chance of damaging wind over 30 yrs
- Air quality 2/10 Low 1 unhealthy d/yr today · 2 by 30 yrs out
Nearby sold comps map
Loading sold comps map…
Walkable amenities ~0.75 mi
Loading nearby amenities…
Taxation est. · year 1
- Rental income
- $43,662
- − Mortgage interest
- −$14,284
- − Property taxes
- −$3,667
- − Insurance
- −$6,394
- − Repairs & maintenance
- −$3,493
- − Management
- −$3,493
- − HOA
- −$7,380
- − Depreciation
- −$7,418
- Taxable loss
- −$2,466
- Est. tax savings @ 24.0%
- +$592
- After-tax cash flow
- $1,598/yr
For passive investors: Depreciation is non-cash, so a rental often shows a tax loss while cash-flowing — sheltering income. Rental losses are passive: they offset passive income freely, and up to $25,000/yr can offset ordinary (W-2) income if you actively participate and your MAGI is under $100k (phasing out to $0 by $150k); unused losses carry forward. On sale, claimed depreciation is recaptured at up to 25%, and gains may owe capital-gains tax (a 1031 exchange can defer both). Figures are a year-1 estimate at your 24.0% rate — not tax advice; consult a CPA.
Schools (NCES district)
No district data.
Livability — Aventura
- Score
- 80/100
- State rank
- #127
- US rank
- #1834
Category grades
Schools grade is shown separately in the Schools card above.
Census & demographics
- Census place
- Aventura, FL
- County
- Miami-Dade County · 2,697,751 people
- Metro
- Miami-Fort Lauderdale-Pompano Beach, FL
- Population (ZIP)
- 43,718
- Household income
- $67,040
- Rent vs Own
- Severe rent burden
- 3106.0
Population outlook (Miami-Dade County) Hauer SSP2
- Today (2025)
- 3,126,439 people
- By 2030
- 3,325,765 · +6.4%
- By 2040
- 3,697,561 · +18.3%
- By 2050
- 4,012,134 · +28.3%
- By 2075
- 4,605,612 · +47.3%
- By 2100
- 4,866,598 · +55.7%
Race, ethnicity, and origin ACS 2023
- Neighborhood character
- Diverse neighborhood (Simpson 0.59)
- Race & ethnicity
- Hispanic / Latino 46% White 44% Two or more races 27% Black 4% Asian 2%
- Hispanic origin (detail)
- Mexican 1% Puerto Rican 3% Cuban 8% Dominican 1% Salvadoran 4%
- Common ancestry
- Scotch-Irish 8% Hispanic 3% Subsaharan African 3%
- Foreign-born
- 61% · Canada, Jamaica, Dominican Republic
- Languages at home
- 29% English-only · Spanish 45% Russian/Polish/Slavic 12% Other Indo-European 5%
Political lean MEDSL · Miami-Dade
- 2024 margin
- R (+11.4) · D 43.9% · R 55.4%
- 2008→2024 swing
- -27.6pp toward R · 2008: 16.1pp · 2024: -11.4pp
- All cycles
- 2024: R+11.4 2020: D+7.3 2016: D+29.6 2012: D+23.7 2008: D+16.1
Not yet ingested
- Civics
- —
Market trends
- HPI YoY
- ▲ 0.53%
- Current HPI
- 284.9293
- Rent YoY
- ▲ 0.94%
- Metro
- Miami-Fort Lauderdale-Pompano Beach, FL
- State GDP YoY
- ▲ 3.28%
- F500 in state
- 36
Industry mix (Fortune 500 HQ in FL)
| Industry | F500 HQs | Revenue |
|---|---|---|
| Industrial Technology | 2 | $29B |
|
||
| Insurance | 2 | $17B |
|
||
| Retail | 1 | $60B |
|
||
| Technology Distribution | 1 | $58B |
|
||
| Homebuilding | 1 | $35B |
|
||
| Technology Manufacturing | 1 | $35B |
|
||
Price history
+628.6% since first listed5 events — show timeline
- 2026-02-03 Listed $255,000 MARMLS
- 2014-02-28 Listing Removed — MARMLS
- 2013-08-27 Listed $209,900 MARMLS
- 2004-12-29 Sold (Public Records) $167,500 Public Records
- 1973-01-01 Sold (Public Records) $35,000 Public Records
Property tax history
+5.7%/yrLatest (2025): $3,667 · +1.9% YoY. Source: county tax records.
Cash-flow waterfall
monthlySold comps — $/sqft
last 12 mo · ≤1 miLoading sold comps…