1000 Carnegie Dr · Fayetteville, NC
Flood risk 1/10 · Minimal
- FEMA flood zone
- X (unshaded)
- Chance of flooding over 30 yrs
- 0.0%
- Est. flood insurance / yr
- $507 – $1,088
Fire risk 6/10 · Moderate
- Est. fire insurance / yr
- $906 – $1,684
Heat risk 7/10 · Major
- Hot days now (above 105°F)
- 7 days/yr
- Hot days in 30 yrs
- 16 days/yr
Wind risk 6/10 · Moderate
- Chance of severe wind over 30 yrs
- 73.0%
Air-quality risk 1/10 · Minimal
- Unhealthy air days now
- 0 days/yr
- Unhealthy air days in 30 yrs
- 0 days/yr
Risk factors via First Street. Map © Google.
Why this score? — see what drove the D grade
The composite is a weighted blend of 9 inputs, each scored 0–100. Each bar is that input's sub-score; the figure is the points it added to the 100-point composite (weight × sub-score).
- Cash flow +14.5/30.0
- ARV discount +8.7/15.0
- DSCR +4.4/10.0
- Livability +3.8/5.0
- 1% rule +3.2/10.0
- Rent growth +3.2/5.0
- Schools +3.1/10.0
- Condition / age +2.5/5.0
- Appreciation +0.0/10.0
$174,000
🖨 Deal sheet (PDF) 📄 Offer letter ✓ Due diligence
Listing remarks
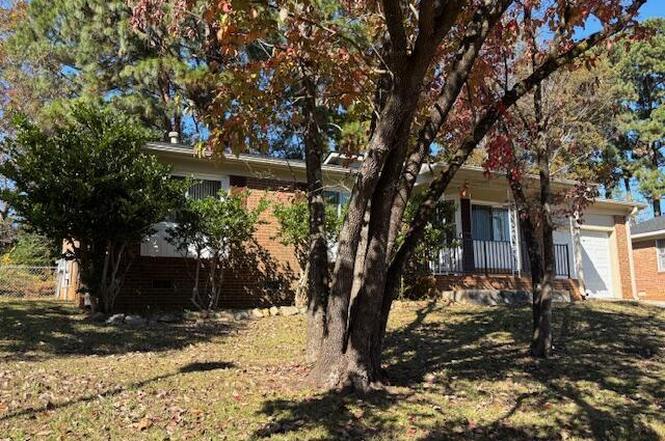
Nice Brick Ranch with 3 bedrooms , one and half baths with a good size closet in the master bedroom, single car garage. Fenced backyard. Freshly painted inside and outside . Newly installed water-proof laminated floor for Kitchen , dinning room, living room and hallway. Brand new roof, new range and new dishwasher. A new refrigerator will be as a gift at closing or for $1000 credit . Good location on the north side of Fayetteville. Convenient for shopping, restaurants, and hospital, just minutes drive from Fort Bragg and HWY 295. Great school systems from elementary to Pine Forest middle, Pine Forest high schools, and Methodist University.
Key facts
- Brand new roof
- Freshly painted
- New range
Tags
Property features AI
Neighborhood map
What this means for you Summary
Snapshot
- This is a 3-bed/2.0-bath single-family listed at $174k.
Deal economics
- At list price, monthly cash flow is $39 ($469/yr) — positive.
- The deal already cash-flows at list — no discount required.
- To meet the 1% rule (rent ≥ 1% of price), the offer needs to be $143k (17.7% below list).
- Recommended offer: $143k (17.7% below list) — sets the bar for 1% rule.
- Cap rate 6.6% vs local median 4.8% in Fayetteville — top-decile yield for the area; either an underpriced asset or a hidden risk that comps aren't pricing in. Stress-test before assuming the spread holds.
Location & tenants
- Location reads 75/100 on livability (#45 in NC, #4,031 nationally) — a middle-class / working-renter tenant base. Strengths: commute A+, cost of living A+, housing A+; Watch: crime F, employment D-.
- Cumberland County Schools (urban): math 32% / reading 41% proficiency, ranked #126 of 178 in NC (top 71%) — families likely to look elsewhere, expect single-tenant / working-renter base with shorter leases.
- Zoned schools: Howard L Hall Elementary (math 40% / reading 49%, grade F, #574 of 1,410 statewide, top 43%, 600 students, 100% FRL); Pine Forest Middle (math 38% / reading 49%, grade D, #182 of 475 statewide, top 40%, 738 students, 56% FRL); Pine Forest High (math 73% / reading 51%, grade B-, #184 of 535 statewide, top 37%, 1,572 students, 62% FRL) — zoned schools average 73% FRL vs 55% district-wide (18 pts higher); higher-poverty schools than district average — tighter screening recommended.
- Zoned-school proficiency averages 50% at this address vs 36% district-wide (+14 pts) — the actual schools serving this property are materially stronger than the Cumberland County Schools average implies; a family-tenant draw the district grade alone would hide.
- Market conditions: Rents rising (+2.8%/yr); 363 active listings in the ZIP; 17 comparable units currently listed for rent nearby; rentals at typical pace (median 26d on market — plan ~3-4 weeks tenant-placement turnaround); 1,125 units permitted in Cumberland County in 2024 (104 in 5+ unit buildings).
Forward outlook
- Local home prices are declining (-3.0%/yr); year-one equity from $1k of loan paydown is wiped out by about $5k of value loss. Plan a longer hold.
Negotiation context
- It's been on market 226 days — a 12% lower offer ($153k) is reasonable based on typical stale-listing flexibility.
- Current owner paid $80k; list at $174k implies a 118% gain — meaningful room to come down on a strong offer.
Risks & watch-outs
- Climate carrying-cost: major wind risk, 73% chance of damaging wind over 30y; major wildfire risk; extreme-heat days projected 7→16/yr by 2055 (HVAC capex compounding) — expect insurance premiums to compound above CPI over the hold.
Questions for the listing agent
- It's been on market 226 days. Have you received any prior offers? Is the seller open to a 18% concession, seller financing, or rate buy-down credit?
- Built in 1975 — when were the roof, HVAC, electrical panel, plumbing, and water heater last replaced?
- Why hasn't it sold? Are there any deal-killer items the seller is aware of (foundation, flood, title, zoning, code violations)?
- Is there a deadline driving the sale (1031 exchange, divorce, estate, relocation)? That informs how much negotiation room exists.
- Crime grade is F in this area — have there been break-ins, vandalism, or insurance claims at this property in the last 3 years? What carrier currently insures it and at what premium?
- The area grade is low — what's the realistic commute time and amenity access for the typical tenant pool here? Any planned neighborhood developments (good or bad) we should know about?
- What's the average days-on-market for RENTAL listings here right now (not sales)? A rising rental-DOM trend means longer vacancies and softer asking-rent achievability than the comps imply.
- What's the recent tenant-quality profile in this submarket — average credit score on applications, eviction rate, late-payment / NSF rate, and stable-employment percentage? A property-management company in the area should have these aggregated.
- How much new for-sale + rental construction is in the pipeline within 1–3 miles? Heavy new supply typically softens prices + rents 12–24 months out; constrained supply supports both.
Investment metrics
- 1% rule
- 0.82% ✗
- Cap rate
- 6.56%
- Cash-on-cash
- 0.96%
- DSCR
- 1.04
- GRM
- 10.1
CMA / ARV
- ARV (on-the-fly)
- $178,880
- Comps found
- 12
Show comp detail 12 sales within ~0.75 mi
| Address | Dist | Beds/Ba | Sqft | Sold | Price | $/sf | Match |
|---|---|---|---|---|---|---|---|
| 576 Braxton Blvd | 0.38mi | 3/2.0 | 1,011 (-3%) | 2mo | $175,000 | $173 | 77 |
| 1017 Appalachin Dr | 0.21mi | 3/2.0 | 1,093 (+5%) | 18mo | $170,000 | $156 | 67 |
| 1161 Andrews Rd | 0.12mi | 3/2.0 | 1,195 (+15%) | 14mo | $195,000 | $163 | 58 |
| 629 Winthrop Ct | 0.72mi | 3/2.0 | 1,087 (+4%) | 2mo | $194,000 | $178 | 58 |
| 6713 Winthrop Dr | 0.54mi | 3/2.0 | 1,092 (+5%) | 12mo | $194,500 | $178 | 56 |
| 6740 Winthrop Dr | 0.54mi | 3/2.0 | 1,116 (+7%) | 8mo | $155,000 | $139 | 56 |
| 6569 Cushing Dr | 0.66mi | 3/1.5 | 1,128 (+8%) | 10mo | $188,000 | $167 | 44 |
| 6316 Chagrin Rd | 0.65mi | 3/2.0 | 1,163 (+12%) | 7mo | $200,000 | $172 | 44 |
| 616 Woodburn Dr | 0.71mi | 3/2.0 | 1,101 (+6%) | 17mo | $192,000 | $174 | 43 |
| 6546 Winthrop Dr | 0.62mi | 3/1.0 | 945 (-9%) | 14mo | $156,000 | $165 | 40 |
| 625 Winthrop Ct | 0.70mi | 3/2.0 | 1,176 (+13%) | 13mo | $157,000 | $134 | 35 |
| 618 Woodburn Dr | 0.72mi | 3/1.0 | 897 (-14%) | 18mo | $156,135 | $174 | 24 |
Match score weights: distance 35% · size 25% · config 20% · recency 20%. Top-matched comps best support the ARV.
Projected returns pro-forma
-3.0% appreciation · 2.82% rent growth · sell at horizon
- IRR
- -15.0%
- Equity multiple
- 0.47×
- Total profit
- $-26,014
- Equity at exit
- $25,944
- IRR
- -6.7%
- Equity multiple
- 0.58×
- Total profit
- $-20,696
- Equity at exit
- $15,044
Cash invested: $48,720 (down + closing). Projections, not guarantees.
Landlord ↔ Tenant lean methodology
- Overall (STATE)
- 85 Strongly Landlord-Friendly
- State North Carolina
- 85 Strongly Landlord-Friendly · R+3
- County
- — inherits STATE
- City
- — inherits STATE
ZIP-level market 28311
- Home prices YoY
- -18.4%
- Rents YoY
- 2.8%
- Active inventory
- 363
- Price-to-rent
- 10.1×
Monthly cashflow live
- Estimated rent
- $1,432 high interval (Pro) →
- Mortgage (P&I)
- −$912
- Tax from tax record
- −$107 /mo · $1,287/yr
- Insurance
- −$72
- HOA
- −$0
- Vacancy / Maint / Mgmt
- −$301
- Net cashflow
- $39
Break-even live
Sensitivity live
| Price | -10% $138 | -5% $88 | +0% $39 | +5% $-10 | +10% $-59 |
|---|---|---|---|---|---|
| Rent | -10% $-74 | -5% $-18 | +0% $39 | +5% $96 | +10% $152 |
| Rate | -1.0pp $127 | -0.5pp $83 | base $39 | +0.5pp $-6 | +1.0pp $-52 |
UW: 25.0% down · 7.5% · 30yr · 1.5% tax · 5.0% vac · 8.0% maint · 8.0% mgmt
Financing live
Cash to close
- Down payment
- $43,500
- Closing costs
- $5,220
- Reserves months
- —
- Total cash needed
- —
Loan-product check · same deal, 3 products live
Conventional
25% down · 7.5% · 30yr
- Down + closing
- —
- Monthly P&I
- —
- Monthly cashflow
- —
- DSCR
- —
- Eligible?
- —
Personal DTI + credit; lowest rate.
DSCR
20% down · 8.5% · 30yr
- Down + closing
- —
- Monthly P&I
- —
- Monthly cashflow
- —
- DSCR
- —
- Eligible?
- —
No personal income docs; deal must DSCR.
Hard money
10% down · 12.0% · 12mo
- Down + closing
- —
- Monthly P&I
- —
- Monthly cashflow
- —
- DSCR
- —
- Eligible?
- —
Short-term bridge; refi at stabilization.
Rent comps 17 comps
| Address | Beds | Baths | Sqft | Rent | $/sqft | DOM | Units | Dist |
|---|---|---|---|---|---|---|---|---|
| 1009 Louisburg Pl Fayetteville, NC | 3.0 | 2.0 | 1362 | $1,550 | $1.14 | 25d | 1 | 0.10mi |
| 1017 Xavier Ct Fayetteville, NC | 3.0 | 2.0 | 1401 | $1,595 | $1.14 | 25d | 1 | 0.12mi |
| 6702 Agnes Scott Ct Fayetteville, NC | 3.0 | 1.0 | 954 | $1,200 | $1.26 | 25d | 1 | 0.15mi |
| 806 Carnegie Dr Fayetteville, NC | 3.0 | 1.5 | 1118 | $1,400 | $1.25 | 25d | 1 | 0.18mi |
| 1018 Appalachin Dr Fayetteville, NC | 3.0 | 2.0 | 1118 | $1,700 | $1.52 | 25d | 1 | 0.23mi |
| 549 Braxton Blvd Fayetteville, NC | 2.0 | 1.5 | 950 | $1,075 | $1.13 | 25d | 1 | 0.31mi |
| 557 Braxton Blvd Fayetteville, NC | 2.0 | 1.5 | 950 | $1,075 | $1.13 | 23d | 1 | 0.32mi |
| 561 Braxton Blvd Fayetteville, NC | 2.0 | 1.5 | 950 | $1,075 | $1.13 | 15d | 2 | 0.32mi |
| 575 Braxton Blvd Fayetteville, NC | 3.0 | 2.0 | 1001 | $1,295 | $1.29 | 15d | 1 | 0.39mi |
| 6637 Abbey Ln Fayetteville, NC | 2.0 | 1.0 | 753 | $895 | $1.19 | 25d | 1 | 0.47mi |
| 3405 Revolution Rd Fayetteville, NC | 1.0–2.0 | 1.0–2.0 | 977 | $1,587 | $1.62 | 15d | 7 | 0.51mi |
| 1527 McArthur Rd Fayetteville, NC | 3.0 | 1.0 | 864 | $925 | $1.07 | 25d | 1 | 0.55mi |
| 1547 Center St Fayetteville, NC | 2.0 | 1.0 | 802 | $850 | $1.06 | 25d | 1 | 0.66mi |
| 1725 Cumberland Dr Fayetteville, NC | 2.0 | 1.0 | 750 | $900 | $1.20 | 25d | 1 | 0.68mi |
| 633 Winthrop Ct Fayetteville, NC | 3.0 | 2.0 | 1104 | $1,500 | $1.36 | 15d | 1 | 0.72mi |
| 644 Clayton Dr Fayetteville, NC | 3.0 | 1.5 | 1150 | $1,100 | $0.96 | 25d | 1 | 0.81mi |
| 5327 Chesapeake Rd Fayetteville, NC | 3.0 | 2.0 | 1400 | $1,600 | $1.14 | 15d | 1 | 1.40mi |
Listing history 21 events
-
2026-06-21days on market $174,000 Active 226 DOM
-
2026-06-18days on market $174,000 Active 223 DOM
-
2026-06-17days on market $174,000 Active 222 DOM
-
2026-06-16days on market $174,000 Active 221 DOM
-
2026-06-15days on market $174,000 Active 220 DOM
-
2026-06-14days on market $174,000 Active 218 DOM
-
2026-06-13days on market $174,000 Active 217 DOM
-
2026-06-10days on market $174,000 Active 215 DOM
-
2026-06-09days on market $174,000 Active 214 DOM
-
2026-06-08days on market $174,000 Active 213 DOM
-
2026-06-07days on market $174,000 Active 212 DOM
-
2026-06-03days on market $174,000 Active 208 DOM
-
2026-06-02days on market $174,000 Active 207 DOM
-
2026-06-01days on market $174,000 Active 206 DOM
-
2026-05-31days on market $174,000 Active 205 DOM
-
2026-05-30days on market $174,000 Active 204 DOM
-
2026-05-21price $174,000
-
2025-12-02price $179,000
-
2025-11-07$185,000 Active
-
2007-11-08soldstatus $80,000
-
2005-10-24soldstatus $69,000
ⓘ Source: listings_history table (triggers on properties + properties_extension) + one-shot
backfill from property_details.listing_events for pre-trigger history.
Tax reassessment forecast NC · Resets to sale price
- Current annual tax
- $1,287 · $107/mo
- Projected year-2 tax
- $1,427 · $119/mo
- Expected delta
- +$140/yr (+$12/mo · 10.9%)
ⓘ Screening estimate from a state-policy table — verify with the county assessor before closing.
Climate risk First Street
- Flood 1/10 Low FEMA zone X (unshaded) · 0% chance over 30 yrs
- Wildfire 6/10 Major
- Heat 7/10 Severe 7 d/yr ≥105°F today · 16 d/yr by 30 yrs out
- Wind 6/10 Major 73% chance of damaging wind over 30 yrs
- Air quality 1/10 Low 0 unhealthy d/yr today · 0 by 30 yrs out
Nearby sold comps map
Loading sold comps map…
Walkable amenities ~0.75 mi
Loading nearby amenities…
Taxation est. · year 1
- Rental income
- $17,184
- − Mortgage interest
- −$9,747
- − Property taxes
- −$1,287
- − Insurance
- −$870
- − Repairs & maintenance
- −$1,375
- − Management
- −$1,375
- − Depreciation
- −$5,062
- Taxable loss
- −$2,531
- Est. tax savings @ 24.0%
- +$607
- After-tax cash flow
- $1,076/yr
For passive investors: Depreciation is non-cash, so a rental often shows a tax loss while cash-flowing — sheltering income. Rental losses are passive: they offset passive income freely, and up to $25,000/yr can offset ordinary (W-2) income if you actively participate and your MAGI is under $100k (phasing out to $0 by $150k); unused losses carry forward. On sale, claimed depreciation is recaptured at up to 25%, and gains may owe capital-gains tax (a 1031 exchange can defer both). Figures are a year-1 estimate at your 24.0% rate — not tax advice; consult a CPA.
Schools (NCES district)
- District
- Cumberland County Schools
- NCES district ID
- 3700011
- Math proficiency
- 32% ▼ -2.00%
- Reading proficiency
- 41% ▼ -1.00%
- Median HH income
- $44,168
- Composite
- 31.0/100
- National rank
- #6096
- State rank
- #126 of 178 in NC
Livability — Fayetteville
- Score
- 75/100
- State rank
- #45
- US rank
- #4031
Category grades
Schools grade is shown separately in the Schools card above.
Census & demographics
- County
- Cumberland County · 265,314 people
- City population
- 226,118
- Metro
- Fayetteville, NC
- Population (ZIP)
- 36,629
- Household income
- $62,170
- Rent vs Own
- Severe rent burden
- 1645.0
Population outlook (Cumberland County) Hauer SSP2
- Today (2025)
- 330,855 people
- By 2030
- 333,523 · +0.8%
- By 2040
- 335,583 · +1.4%
- By 2050
- 335,325 · +1.4%
- By 2075
- 342,853 · +3.6%
- By 2100
- 340,698 · +3.0%
Race, ethnicity, and origin ACS 2023
- Neighborhood character
- Diverse neighborhood (Simpson 0.67)
- Race & ethnicity
- Black 42% White 38% Hispanic / Latino 9% Two or more races 8% Asian 3% Native American 1%
- Hispanic origin (detail)
- Mexican 3% Puerto Rican 4%
- Common ancestry
- Slovak 1% Lithuanian 1% Italian 1%
- Foreign-born
- 7% · Canada, South Korea, Jamaica
- Languages at home
- 89% English-only · Spanish 6% German/W. Germanic 1% Other Indo-European 1%
Political lean MEDSL · Cumberland
- 2024 margin
- D (+13.4) · D 56.1% · R 42.7% · Other 1.2%
- 2008→2024 swing
- -4.3pp toward R · 2008: 17.7pp · 2024: 13.4pp
- All cycles
- 2024: D+13.4 2020: D+16.6 2016: D+16.0 2012: D+19.7 2008: D+17.7
Not yet ingested
- Civics
- —
Market trends
- HPI YoY
- ▼ -45.88%
- Current HPI
- 203.0731
- Rent YoY
- ▲ 2.82%
- Metro
- Fayetteville, NC
- State GDP YoY
- ▲ 3.28%
- F500 in state
- 26
Industry mix (Fortune 500 HQ in NC)
| Industry | F500 HQs | Revenue |
|---|---|---|
| Financial Services | 2 | $213B |
|
||
| Retail | 2 | $95B |
|
||
| Industrial Conglomerate | 1 | $38B |
|
||
| Metals / Steel | 1 | $35B |
|
||
| Utilities | 1 | $30B |
|
||
| Industrial Machinery | 1 | $19B |
|
||
Price history
+152.2% since first listed5 events — show timeline
- 2026-05-21 Price Changed $174,000 TMLS
- 2025-12-02 Price Changed $179,000 TMLS
- 2025-11-07 Listed $185,000 TMLS
- 2007-11-08 Sold (Public Records) $80,000 Public Records
- 2005-10-24 Sold (Public Records) $69,000 Public Records
Property tax history
+4.6%/yrLatest (2025): $1,287 · +55.0% YoY. Source: county tax records.
Cash-flow waterfall
monthlySold comps — $/sqft
last 12 mo · ≤1 miLoading sold comps…