 10-Plex
9700 Chalmers St · Detroit, MI
Flood risk 1/10 · Minimal
- FEMA flood zone
- X (unshaded)
- Chance of flooding over 30 yrs
- 0.0%
- Est. flood insurance / yr
- $507 – $1,088
Fire risk 1/10 · Minimal
- Est. fire insurance / yr
- $784 – $1,456
Heat risk 3/10 · Minor
- Hot days now (above 95°F)
- 7 days/yr
- Hot days in 30 yrs
- 15 days/yr
Wind risk 2/10 · Minimal
- Chance of severe wind over 30 yrs
- —
Air-quality risk 3/10 · Minor
- Unhealthy air days now
- 2 days/yr
- Unhealthy air days in 30 yrs
- 5 days/yr
Risk factors via First Street. Map © Google.
Why this score? — see what drove the B- grade
The composite is a weighted blend of 9 inputs, each scored 0–100. Each bar is that input's sub-score; the figure is the points it added to the 100-point composite (weight × sub-score).
- Cash flow +30.0/30.0
- 1% rule +10.0/10.0
- DSCR +10.0/10.0
- ARV discount +7.5/15.0
- Livability +3.7/5.0
- Rent growth +2.5/5.0
- Condition / age +2.2/5.0
- Schools +1.3/10.0
- Appreciation +0.0/10.0
$395,000
🖨 Deal sheet 📄 Offer letter ✓ Due diligence
Multi-family units
County records classify this as Multi-Family (5+ Unit). Listing-text estimate: 10 units. confirmed
5+ unit building — per-unit beds/baths from public records are typically unavailable; the breakdown below (if shown) is an estimate from the listing text.
Listing remarks MLS
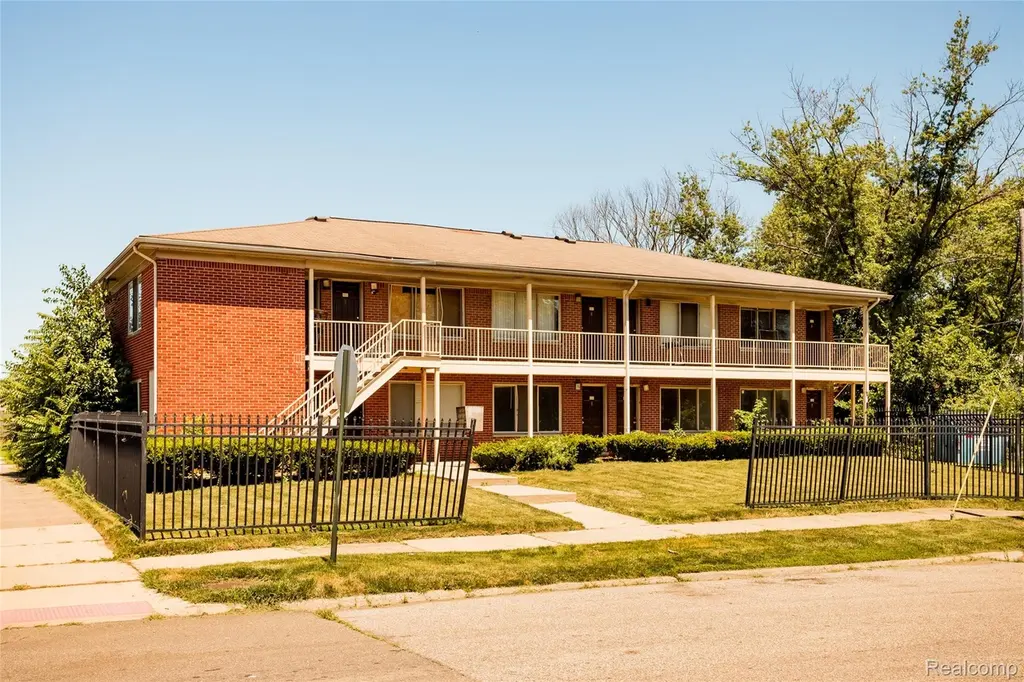
9700 Chalmers Street is a 10-unit apartment building located on Detroit's East Side. All units are one-bedroom, one-bathroom apartments with expansive layouts and abundant natural light. With strong occupancy rates and sustained demand for quality housing on Detroit's East Side, the property offers an excellent investment opportunity for buyers seeking stable cash flow, along with the ability to capitalize on untapped potential through future property enhancements. Property tours Thursday, June 4th at Noon
Key facts
- Expansive layouts
- Stable cash flow
- 7,405 sq ft lot
Tags
Property features AI
Finance
- Other: Lot dimensions approximately 50 x 85 (0.17 acres); Zoned for multifamily
Exterior
- Utilities: Public water; Public sewer
- Home design: Multi-family residential income property; Two stories; Brick construction; Block foundation
- Construction: Brick exterior; Block foundation
- Exterior features: Paved road access; Pets allowed
Interior
- Bathrooms: 10 full bathrooms
- Heating & cooling: Natural gas heating; No cooling
- Interior features: Walk-out, daylight, unfinished basement; Radiant heating
Neighborhood map
What this means for you Summary
Snapshot
- This is a 10 × 1-bed/1-bath units multifamily listed at $395k. Condition is rated fair.
Deal economics
- At list price, monthly cash flow is $5k ($54k/yr) — positive. Per door: $454/mo.
- The deal already cash-flows at list — no discount required.
- Meets the 1% rule at list price ($9k rent vs $395k).
- Recommended offer: $389k (1.5% below list) — sets the bar for market timing.
- Cap rate 20.1% vs local median 10.2% in Detroit — top-decile yield for the area; either an underpriced asset or a hidden risk that comps aren't pricing in. Stress-test before assuming the spread holds.
Location & tenants
- Location reads 73/100 on livability (#218 in MI) — a middle-class / working-renter tenant base. Strengths: amenities A+, commute A+, cost of living A+; Watch: schools F, crime F, employment F.
- Detroit Public Schools Community District (urban): math 10% / reading 24% proficiency, ranked #499 of 540 in MI (top 92%) — low school quality limits family demand, transient renter base, plan for 1-2y turnover; 90% free/reduced lunch — lower-income household profile, screen leases tightly.
- Market conditions: 190 active listings in the ZIP; lower-income renter base — watch delinquency; 2,639 units permitted in Wayne County in 2024 (1,216 in 5+ unit buildings).
- At $9,204/mo this rent would consume 325% of the median local household income ($34k/yr) (locally 1202% of renters already pay >50% of income on rent) — very limited rent-growth headroom before tenants either downsize or default.
Forward outlook
- Local home prices are declining (-3.0%/yr); year-one equity from $3k of loan paydown is wiped out by about $12k of value loss. Plan a longer hold.
- Wayne County population projected at -17% by 2050 — secular population decline; favor cash flow + early exit over multi-decade hold.
- At projected returns (-3.0% appreciation + 3.0% rent growth), your $111k cash investment doubles in ~3 years — after that, you're playing with house money.
Negotiation context
- It's been on market 23 days — a 2% lower offer ($389k) is reasonable based on typical stale-listing flexibility.
- 2 sale attempts with the ask held roughly flat each time — persistent listings suggest the price (not the market) is what's stuck; bring a comps-based counter.
Risks & watch-outs
- Watch-outs: built in 1959 — expect roof / HVAC / electrical / plumbing capex.
Questions for the listing agent
- Can we see the unit-by-unit rent roll, current vacancy, and any below-market leases? What's the average tenancy length?
- What capital expenditures (roof, boiler, parking lot, exteriors) have been made in the last 5 years, and what's planned in the next 2?
- Have any recent inspections been done? Can we get a copy of the seller's disclosures and any deferred-maintenance estimates?
- Built in 1959 — when were the roof, HVAC, electrical panel, plumbing, and water heater last replaced?
- Is there a deadline driving the sale (1031 exchange, divorce, estate, relocation)? That informs how much negotiation room exists.
- Schools are F-rated, which usually means shorter tenancies and higher turnover. Who's the typical renter profile here, and what's been the actual vacancy rate?
- Crime grade is F in this area — have there been break-ins, vandalism, or insurance claims at this property in the last 3 years? What carrier currently insures it and at what premium?
- What's the average days-on-market for RENTAL listings here right now (not sales)? A rising rental-DOM trend means longer vacancies and softer asking-rent achievability than the comps imply.
- What's the recent tenant-quality profile in this submarket — average credit score on applications, eviction rate, late-payment / NSF rate, and stable-employment percentage? A property-management company in the area should have these aggregated.
- How much new apartment / multifamily construction is in the pipeline within 1–3 miles? Heavy new supply (>2% of stock underway) typically softens rents 12–24 months out; light construction supports rent growth.
Investment metrics
- 1% rule
- 2.33% ✓
- Cap rate
- 20.09%
- Cash-on-cash
- 49.27%
- DSCR
- 3.19
- GRM
- 3.6
CMA / ARV
No comps found within radius.
Projected returns pro-forma
-3.0% appreciation · 3.0% rent growth · sell at horizon
- IRR
- 46.9%
- Equity multiple
- 3.04×
- Total profit
- $225,376
- Equity at exit
- $58,896
- IRR
- 52.6%
- Equity multiple
- 6.15×
- Total profit
- $569,266
- Equity at exit
- $34,152
Cash invested: $110,600 (down + closing). Projections, not guarantees.
Landlord ↔ Tenant lean methodology
- Overall (STATE)
- 62 Landlord-Friendly
- State Michigan
- 62 Landlord-Friendly · EVEN
- County
- — inherits STATE
- City
- — inherits STATE
ZIP-level market 48213
- Active inventory
- 190
- Price-to-rent
- 35.8×
Monthly cashflow live
- Estimated rent
- $9,204 high interval (Pro) →
- Mortgage (P&I)
- −$2,071
- Tax est. 1.5%
- −$494 /mo · $5,925/yr
- Insurance
- −$165
- HOA
- −$0
- Vacancy / Maint / Mgmt
- −$1,933
- Net cashflow
- $4,541
Break-even live
10-unit breakdown (identical units grouped — click to expand)
| Units | Beds | Baths | Est. rent |
|---|---|---|---|
| 10× units | 1 | 1 | $9,200 |
| #1 | 1 | 1 | $920 |
| #2 | 1 | 1 | $920 |
| #3 | 1 | 1 | $920 |
| #4 | 1 | 1 | $920 |
| #5 | 1 | 1 | $920 |
| #6 | 1 | 1 | $920 |
| #7 | 1 | 1 | $920 |
| #8 | 1 | 1 | $920 |
| #9 | 1 | 1 | $920 |
| #10 | 1 | 1 | $920 |
| Total (10 units) | $9,204 | ||
UW: 25.0% down · 7.5% · 30yr · 1.5% tax · 5.0% vac · 8.0% maint · 8.0% mgmt
Financing live
Cash to close
- Down payment
- $98,750
- Closing costs
- $11,850
- Reserves months
- —
- Total cash needed
- —
Loan-product check · same deal, 3 products live
Conventional
25% down · 7.5% · 30yr
- Down + closing
- —
- Monthly P&I
- —
- Monthly cashflow
- —
- DSCR
- —
- Eligible?
- —
Personal DTI + credit; lowest rate.
DSCR
20% down · 8.5% · 30yr
- Down + closing
- —
- Monthly P&I
- —
- Monthly cashflow
- —
- DSCR
- —
- Eligible?
- —
No personal income docs; deal must DSCR.
Hard money
10% down · 12.0% · 12mo
- Down + closing
- —
- Monthly P&I
- —
- Monthly cashflow
- —
- DSCR
- —
- Eligible?
- —
Short-term bridge; refi at stabilization.
Listing history 16 events
-
2026-06-18days on market $395,000 Active 23 DOM
-
2026-06-17days on market $395,000 Active 22 DOM
-
2026-06-15days on market $395,000 Active 20 DOM
-
2026-06-13days on market $395,000 Active 18 DOM
-
2026-06-13remarks 546-char remark
-
2026-06-13days on market $395,000 Active 17 DOM
-
2026-06-09days on market $395,000 Active 14 DOM
-
2026-06-08days on market $395,000 Active 13 DOM
-
2026-06-07days on market $395,000 Active 12 DOM
-
2026-06-04days on market $395,000 Active 9 DOM
-
2026-06-03days on market $395,000 Active 8 DOM
-
2026-06-02days on market $395,000 Active 7 DOM
-
2026-06-01days on market $395,000 Active 6 DOM
-
2026-05-31days on market $395,000 Active 5 DOM
-
2026-05-27$395,000 Active
-
2026-05-26$395,000 Active 511-char remark
Show marketing remark (511 chars)
9700 Chalmers Street is a 10-unit apartment building located on Detroit's East Side. All units are one-bedroom, one-bathroom apartments with expansive layouts and abundant natural light. With strong occupancy rates and sustained demand for quality housing on Detroit's East Side, the property offers an excellent investment opportunity for buyers seeking stable cash flow, along with the ability to capitalize on untapped potential through future property enhancements. Property tours Thursday, June 4th at Noon
ⓘ Source: listings_history table (triggers on properties + properties_extension) + one-shot
backfill from property_details.listing_events for pre-trigger history.
Climate risk First Street
- Flood 1/10 Low FEMA zone X (unshaded) · 0% chance over 30 yrs
- Wildfire 1/10 Low
- Heat 3/10 Moderate 7 d/yr ≥95°F today · 15 d/yr by 30 yrs out
- Wind 2/10 Low
- Air quality 3/10 Moderate 2 unhealthy d/yr today · 5 by 30 yrs out
Nearby sold comps map
Loading sold comps map…
Walkable amenities ~0.75 mi
Loading nearby amenities…
Taxation est. · year 1
- Rental income
- $110,448
- − Mortgage interest
- −$22,126
- − Property taxes
- −$5,925
- − Insurance
- −$1,975
- − Repairs & maintenance
- −$8,836
- − Management
- −$8,836
- − Depreciation
- −$11,491
- Taxable income
- $51,259
- Est. tax owed @ 24.0%
- −$12,302
- After-tax cash flow
- $42,195/yr
For passive investors: Depreciation is non-cash, so a rental often shows a tax loss while cash-flowing — sheltering income. Rental losses are passive: they offset passive income freely, and up to $25,000/yr can offset ordinary (W-2) income if you actively participate and your MAGI is under $100k (phasing out to $0 by $150k); unused losses carry forward. On sale, claimed depreciation is recaptured at up to 25%, and gains may owe capital-gains tax (a 1031 exchange can defer both). Figures are a year-1 estimate at your 24.0% rate — not tax advice; consult a CPA.
Condition & rehab AI · 1 photo
This 10-unit apartment building requires moderate renovations to improve its condition and increase its resale and rental value.
Repairs flagged
- Major exterior paint — Peeling paint on brick
- Major interior paint — Peeling paint and discoloration
- Major flooring — Worn carpet with visible stains
- Major bathroom fixtures — Worn and outdated
- Major kitchen appliances — Outdated and worn
Value-add opportunities
- Both exterior paint job — Enhances curb appeal and property value
- Both interior paint job — Improves living conditions and property value
- Both new flooring — Enhances living conditions and property value
- Both new bathroom fixtures — Improves living conditions and property value
- Both new kitchen appliances — Improves living conditions and property value
Renovation cost estimate screening
| Repair item | Severity | Est. cost |
|---|---|---|
| exterior paint · Peeling paint on brick | Major | $15,000–50,000 |
| interior paint · Peeling paint and discoloration | Major | $15,000–50,000 |
| flooring · Worn carpet with visible stains | Major | $15,000–50,000 |
| bathroom fixtures · Worn and outdated | Major | $15,000–50,000 |
| kitchen appliances · Outdated and worn | Major | $15,000–50,000 |
| Total estimated repair cost · 5 items | $75,000–250,000 |
Value-add ROI direction
- Both exterior paint job — Enhances curb appeal and property value ↑
- Both interior paint job — Improves living conditions and property value ↑
- Both new flooring — Enhances living conditions and property value ↑
- Both new bathroom fixtures — Improves living conditions and property value ↑
- Both new kitchen appliances — Improves living conditions and property value ↑
ⓘ Cost ranges are severity-bucket heuristics (US national rule-of-thumb). Get contractor quotes + a written scope before underwriting a rehab budget.
Schools (NCES district)
- District
- Detroit Public Schools Community District
- NCES district ID
- 2601103
- Math proficiency
- 10% ▼ -2.00%
- Reading proficiency
- 24% ▲ 6.00%
- Median HH income
- $25,815
- Composite
- 13.06/100
- National rank
- #9564
- State rank
- #499 of 540 in MI
Livability — Detroit
- Score
- 73/100
- State rank
- #218
- US rank
- #5427
Category grades
Schools grade is shown separately in the Schools card above.
Census & demographics
- Census place
- Detroit, MI
- County
- Wayne County · 1,562,939 people
- City population
- 572,865
- Metro
- Detroit-Warren-Dearborn, MI
- Population (ZIP)
- 20,075
- Household income
- $34,003
- Rent vs Own
- Severe rent burden
- 1202.0
Population outlook (Wayne County) Hauer SSP2
- Today (2025)
- 1,675,273 people
- By 2030
- 1,620,300 · -3.3%
- By 2040
- 1,502,341 · -10.3%
- By 2050
- 1,384,039 · -17.4%
- By 2075
- 1,124,592 · -32.9%
- By 2100
- 881,193 · -47.4%
Race, ethnicity, and origin ACS 2023
- Neighborhood character
- Predominantly Black (92%)
- Race & ethnicity
- Black 92% White 4% Hispanic / Latino 2% Two or more races 1%
- Common ancestry
- Slovak 1%
- Foreign-born
- 2% · Canada
- Languages at home
- 97% English-only · Arabic 1% Spanish 1%
Political lean MEDSL · Wayne
- 2024 margin
- Strong D (+29.0) · D 62.7% · R 33.7% · Other 3.6%
- 2008→2024 swing
- -20.5pp toward R · 2008: 49.5pp · 2024: 29.0pp
- All cycles
- 2024: D+29.0 2020: D+38.1 2016: D+37.3 2012: D+46.9 2008: D+49.5
Not yet ingested
- Civics
- —
Market trends
- HPI YoY
- ▼ -122.86%
- Current HPI
- 217.2037
- Rent YoY
- —
- Metro
- Detroit-Warren-Dearborn, MI
- State GDP YoY
- ▲ 1.37%
- F500 in state
- 28
Industry mix (Fortune 500 HQ in MI)
| Industry | F500 HQs | Revenue |
|---|---|---|
| Automotive Parts | 3 | $48B |
|
||
| Automotive | 2 | $372B |
|
||
| Chemicals | 1 | $45B |
|
||
| Automotive Retail | 1 | $29B |
|
||
| Healthcare / Medical Devices | 1 | $23B |
|
||
| Automotive Technology | 1 | $20B |
|
||
Price history
+0.0% since first listed2 events — show timeline
- 2026-05-27 Listed $395,000 REALCOMP
- 2026-05-26 Listed $395,000 MiRealSource-MiMLS
Cash-flow waterfall
monthlySold comps — $/sqft
last 12 mo · ≤1 miLoading sold comps…