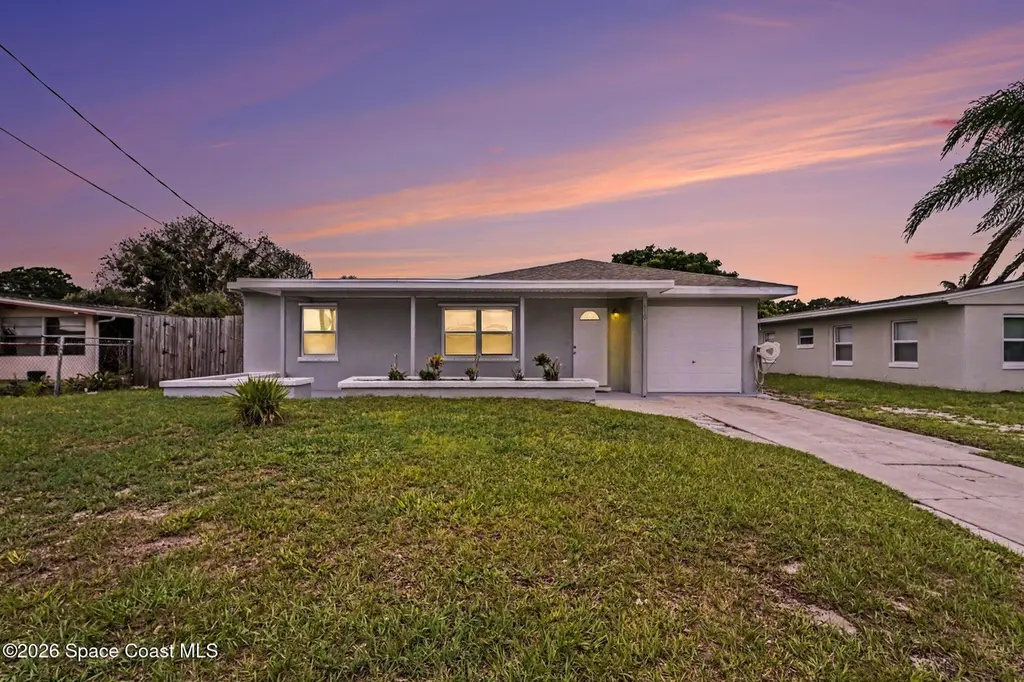
610 Japonica Dr · Melbourne, FL
Flood risk 1/10 · Minimal
- FEMA flood zone
- X (unshaded)
- Chance of flooding over 30 yrs
- 0.0%
- Est. flood insurance / yr
- $507 – $1,088
Fire risk 1/10 · Minimal
- Est. fire insurance / yr
- $947 – $1,759
Heat risk 10/10 · Severe
- Hot days now (above 105°F)
- 7 days/yr
- Hot days in 30 yrs
- 24 days/yr
Wind risk 10/10 · Severe
- Chance of severe wind over 30 yrs
- 99.0%
Air-quality risk 1/10 · Minimal
- Unhealthy air days now
- 0 days/yr
- Unhealthy air days in 30 yrs
- 0 days/yr
Risk factors via First Street. Map © Google.
Why this score? — see what drove the D- grade
The composite is a weighted blend of 9 inputs, each scored 0–100. Each bar is that input's sub-score; the figure is the points it added to the 100-point composite (weight × sub-score).
- Cash flow +12.7/30.0
- ARV discount +7.5/15.0
- Schools +4.7/10.0
- DSCR +3.8/10.0
- 1% rule +2.9/10.0
- Rent growth +2.9/5.0
- Livability +2.5/5.0
- Condition / age +2.5/5.0
- Appreciation +0.0/10.0
$255,000
🖨 Deal sheet (PDF) 📄 Offer letter ✓ Due diligence
Listing remarks MLS
Beautiful 3 bedroom 2 bath home with lots of extras! Indoor laundry room, 1 car garage, storage shed in backyard, bar and patio for entertaining in backyard, living room plus family room with fireplace. Gorgeous kitchen with island! Don''t wait this will not last long!!!
Key facts
- Storage shed
- Island in kitchen
- Deep double sink
Tags
Property features AI
Exterior
- Parking: Attached garage (1 car)
- Utilities: Public sewer; Water available; Electricity available; Cable available
- Home design: Single-family home; One story; Entry level: 1; Faces northeast
- Construction: Block, concrete and stucco construction; Shingle roof
- Exterior features: Storm shutters; Shed(s); Few trees; Wood privacy fencing enclosing backyard
Interior
- Kitchen: Dishwasher; Electric oven; Electric range; Microwave; Refrigerator
- Bedrooms: 3 bedrooms (one on entry level)
- Flooring: Carpet; Terrazzo; Tile
- Bathrooms: 2 full bathrooms
- Heating & cooling: Central heating (electric); Central air (electric)
- Interior features: Ceiling fans; Split bedrooms; Wood-burning fireplace; 10 total rooms
- Laundry & utility: Washer hookup; Electric dryer hookup (lower level)
Neighborhood map
What this means for you Summary
Snapshot
- This is a 3-bed/2.0-bath single-family listed at $255k.
Deal economics
- At list price, monthly cash flow is $-27 ($-328/yr) — negative.
- To cash-flow at today's rent, offer at most $250k (1.9% below list).
- To meet the 1% rule (rent ≥ 1% of price), the offer needs to be $202k (20.8% below list).
- Recommended offer: $202k (20.8% below list) — sets the bar for 1% rule.
Location & tenants
- Location reads: area grade D — affects rentability + tenant quality, not the cash-flow math above.
- Brevard (suburban): math 53% / reading 57% proficiency, ranked #19 of 73 in FL (top 26%) — acceptable for families but not a draw, mixed tenant base, ~2y average lease.
- Zoned schools: Harbor City Elementary School (math 57% / reading 47%, grade C-, #990 of 2,144 statewide, top 48%, 403 students, 70% FRL); Herbert C. Hoover Middle School (math 67% / reading 64%, grade A-, #95 of 571 statewide, top 17%, 506 students, 38% FRL); Melbourne Senior High School (math 43% / reading 57%, grade D+, #175 of 667 statewide, top 27%, 2,249 students, 31% FRL) — zoned schools at 46% FRL track the district average.
- Market conditions: Rents rising (+1.7%/yr); 202 active listings in the ZIP; 13 comparable units currently listed for rent nearby; rentals at typical pace (median 24d on market — plan ~3-4 weeks tenant-placement turnaround); 4,602 units permitted in Brevard County in 2024 (702 in 5+ unit buildings).
- This rent runs 44% of the median local income ($55k/yr) — at the standard rent-burdened threshold; future hikes will face affordability resistance.
Forward outlook
- Local home prices are declining (-3.0%/yr); year-one equity from $2k of loan paydown is wiped out by about $8k of value loss. Plan a longer hold.
- Brevard County population projected at +15% by 2050 — modest demand growth; plan on rents tracking national, not racing it.
Negotiation context
- Only 13 days on market — expect competitive offers; lowballing is unlikely to land.
- 2 sale attempts since 14y ago with the ask held roughly flat each time — persistent listings suggest the price (not the market) is what's stuck; bring a comps-based counter.
- Current owner paid $84k; list at $255k implies a 204% gain — meaningful room to come down on a strong offer.
Risks & watch-outs
- Watch-outs: built in 1956 — expect roof / HVAC / electrical / plumbing capex.
- Climate carrying-cost: severe wind risk, 99% chance of damaging wind over 30y; extreme-heat days projected 7→24/yr by 2055 (HVAC capex compounding) — expect insurance premiums to compound above CPI over the hold.
Questions for the listing agent
- What do current leases actually rent for vs. the listed asking? Can we see a recent rent roll and the last 12 months of T-12 income?
- Built in 1956 — when were the roof, HVAC, electrical panel, plumbing, and water heater last replaced?
- Is there a deadline driving the sale (1031 exchange, divorce, estate, relocation)? That informs how much negotiation room exists.
- The area grade is low — what's the realistic commute time and amenity access for the typical tenant pool here? Any planned neighborhood developments (good or bad) we should know about?
- What's the average days-on-market for RENTAL listings here right now (not sales)? A rising rental-DOM trend means longer vacancies and softer asking-rent achievability than the comps imply.
- What's the recent tenant-quality profile in this submarket — average credit score on applications, eviction rate, late-payment / NSF rate, and stable-employment percentage? A property-management company in the area should have these aggregated.
- How much new for-sale + rental construction is in the pipeline within 1–3 miles? Heavy new supply typically softens prices + rents 12–24 months out; constrained supply supports both.
Investment metrics
- 1% rule
- 0.79% ✗
- Cap rate
- 6.16%
- Cash-on-cash
- -0.46%
- DSCR
- 0.98
- GRM
- 10.5
CMA / ARV
No comps found within radius.
Projected returns pro-forma
-3.0% appreciation · 1.7% rent growth · sell at horizon
- IRR
- -18.4%
- Equity multiple
- 0.36×
- Total profit
- $-45,724
- Equity at exit
- $38,021
- IRR
- -13.4%
- Equity multiple
- 0.26×
- Total profit
- $-52,707
- Equity at exit
- $22,048
Cash invested: $71,400 (down + closing). Projections, not guarantees.
Landlord ↔ Tenant lean methodology
- Overall (STATE)
- 87 Strongly Landlord-Friendly
- State Florida
- 87 Strongly Landlord-Friendly · R+3
- County
- — inherits STATE
- City
- — inherits STATE
ZIP-level market 32901
- Home prices YoY
- -31.0%
- Rents YoY
- 1.7%
- Active inventory
- 202
- Price-to-rent
- 10.5×
Monthly cashflow live
- Estimated rent
- $2,020 high interval (Pro) →
- Mortgage (P&I)
- −$1,337
- Tax from tax record
- −$179 /mo · $2,154/yr
- Insurance
- −$106
- HOA
- −$0
- Vacancy / Maint / Mgmt
- −$424
- Net cashflow
- $-27
Break-even live
Sensitivity live
| Price | -10% $117 | -5% $45 | +0% $-27 | +5% $-99 | +10% $-172 |
|---|---|---|---|---|---|
| Rent | -10% $-187 | -5% $-107 | +0% $-27 | +5% $52 | +10% $132 |
| Rate | -1.0pp $101 | -0.5pp $38 | base $-27 | +0.5pp $-93 | +1.0pp $-161 |
UW: 25.0% down · 7.5% · 30yr · 1.5% tax · 5.0% vac · 8.0% maint · 8.0% mgmt
Financing live
Cash to close
- Down payment
- $63,750
- Closing costs
- $7,650
- Reserves months
- —
- Total cash needed
- —
Loan-product check · same deal, 3 products live
Conventional
25% down · 7.5% · 30yr
- Down + closing
- —
- Monthly P&I
- —
- Monthly cashflow
- —
- DSCR
- —
- Eligible?
- —
Personal DTI + credit; lowest rate.
DSCR
20% down · 8.5% · 30yr
- Down + closing
- —
- Monthly P&I
- —
- Monthly cashflow
- —
- DSCR
- —
- Eligible?
- —
No personal income docs; deal must DSCR.
Hard money
10% down · 12.0% · 12mo
- Down + closing
- —
- Monthly P&I
- —
- Monthly cashflow
- —
- DSCR
- —
- Eligible?
- —
Short-term bridge; refi at stabilization.
Rent comps 13 comps
| Address | Beds | Baths | Sqft | Rent | $/sqft | DOM | Units | Dist |
|---|---|---|---|---|---|---|---|---|
| 600 Hickory St Melbourne, FL | 2.0 | 1.0 | 912 | $1,695 | $1.86 | 21d | 1 | 0.13mi |
| 108 E Avenue D Melbourne, FL | 2.0 | 2.0 | 1087 | $1,800 | $1.66 | 24d | 1 | 0.38mi |
| 204 East Avenue C Unit C Melbourne, FL | 2.0 | 2.0 | 1600 | $2,500 | $1.56 | 14d | 1 | 0.40mi |
| 20 East Avenue B Apt 1 Melbourne, FL | 2.0 | 1.0 | 900 | $1,200 | $1.33 | 24d | 1 | 0.55mi |
| 1023 Gull Ln Melbourne, FL | 1.0–3.0 | 1.0–2.0 | 1072 | $2,249 | $2.10 | 14d | 31 | 0.58mi |
| 305 Sharon Dr Melbourne, FL | 4.0 | 2.0 | 1800 | $2,800 | $1.56 | 14d | 1 | 0.98mi |
| 208 Seminole Ave W Unit 1 Melbourne, FL | 2.0 | 1.0 | 966 | $2,900 | $3.00 | 24d | 1 | 1.20mi |
| 441 N Harbor City Blvd Unit C1 Melbourne, FL | 2.0 | 2.0 | 1533 | $1,950 | $1.27 | 24d | 1 | 1.25mi |
| 512 E Strawbridge Ave Melbourne, FL | 3.0 | 1.0 | 1487 | $2,400 | $1.61 | 21d | 1 | 1.35mi |
| 1810 Elizabeth St Melbourne, FL | 4.0 | 2.0 | 900 | $3,997 | $4.44 | 24d | 1 | 1.36mi |
| 1914 Fletcher St Melbourne, FL | 2.0 | 2.0 | 907 | $1,700 | $1.87 | 24d | 1 | 1.39mi |
| 1921 Park Ave Melbourne, FL | 3.0 | 1.0 | 900 | $1,775 | $1.97 | 24d | 1 | 1.45mi |
| 635 E New Haven Ave Melbourne, FL | 1.0–2.0 | 1.0–2.0 | 899 | $2,700 | $3.00 | 24d | 1 | 1.47mi |
Listing history 10 events
-
2026-06-19status $255,000 Pending 13 DOM
-
2026-06-18days on market $255,000 Active 13 DOM
-
2026-06-17days on market $255,000 Active 12 DOM
-
2026-06-16days on market $255,000 Active 11 DOM
-
2026-06-15days on market $255,000 Active 10 DOM
-
2026-06-14days on market $255,000 Active 8 DOM
-
2026-06-10days on market $255,000 Active 5 DOM
-
2026-06-08days on market $255,000 Active 3 DOM
-
2026-06-07remarks 699-char remark
-
2026-06-07$255,000 Active 2 DOM
ⓘ Source: listings_history table (triggers on properties + properties_extension) + one-shot
backfill from property_details.listing_events for pre-trigger history.
Tax reassessment forecast FL · Resets to sale price
- Current annual tax
- $2,154 · $179/mo
- Projected year-2 tax
- $2,154 · $179/mo
- Expected delta
- $0/yr ($0/mo · 0.0%)
ⓘ Screening estimate from a state-policy table — verify with the county assessor before closing.
Climate risk First Street
- Flood 1/10 Low FEMA zone X (unshaded) · 0% chance over 30 yrs
- Wildfire 1/10 Low
- Heat 10/10 Extreme 7 d/yr ≥105°F today · 24 d/yr by 30 yrs out
- Wind 10/10 Extreme 99% chance of damaging wind over 30 yrs
- Air quality 1/10 Low 0 unhealthy d/yr today · 0 by 30 yrs out
Nearby sold comps map
Loading sold comps map…
Walkable amenities ~0.75 mi
Loading nearby amenities…
Taxation est. · year 1
- Rental income
- $24,238
- − Mortgage interest
- −$14,284
- − Property taxes
- −$2,154
- − Insurance
- −$1,275
- − Repairs & maintenance
- −$1,939
- − Management
- −$1,939
- − Depreciation
- −$7,418
- Taxable loss
- −$4,771
- Est. tax savings @ 24.0%
- +$1,145
- After-tax cash flow
- $817/yr
For passive investors: Depreciation is non-cash, so a rental often shows a tax loss while cash-flowing — sheltering income. Rental losses are passive: they offset passive income freely, and up to $25,000/yr can offset ordinary (W-2) income if you actively participate and your MAGI is under $100k (phasing out to $0 by $150k); unused losses carry forward. On sale, claimed depreciation is recaptured at up to 25%, and gains may owe capital-gains tax (a 1031 exchange can defer both). Figures are a year-1 estimate at your 24.0% rate — not tax advice; consult a CPA.
Schools (NCES district)
- District
- Brevard
- NCES district ID
- 1200150
- Math proficiency
- 53% ▼ -9.00%
- Reading proficiency
- 57% ▼ -4.00%
- Median HH income
- $49,426
- Composite
- 46.86/100
- National rank
- #2370
- State rank
- #19 of 73 in FL
Livability — Melbourne
No livability data for this city. (Only ~50 U.S. cities are tracked.)
Census & demographics
- Census place
- Melbourne, FL
- County
- Brevard County · 602,871 people
- City population
- 178,420
- Metro
- Palm Bay-Melbourne-Titusville, FL
- Population (ZIP)
- 28,923
- Household income
- $54,651
- Rent vs Own
- Severe rent burden
- 2018.0
Population outlook (Brevard County) Hauer SSP2
- Today (2025)
- 623,254 people
- By 2030
- 648,420 · +4.0%
- By 2040
- 690,009 · +10.7%
- By 2050
- 715,669 · +14.8%
- By 2075
- 775,744 · +24.5%
- By 2100
- 776,687 · +24.6%
Race, ethnicity, and origin ACS 2023
- Neighborhood character
- Diverse neighborhood (Simpson 0.56)
- Race & ethnicity
- White 62% Black 18% Hispanic / Latino 11% Two or more races 8% Asian 4%
- Hispanic origin (detail)
- Mexican 2% Puerto Rican 4%
- Common ancestry
- Romanian 4% Lithuanian 3% Slovak 1%
- Foreign-born
- 14% · Canada, Vietnam, Jamaica
- Languages at home
- 85% English-only · Spanish 7% Other Indo-European 2% Vietnamese 2%
Political lean MEDSL · Brevard
- 2024 margin
- Strong R (+20.8) · D 39.1% · R 59.9% · Other 1.0%
- 2008→2024 swing
- -10.4pp toward R · 2008: -10.4pp · 2024: -20.8pp
- All cycles
- 2024: R+20.8 2020: R+16.4 2016: R+19.8 2012: R+12.7 2008: R+10.4
Not yet ingested
- Civics
- —
Market trends
- HPI YoY
- ▼ -145.13%
- Current HPI
- 322.934
- Rent YoY
- ▲ 1.70%
- Metro
- Palm Bay-Melbourne-Titusville, FL
- State GDP YoY
- ▲ 3.28%
- F500 in state
- 36
Industry mix (Fortune 500 HQ in FL)
| Industry | F500 HQs | Revenue |
|---|---|---|
| Industrial Technology | 2 | $29B |
|
||
| Insurance | 2 | $17B |
|
||
| Retail | 1 | $60B |
|
||
| Technology Distribution | 1 | $58B |
|
||
| Homebuilding | 1 | $35B |
|
||
| Technology Manufacturing | 1 | $35B |
|
||
Price history
+473.0% since first listed7 events — show timeline
- 2026-06-05 Listed $255,000 SCMLS
- 2012-11-20 Sold (Public Records) $84,000 Public Records
- 2012-11-02 Sold (MLS) $84,000 SCMLS
- 2012-09-26 Listed $79,900 SCMLS
- 2001-10-08 Sold (Public Records) $79,600 Public Records
- 1998-10-08 Sold (Public Records) $68,500 Public Records
- 1985-09-01 Sold (Public Records) $44,500 Public Records
Property tax history
+12.0%/yrLatest (2025): $2,154 · +5.9% YoY. Source: county tax records.
Cash-flow waterfall
monthlySold comps — $/sqft
last 12 mo · ≤1 miLoading sold comps…