23540 Highway 12 · Cherokee City, AR
Flood risk 1/10 · Minimal
- FEMA flood zone
- X (unshaded)
- Chance of flooding over 30 yrs
- 0.0%
- Est. flood insurance / yr
- $507 – $1,088
Fire risk 7/10 · Major
- Est. fire insurance / yr
- $1,499 – $2,785
Heat risk 5/10 · Moderate
- Hot days now (above 106°F)
- 7 days/yr
- Hot days in 30 yrs
- 20 days/yr
Wind risk 2/10 · Minimal
- Chance of severe wind over 30 yrs
- 5.0%
Air-quality risk 2/10 · Minimal
- Unhealthy air days now
- 0 days/yr
- Unhealthy air days in 30 yrs
- 1 days/yr
Risk factors via First Street. Map © Google.
Why this score? — see what drove the C grade
The composite is a weighted blend of 9 inputs, each scored 0–100. Each bar is that input's sub-score; the figure is the points it added to the 100-point composite (weight × sub-score).
- Cash flow +20.3/30.0
- Appreciation +10.0/10.0
- ARV discount +7.5/15.0
- DSCR +6.5/10.0
- 1% rule +4.1/10.0
- Schools +3.3/10.0
- Rent growth +2.5/5.0
- Condition / age +2.5/5.0
- Livability +2.2/5.0
$195,100
🖨 Deal sheet 📄 Offer letter ✓ Due diligence
Listing remarks MLS
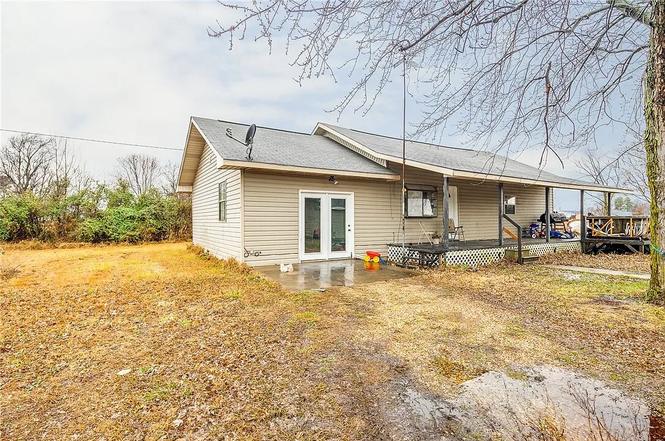
Affordable living on . 84 of an acre! Updates include painted cabinets, new doors, new light fixtures and a remodeled bathroom. Large storage/shop. Don't miss this opportunity to own a piece of NWA!
Key facts
- 0.84 acre lot
- Built 1979
Property features AI
Finance
- Other: Lot size approximately 0.84 acres
- HOA & community: Monthly association fee
Exterior
- Parking: Asphalt parking
- Security: Smoke detector(s)
- Utilities: Electricity available; Propane; Well water; Septic (septic tank)
- Home design: Single-story; Crawlspace foundation; Vinyl siding construction; Asphalt shingle roof; Built 25 years or older
- Construction: Vinyl siding; Asphalt shingle roof; Crawlspace foundation; Built 25 years or older
- Exterior features: Porch; Partial fencing; Rural lot outside city limits and not in a subdivision; Highway frontage
Interior
- Kitchen: Electric oven; Electric water heater
- Flooring: Carpet; Wood
- Bathrooms: 1 full bathroom
- Heating & cooling: Electric heating; Electric cooling
- Interior features: No additional interior features listed; TV antenna
Neighborhood map
What this means for you Summary
Snapshot
- This is a 3-bed/1.0-bath single-family listed at $195k.
Deal economics
- At list price, monthly cash flow is $251 ($3k/yr) — positive.
- The deal already cash-flows at list — no discount required.
- To meet the 1% rule (rent ≥ 1% of price), the offer needs to be $177k (9.4% below list).
- Recommended offer: $177k (9.4% below list) — sets the bar for 1% rule.
Location & tenants
- Location reads 44/100 on livability (#519 in AR) — a working-class tenant base; expect higher turnover. Strengths: cost of living A+, crime A; Watch: amenities F, commute F, employment F.
- Gentry School District (town): math 36% / reading 41% proficiency, ranked #71 of 238 in AR (top 30%) — families likely to look elsewhere, expect single-tenant / working-renter base with shorter leases.
- Market conditions: 255 active listings in the ZIP; 4,359 units permitted in Benton County in 2024 (402 in 5+ unit buildings).
Forward outlook
- In year one you build about $21k of equity ($1k loan paydown + $20k appreciation (10.0% local appreciation)).
- Benton County population projected at +56% by 2050 — long-run rental-demand tailwind backs the buy-and-hold thesis.
- At projected returns (10.0% appreciation + 3.0% rent growth), your $55k cash investment doubles in ~3 years — after that, you're playing with house money.
- By year 2, paydown + projected appreciation supports a ~$34k cash-out refi (75% LTV) — recoverable capital for the next deal without selling this one.
Negotiation context
- Only 1 days on market — expect competitive offers; lowballing is unlikely to land.
- 3 sale attempts since 13y ago with the ask held roughly flat each time — persistent listings suggest the price (not the market) is what's stuck; bring a comps-based counter.
- Current owner paid $140k; 39% above their basis — modest negotiation headroom, anchor on the comps not their cost.
Risks & watch-outs
- Climate carrying-cost: major wildfire risk; extreme-heat days projected 7→20/yr by 2055 (HVAC capex compounding) — expect insurance premiums to compound above CPI over the hold.
Questions for the listing agent
- Built in 1979 — when were the roof, HVAC, electrical panel, plumbing, and water heater last replaced?
- Is there a deadline driving the sale (1031 exchange, divorce, estate, relocation)? That informs how much negotiation room exists.
- What's the average days-on-market for RENTAL listings here right now (not sales)? A rising rental-DOM trend means longer vacancies and softer asking-rent achievability than the comps imply.
- What's the recent tenant-quality profile in this submarket — average credit score on applications, eviction rate, late-payment / NSF rate, and stable-employment percentage? A property-management company in the area should have these aggregated.
- How much new for-sale + rental construction is in the pipeline within 1–3 miles? Heavy new supply typically softens prices + rents 12–24 months out; constrained supply supports both.
Investment metrics
- 1% rule
- 0.91% ✗
- Cap rate
- 7.84%
- Cash-on-cash
- 5.51%
- DSCR
- 1.25
- GRM
- 9.2
CMA / ARV
No comps found within radius.
Projected returns pro-forma
10.0% appreciation · 3.0% rent growth · sell at horizon
- IRR
- 28.3%
- Equity multiple
- 3.24×
- Total profit
- $122,139
- Equity at exit
- $175,762
- IRR
- 24.6%
- Equity multiple
- 7.35×
- Total profit
- $346,918
- Equity at exit
- $379,036
Cash invested: $54,628 (down + closing). Projections, not guarantees.
Landlord ↔ Tenant lean methodology
- Overall (STATE)
- 92 Strongly Landlord-Friendly
- State Arkansas
- 92 Strongly Landlord-Friendly · R+14
- County
- — inherits STATE
- City
- — inherits STATE
ZIP-level market 72734
- Home prices YoY
- 12.2%
- Active inventory
- 255
- Price-to-rent
- 9.2×
Monthly cashflow live
- Estimated rent
- $1,767 medium interval (Pro) →
- Mortgage (P&I)
- −$1,023
- Tax from tax record
- −$40 /mo · $486/yr
- Insurance
- −$81
- HOA
- −$0
- Vacancy / Maint / Mgmt
- −$371
- Net cashflow
- $251
Break-even live
UW: 25.0% down · 7.5% · 30yr · 1.5% tax · 5.0% vac · 8.0% maint · 8.0% mgmt
Financing live
Cash to close
- Down payment
- $48,775
- Closing costs
- $5,853
- Reserves months
- —
- Total cash needed
- —
Loan-product check · same deal, 3 products live
Conventional
25% down · 7.5% · 30yr
- Down + closing
- —
- Monthly P&I
- —
- Monthly cashflow
- —
- DSCR
- —
- Eligible?
- —
Personal DTI + credit; lowest rate.
DSCR
20% down · 8.5% · 30yr
- Down + closing
- —
- Monthly P&I
- —
- Monthly cashflow
- —
- DSCR
- —
- Eligible?
- —
No personal income docs; deal must DSCR.
Hard money
10% down · 12.0% · 12mo
- Down + closing
- —
- Monthly P&I
- —
- Monthly cashflow
- —
- DSCR
- —
- Eligible?
- —
Short-term bridge; refi at stabilization.
Listing history 2 events
-
2026-06-19remarks 686-char remark
-
2026-06-19$195,100 Active 1 DOM
ⓘ Source: listings_history table (triggers on properties + properties_extension) + one-shot
backfill from property_details.listing_events for pre-trigger history.
Tax reassessment forecast AR · Resets to sale price
- Current annual tax
- $486 · $40/mo
- Projected year-2 tax
- $1,249 · $104/mo
- Expected delta
- +$763/yr (+$64/mo · 157.0%)
ⓘ Screening estimate from a state-policy table — verify with the county assessor before closing.
Climate risk First Street
- Flood 1/10 Low FEMA zone X (unshaded) · 0% chance over 30 yrs
- Wildfire 7/10 Severe
- Heat 5/10 Major 7 d/yr ≥106°F today · 20 d/yr by 30 yrs out
- Wind 2/10 Low 5% chance of damaging wind over 30 yrs
- Air quality 2/10 Low 0 unhealthy d/yr today · 1 by 30 yrs out
Nearby sold comps map
Loading sold comps map…
Walkable amenities ~0.75 mi
Loading nearby amenities…
Taxation est. · year 1
- Rental income
- $21,202
- − Mortgage interest
- −$10,929
- − Property taxes
- −$486
- − Insurance
- −$976
- − Repairs & maintenance
- −$1,696
- − Management
- −$1,696
- − Depreciation
- −$5,676
- Taxable loss
- −$256
- Est. tax savings @ 24.0%
- +$61
- After-tax cash flow
- $3,072/yr
For passive investors: Depreciation is non-cash, so a rental often shows a tax loss while cash-flowing — sheltering income. Rental losses are passive: they offset passive income freely, and up to $25,000/yr can offset ordinary (W-2) income if you actively participate and your MAGI is under $100k (phasing out to $0 by $150k); unused losses carry forward. On sale, claimed depreciation is recaptured at up to 25%, and gains may owe capital-gains tax (a 1031 exchange can defer both). Figures are a year-1 estimate at your 24.0% rate — not tax advice; consult a CPA.
Schools (NCES district)
- District
- Gentry School District
- NCES district ID
- 0506540
- Math proficiency
- 36% ▼ -15.00%
- Reading proficiency
- 41% ▼ -5.00%
- Median HH income
- $45,160
- Composite
- 32.77/100
- National rank
- #5629
- State rank
- #71 of 238 in AR
Livability — Cherokee City
- Score
- 44/100
- State rank
- #519
- US rank
- #26745
Category grades
Schools grade is shown separately in the Schools card above.
Census & demographics
- Population (ZIP)
- 8,385
Population outlook (Benton County) Hauer SSP2
- Today (2025)
- 318,683 people
- By 2030
- 353,481 · +10.9%
- By 2040
- 425,280 · +33.4%
- By 2050
- 497,239 · +56.0%
- By 2075
- 662,114 · +107.8%
- By 2100
- 776,431 · +143.6%
Race, ethnicity, and origin ACS 2023
- Neighborhood character
- Diverse neighborhood (Simpson 0.62)
- Race & ethnicity
- White 60% Two or more races 25% Hispanic / Latino 13% Asian 5% Native American 2% Pacific Islander 1%
- Hispanic origin (detail)
- Mexican 6%
- Common ancestry
- Serbian 2% Lithuanian 1% Subsaharan African 1%
- Foreign-born
- 6% · Canada
- Languages at home
- 89% English-only · Other Asian/Pacific 6% Spanish 4% German/W. Germanic 1%
Political lean MEDSL · Benton
- 2024 margin
- Strong R (+27.0) · D 35.2% · R 62.1% · Other 2.7%
- 2008→2024 swing
- +9.6pp toward D · 2008: -36.5pp · 2024: -27.0pp
- All cycles
- 2024: R+27.0 2020: R+26.4 2016: R+34.9 2012: R+40.4 2008: R+36.5
Not yet ingested
- Civics
- —
Market trends
- HPI YoY
- ▲ 44.03%
- Current HPI
- 405.1448
- Rent YoY
- —
- Metro
- —
- State GDP YoY
- ▲ 3.80%
- F500 in state
- 10
Industry mix (Fortune 500 HQ in AR)
| Industry | F500 HQs | Revenue |
|---|---|---|
| Retail | 1 | $681B |
|
||
| Food / Agriculture | 1 | $53B |
|
||
| Retail / Energy | 1 | $22B |
|
||
| Transportation / Logistics | 1 | $12B |
|
||
| Energy | 1 | $4B |
|
||
Price history
+191.2% since first listed11 events — show timeline
- 2026-06-18 Listed $195,100 NWARMLS
- 2025-11-24 Price Changed $199,000 NWARMLS
- 2025-10-28 Price Changed $209,900 NWARMLS
- 2025-10-01 Price Changed $219,900 NWARMLS
- 2025-09-09 Sold (Public Records) $140,000 Public Records
- 2020-01-15 Sold (Public Records) $100,000 Public Records
- 2020-01-13 Sold (MLS) $100,000 NWARMLS
- 2019-12-03 Listed $110,000 NWARMLS
- 2014-05-13 Sold (MLS) $31,649 NWARMLS
- 2013-09-23 Listed $25,900 NWARMLS
- 2004-06-10 Sold (Public Records) $67,000 Public Records
Property tax history
+4.5%/yrLatest (2025): $486 · -2.7% YoY. Source: county tax records.
Cash-flow waterfall
monthlySold comps — $/sqft
last 12 mo · ≤1 miLoading sold comps…