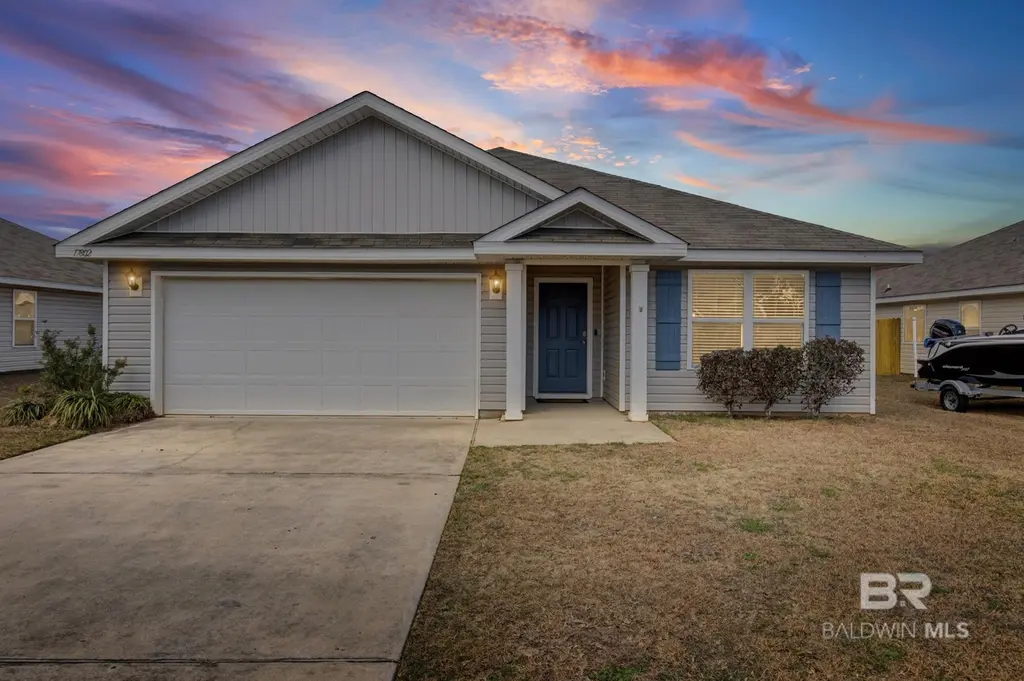
17802 Lewis Smith Dr · Bon Secour, AL
Flood risk 1/10 · Minimal
- FEMA flood zone
- X (unshaded)
- Chance of flooding over 30 yrs
- 0.0%
- Est. flood insurance / yr
- $507 – $1,088
Fire risk 3/10 · Minor
- Est. fire insurance / yr
- $916 – $1,700
Heat risk 10/10 · Severe
- Hot days now (above 105°F)
- 7 days/yr
- Hot days in 30 yrs
- 25 days/yr
Wind risk 9/10 · Severe
- Chance of severe wind over 30 yrs
- 99.0%
Air-quality risk 2/10 · Minimal
- Unhealthy air days now
- 1 days/yr
- Unhealthy air days in 30 yrs
- 1 days/yr
Risk factors via First Street. Map © Google.
Why this score? — see what drove the D- grade
The composite is a weighted blend of 9 inputs, each scored 0–100. Each bar is that input's sub-score; the figure is the points it added to the 100-point composite (weight × sub-score).
- ARV discount +12.1/15.0
- Cash flow +9.2/30.0
- Schools +3.9/10.0
- Livability +3.2/5.0
- Rent growth +3.0/5.0
- DSCR +2.6/10.0
- Condition / age +2.5/5.0
- 1% rule +1.8/10.0
- Appreciation +0.0/10.0
$263,900
🖨 Deal sheet 📄 Offer letter ✓ Due diligence
Listing remarks MLS
Welcome to this GOLD FORTIFIED 3-bedroom, 2-bath home located in the amenity-rich Hidden Lakes community in Foley where comfort, convenience, and modern living come together. Thoughtfully designed with today’s lifestyle in mind, this home offers a functional layout, stylish finishes, and easy access to everything the area has to offer. The open-concept living space is filled with natural light and flows seamlessly into a modern kitchen featuring contemporary cabinetry, ample counter space, and a layout ideal for everyday living and entertaining. The spacious primary suite provides a relaxing retreat with an en suite bath, separate shower, double vanities, and generous closet space, while two additional bedrooms offer flexibility for guests, a home office, or family living. This home has a covered back patio (12'x8') with view of trees for added privacy. Hidden Lakes is known for its impressive amenities, including a resort-style pool, basketball courts, scenic lake, and walking paths—perfect for enjoying the coastal Alabama lifestyle. Conveniently located near Highway 59 and the Foley Beach Express, this home offers quick access to Gulf Shores beaches, OWA, Tanger Outlets, shopping, dining, and entertainment. Modern, move-in ready, and ideally located—this Hidden Lakes home delivers the best of Foley living with comfort and convenience at your doorstep. Some of the photos are virtually staged. Buyer to verify all information during due diligence.
Key facts
- Covered back patio
- Resort-style pool
- Modern kitchen
Tags
Neighborhood map
What this means for you Summary
Snapshot
- This is a 3-bed/2.0-bath single-family listed at $264k.
Deal economics
- At list price, monthly cash flow is $-197 ($-2k/yr) — negative.
- To cash-flow at today's rent, offer at most $229k (13.2% below list).
- To meet the 1% rule (rent ≥ 1% of price), the offer needs to be $178k (32.5% below list).
- Recommended offer: $178k (32.5% below list) — sets the bar for 1% rule.
- Cap rate 5.4% vs local median 4.1% in Bon Secour — top-decile yield for the area; either an underpriced asset or a hidden risk that comps aren't pricing in. Stress-test before assuming the spread holds.
Location & tenants
- Location reads 64/100 on livability (#162 in AL) — a middle-class / working-renter tenant base. Strengths: crime A+, housing A+, cost of living A-; Watch: amenities F, commute F, health & safety D-.
- Baldwin County (rural): math 33% / reading 57% proficiency, ranked #18 of 129 in AL (top 14%) — families likely to look elsewhere, expect single-tenant / working-renter base with shorter leases.
- Market conditions: Rents rising (+1.8%/yr); 875 active listings in the ZIP; 3,883 units permitted in Baldwin County in 2024 (481 in 5+ unit buildings).
- This rent runs 32% of the median local income ($67k/yr) — at the standard rent-burdened threshold; future hikes will face affordability resistance.
Forward outlook
- Local home prices are declining (-3.0%/yr); year-one equity from $2k of loan paydown is wiped out by about $8k of value loss. Plan a longer hold.
- Baldwin County population projected at +42% by 2050 — long-run rental-demand tailwind backs the buy-and-hold thesis.
Negotiation context
- It's been on market 120 days — a 9% lower offer ($240k) is reasonable based on typical stale-listing flexibility.
- 4 sale attempts since 8y ago with the ask held roughly flat each time — persistent listings suggest the price (not the market) is what's stuck; bring a comps-based counter.
- Current owner paid $159k; list at $264k implies a 66% gain — meaningful room to come down on a strong offer.
Risks & watch-outs
- Climate carrying-cost: severe wind risk, 99% chance of damaging wind over 30y; extreme-heat days projected 7→25/yr by 2055 (HVAC capex compounding) — expect insurance premiums to compound above CPI over the hold.
Questions for the listing agent
- What do current leases actually rent for vs. the listed asking? Can we see a recent rent roll and the last 12 months of T-12 income?
- It's been on market 120 days. Have you received any prior offers? Is the seller open to a 32% concession, seller financing, or rate buy-down credit?
- What does the HOA fee cover, when was the last increase, and are there any pending special assessments or reserve-fund shortfalls?
- Why hasn't it sold? Are there any deal-killer items the seller is aware of (foundation, flood, title, zoning, code violations)?
- Is there a deadline driving the sale (1031 exchange, divorce, estate, relocation)? That informs how much negotiation room exists.
- The area grade is low — what's the realistic commute time and amenity access for the typical tenant pool here? Any planned neighborhood developments (good or bad) we should know about?
- What's the average days-on-market for RENTAL listings here right now (not sales)? A rising rental-DOM trend means longer vacancies and softer asking-rent achievability than the comps imply.
- What's the recent tenant-quality profile in this submarket — average credit score on applications, eviction rate, late-payment / NSF rate, and stable-employment percentage? A property-management company in the area should have these aggregated.
- How much new for-sale + rental construction is in the pipeline within 1–3 miles? Heavy new supply typically softens prices + rents 12–24 months out; constrained supply supports both.
Investment metrics
- 1% rule
- 0.68% ✗
- Cap rate
- 5.40%
- Cash-on-cash
- -3.19%
- DSCR
- 0.86
- GRM
- 12.3
CMA / ARV
- ARV (median comp)
- $294,232
- List price
- $263,900
- Delta
- -10.31%
- Verdict
- UNDERPRICED
- Comps
- 20 within 1.0 mi
Show comp detail 12 sales within ~0.75 mi
| Address | Dist | Beds/Ba | Sqft | Sold | Price | $/sf | Match |
|---|---|---|---|---|---|---|---|
| 17344 Harding Dr | 0.03mi | 3/2.0 | 1,615 (-3%) | 0mo | $267,500 | $166 | 93 |
| 18233 Lewis Smith Dr | 0.34mi | 4/2.0 (+1) | 1,768 (+6%) | 0mo | $295,000 | $167 | 69 |
| 17950 Piney Cir | 0.61mi | 3/2.0 | 1,656 (-1%) | 3mo | $311,938 | $188 | 68 |
| 8056 Knoll Rd | 0.64mi | 3/2.0 | 1,765 (+6%) | 1mo | $336,378 | $191 | 60 |
| 17838 Piney Cir | 0.61mi | 3/2.0 | 1,780 (+6%) | 2mo | $325,961 | $183 | 59 |
| 18070 Piney Cir | 0.71mi | 3/2.0 | 1,765 (+6%) | 2mo | $333,529 | $189 | 56 |
| 17918 Piney Cir | 0.58mi | 3/2.0 | 1,858 (+11%) | 3mo | $334,035 | $180 | 52 |
| 17951 Piney Cir | 0.62mi | 3/2.0 | 1,858 (+11%) | 1mo | $338,377 | $182 | 52 |
| 17814 Piney Cir | 0.63mi | 3/2.0 | 1,858 (+11%) | 1mo | $341,151 | $184 | 52 |
| 7589 Courant Cir | 0.52mi | 3/2.0 | 1,430 (-14%) | 2mo | $285,476 | $200 | 50 |
| 18149 Piney Cir | 0.66mi | 3/2.0 | 1,858 (+11%) | 1mo | $337,276 | $182 | 50 |
| 16780 Rocher Ct | 0.53mi | 4/2.0 (+1) | 1,440 (-14%) | 2mo | $283,040 | $197 | 46 |
Match score weights: distance 35% · size 25% · config 20% · recency 20%. Top-matched comps best support the ARV.
Projected returns pro-forma
-3.0% appreciation · 1.81% rent growth · sell at horizon
- IRR
- -22.9%
- Equity multiple
- 0.22×
- Total profit
- $-57,501
- Equity at exit
- $39,348
- IRR
- -20.3%
- Equity multiple
- -0.02×
- Total profit
- $-75,081
- Equity at exit
- $22,817
Cash invested: $73,892 (down + closing). Projections, not guarantees.
Landlord ↔ Tenant lean methodology
- Overall (STATE)
- 90 Strongly Landlord-Friendly
- State Alabama
- 90 Strongly Landlord-Friendly · R+15
- County
- — inherits STATE
- City
- — inherits STATE
ZIP-level market 36535
- Home prices YoY
- -24.9%
- Rents YoY
- 1.8%
- Active inventory
- 875
- Price-to-rent
- 12.3×
Monthly cashflow live
- Estimated rent
- $1,782 medium interval (Pro) →
- Mortgage (P&I)
- −$1,384
- Tax from tax record
- −$64 /mo · $771/yr
- Insurance
- −$110
- HOA
- −$46
- Vacancy / Maint / Mgmt
- −$374
- Net cashflow
- $-197
Break-even live
UW: 25.0% down · 7.5% · 30yr · 1.5% tax · 5.0% vac · 8.0% maint · 8.0% mgmt
Financing live
Cash to close
- Down payment
- $65,975
- Closing costs
- $7,917
- Reserves months
- —
- Total cash needed
- —
Loan-product check · same deal, 3 products live
Conventional
25% down · 7.5% · 30yr
- Down + closing
- —
- Monthly P&I
- —
- Monthly cashflow
- —
- DSCR
- —
- Eligible?
- —
Personal DTI + credit; lowest rate.
DSCR
20% down · 8.5% · 30yr
- Down + closing
- —
- Monthly P&I
- —
- Monthly cashflow
- —
- DSCR
- —
- Eligible?
- —
No personal income docs; deal must DSCR.
Hard money
10% down · 12.0% · 12mo
- Down + closing
- —
- Monthly P&I
- —
- Monthly cashflow
- —
- DSCR
- —
- Eligible?
- —
Short-term bridge; refi at stabilization.
HOA detail
- Monthly dues
- $46 · $552/yr
- Likely covers
- pool
Listing history 24 events
-
2026-06-19days on market $263,900 Active 120 DOM
-
2026-06-18days on market $263,900 Active 119 DOM
-
2026-06-17days on market $263,900 Active 118 DOM
-
2026-06-16days on market $263,900 Active 117 DOM
-
2026-06-15days on market $263,900 Active 116 DOM
-
2026-06-14pricedays on market $263,900 Active 114 DOM
-
2026-06-13days on market $267,000 Active 113 DOM
-
2026-06-10days on market $267,000 Active 111 DOM
-
2026-06-09days on market $267,000 Active 110 DOM
-
2026-06-08days on market $267,000 Active 109 DOM
-
2026-06-07days on market $267,000 Active 108 DOM
-
2026-06-05days on market $267,000 Active 105 DOM
-
2026-06-03days on market $267,000 Active 104 DOM
-
2026-06-02days on market $267,000 Active 103 DOM
-
2026-06-01days on market $267,000 Active 102 DOM
-
2026-05-31days on market $267,000 Active 101 DOM
-
2026-05-30days on market $267,000 Active 100 DOM
-
2026-02-19$267,000 Active 1488-char remark
Show marketing remark (1488 chars)
Welcome to this GOLD FORTIFIED 3-bedroom, 2-bath home located in the amenity-rich Hidden Lakes community in Foley where comfort, convenience, and modern living come together. Thoughtfully designed with today’s lifestyle in mind, this home offers a functional layout, stylish finishes, and easy access to everything the area has to offer. The open-concept living space is filled with natural light and flows seamlessly into a modern kitchen featuring contemporary cabinetry, ample counter space, and a layout ideal for everyday living and entertaining. The spacious primary suite provides a relaxing retreat with an en suite bath, separate shower, double vanities, and generous closet space, while two additional bedrooms offer flexibility for guests, a home office, or family living. This home has a covered back patio (12'x8') with view of trees for added privacy. Hidden Lakes is known for its impressive amenities, including a resort-style pool, basketball courts, scenic lake, and walking paths—perfect for enjoying the coastal Alabama lifestyle. Conveniently located near Highway 59 and the Foley Beach Express, this home offers quick access to Gulf Shores beaches, OWA, Tanger Outlets, shopping, dining, and entertainment. Modern, move-in ready, and ideally located—this Hidden Lakes home delivers the best of Foley living with comfort and convenience at your doorstep. Some of the photos are virtually staged. Buyer to verify all information during due diligence.
-
2025-08-26price $235,000
-
2025-08-13price $245,000
-
2025-08-06$249,000 Active
-
2019-01-29soldstatus $158,550
-
2018-11-05$159,600
-
2018-10-09$166,850
ⓘ Source: listings_history table (triggers on properties + properties_extension) + one-shot
backfill from property_details.listing_events for pre-trigger history.
Tax reassessment forecast AL · Resets to sale price
- Current annual tax
- $771 · $64/mo
- Projected year-2 tax
- $1,082 · $90/mo
- Expected delta
- +$311/yr (+$26/mo · 40.4%)
ⓘ Screening estimate from a state-policy table — verify with the county assessor before closing.
Climate risk First Street
- Flood 1/10 Low FEMA zone X (unshaded) · 0% chance over 30 yrs
- Wildfire 3/10 Moderate
- Heat 10/10 Extreme 7 d/yr ≥105°F today · 25 d/yr by 30 yrs out
- Wind 9/10 Extreme 99% chance of damaging wind over 30 yrs
- Air quality 2/10 Low 1 unhealthy d/yr today · 1 by 30 yrs out
Nearby sold comps map
Loading sold comps map…
Walkable amenities ~0.75 mi
Loading nearby amenities…
Taxation est. · year 1
- Rental income
- $21,380
- − Mortgage interest
- −$14,783
- − Property taxes
- −$771
- − Insurance
- −$1,320
- − Repairs & maintenance
- −$1,710
- − Management
- −$1,710
- − HOA
- −$552
- − Depreciation
- −$7,677
- Taxable loss
- −$7,143
- Est. tax savings @ 24.0%
- +$1,714
- After-tax cash flow
- $-645/yr
For passive investors: Depreciation is non-cash, so a rental often shows a tax loss while cash-flowing — sheltering income. Rental losses are passive: they offset passive income freely, and up to $25,000/yr can offset ordinary (W-2) income if you actively participate and your MAGI is under $100k (phasing out to $0 by $150k); unused losses carry forward. On sale, claimed depreciation is recaptured at up to 25%, and gains may owe capital-gains tax (a 1031 exchange can defer both). Figures are a year-1 estimate at your 24.0% rate — not tax advice; consult a CPA.
Schools (NCES district)
- District
- Baldwin County
- NCES district ID
- 0100270
- Math proficiency
- 33% ▼ -26.00%
- Reading proficiency
- 57% ▲ 1.00%
- Median HH income
- $50,677
- Composite
- 38.61/100
- National rank
- #4157
- State rank
- #18 of 129 in AL
Livability — Bon Secour
- Score
- 64/100
- State rank
- #162
- US rank
- #14482
Category grades
Schools grade is shown separately in the Schools card above.
Census & demographics
- Census place
- Bon Secour, AL
- County
- Baldwin County · 181,514 people
- City population
- 923
- Metro
- Daphne-Fairhope-Foley, AL
- Population (ZIP)
- 40,628
- Household income
- $66,714
- Rent vs Own
- Severe rent burden
- 803.0
Population outlook (Baldwin County) Hauer SSP2
- Today (2025)
- 248,264 people
- By 2030
- 270,315 · +8.9%
- By 2040
- 312,967 · +26.1%
- By 2050
- 352,262 · +41.9%
- By 2075
- 438,841 · +76.8%
- By 2100
- 487,736 · +96.5%
Race, ethnicity, and origin ACS 2023
- Neighborhood character
- Predominantly White (78%)
- Race & ethnicity
- White 78% Hispanic / Latino 10% Two or more races 8% Black 5% Asian 2%
- Hispanic origin (detail)
- Mexican 6%
- Common ancestry
- Lithuanian 2% Romanian 2% Slovak 1%
- Foreign-born
- 6% · Canada, China
- Languages at home
- 89% English-only · Spanish 7% Other Indo-European 2% Chinese 1%
Political lean MEDSL · Baldwin
- 2024 margin
- Solid R (+58.2) · D 20.5% · R 78.7%
- 2008→2024 swing
- -6.7pp toward R · 2008: -51.5pp · 2024: -58.2pp
- All cycles
- 2024: R+58.2 2020: R+53.8 2016: R+57.8 2012: R+55.8 2008: R+51.5
Not yet ingested
- Civics
- —
Market trends
- HPI YoY
- ▼ -86.82%
- Current HPI
- 262.2796
- Rent YoY
- ▲ 1.81%
- Metro
- Daphne-Fairhope-Foley, AL
- State GDP YoY
- ▲ 2.94%
- F500 in state
- 4
Industry mix (Fortune 500 HQ in AL)
| Industry | F500 HQs | Revenue |
|---|---|---|
| Financial Services | 1 | $8B |
|
||
| Healthcare | 1 | $5B |
|
||
Price history
+60.0% since first listed7 events — show timeline
- 2026-02-19 Listed $267,000 BCAR
- 2025-08-26 Price Changed $235,000 BCAR
- 2025-08-13 Price Changed $245,000 BCAR
- 2025-08-06 Listed $249,000 BCAR
- 2019-01-29 Sold (MLS) $158,550 BCAR
- 2018-11-05 Listed $159,600 BCAR
- 2018-10-09 Listed $166,850 BCAR
Property tax history
+29.7%/yrLatest (2025): $771 · +12.0% YoY. Source: county tax records.
Cash-flow waterfall
monthlySold comps — $/sqft
last 12 mo · ≤1 miLoading sold comps…