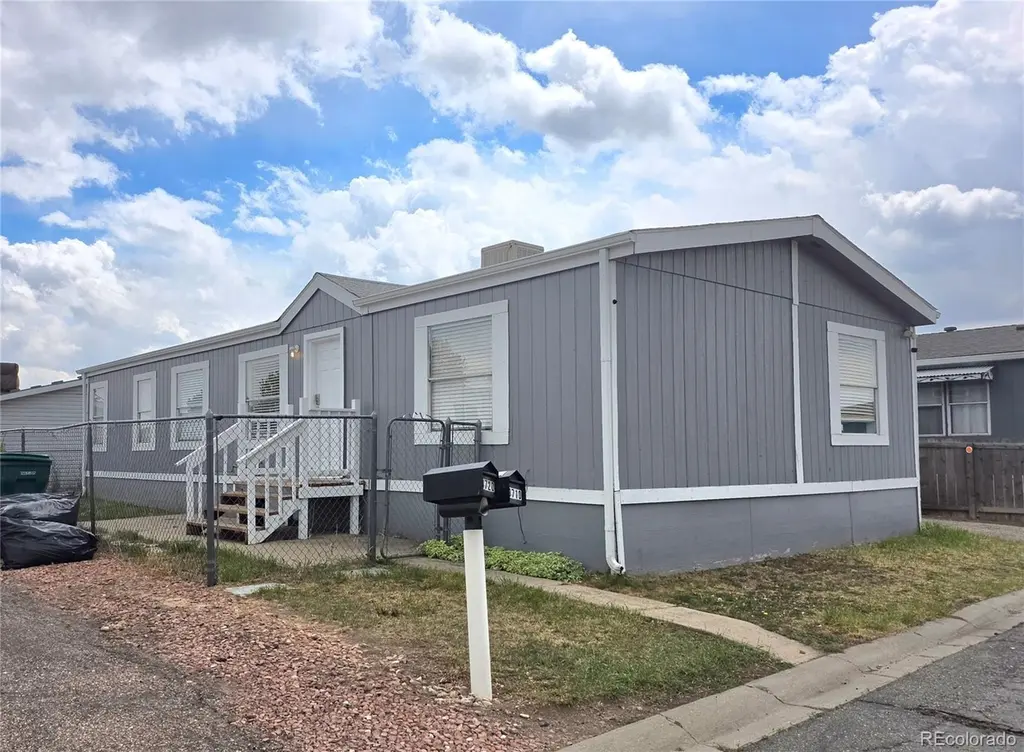
9710 Gull St · Federal Heights, CO
Flood risk 1/10 · Minimal
- FEMA flood zone
- X (unshaded)
- Chance of flooding over 30 yrs
- 0.0%
- Est. flood insurance / yr
- $507 – $1,088
Fire risk 1/10 · Minimal
- Est. fire insurance / yr
- $939 – $1,743
Heat risk 3/10 · Minor
- Hot days now (above 92°F)
- 7 days/yr
- Hot days in 30 yrs
- 18 days/yr
Wind risk 2/10 · Minimal
- Chance of severe wind over 30 yrs
- —
Air-quality risk 4/10 · Minor
- Unhealthy air days now
- 6 days/yr
- Unhealthy air days in 30 yrs
- 8 days/yr
Risk factors via First Street. Map © Google.
Why this score? — see what drove the D+ grade
The composite is a weighted blend of 9 inputs, each scored 0–100. Each bar is that input's sub-score; the figure is the points it added to the 100-point composite (weight × sub-score).
- ARV discount +11.2/15.0
- 1% rule +10.0/10.0
- Cash flow +8.6/30.0
- Condition / age +4.0/5.0
- Livability +3.8/5.0
- Schools +3.5/10.0
- Rent growth +2.7/5.0
- DSCR +2.4/10.0
- Appreciation +0.0/10.0
$78,000
🖨 Deal sheet (PDF) 📄 Offer letter ✓ Due diligence
Listing remarks
Welcome home to Denver Cascade, a desirable all-ages community offering fantastic amenities including a clubhouse and swimming pool, all conveniently located near public transportation, shopping, dining, and everyday essentials! This spacious 4-bedroom, 2-bath doublewide offers both comfort and functionality with 2–3 off-street parking spaces and a partially fenced yard, perfect for pets, outdoor entertaining, or simply enjoying added privacy. Step inside to an inviting open layout filled with abundant natural sunlight, soaring vaulted ceilings, and durable laminate flooring throughout. The home features a separate dining room with plenty of space for hosting family dinners and gathe
Key facts
- 1,000 sq ft lot
- 3 parking spots
- Community pool
Property features AI
Finance
- Other: Monthly lease amount listed as $1,260 (see listing for details)
- Financial info: Land lease in effect (monthly land lease $1,350) — lease through October 31, 2026
- HOA & community: Located in Denver Cascade park (professionally managed); Monthly lot/association fee: $1,350 (includes road maintenance and snow removal); Community amenities include clubhouse, playground, and pool; Pets allowed with size limits
Exterior
- Parking: 3 off-street parking spaces (total 3)
- Utilities: Public water; Public sewer
- Home design: Manufactured home located in a park; Single-story (main level living); Model: MH; Individual ownership
- Construction: Frame construction; Shingle roof; Wood skirting; Manufactured dimensions approximately 52' x 23'
- Exterior features: Private yard; Rain gutters; Partial fencing; Near public transit; Paved road access; Publicly maintained road
Interior
- Kitchen: Oven; Refrigerator; Dishwasher
- Bedrooms: 4 bedrooms (all on the main level)
- Flooring: Laminate flooring
- Bathrooms: 2 full bathrooms (both on the main level)
- Heating & cooling: Forced air heating; Evaporative cooling
- Interior features: Ceiling fans; No stairs (single-level); Pantry; Primary bedroom suite; Vaulted ceilings
- Laundry & utility: Washer; Dryer
Neighborhood map
What this means for you Summary
Snapshot
- This is a 4-bed/2.0-bath manufactured listed at $78k. Condition is rated good.
Deal economics
- At list price, monthly cash flow is $-67 ($-806/yr) — negative.
- To cash-flow at today's rent, offer at most $68k (12.5% below list).
- Meets the 1% rule at list price ($2k rent vs $78k).
- Recommended offer: $68k (12.5% below list) — sets the bar for cash-flow.
- Cap rate 5.3% vs local median 4.0% in Federal Heights — top-decile yield for the area; either an underpriced asset or a hidden risk that comps aren't pricing in. Stress-test before assuming the spread holds.
Location & tenants
- Location reads 76/100 on livability (#28 in CO, #3,380 nationally) — a middle-class / working-renter tenant base. Strengths: commute A+, cost of living A+, housing A+; Watch: health & safety D+, crime F.
- Adams 12 Five Star Schools (suburban): math 31% / reading 46% proficiency, ranked #26 of 86 in CO (top 30%) — families likely to look elsewhere, expect single-tenant / working-renter base with shorter leases.
- Zoned schools: Federal Heights Elementary School (math 2% / reading 8%, grade F, #958 of 966 statewide, top 100%, 414 students, 87% FRL); Northglenn Middle School (math 8% / reading 12%, grade F, #246 of 270 statewide, top 91%, 684 students, 85% FRL); Northglenn High School (math 16% / reading 38%, grade F, #257 of 381 statewide, top 68%, 1,959 students, 69% FRL) — zoned schools average 81% FRL vs 33% district-wide (47 pts higher); higher-poverty schools than district average — tighter screening recommended.
- Zoned-school proficiency averages 14% at this address vs 38% district-wide (-24 pts) — the specific schools serving this property underperform the Adams 12 Five Star Schools average; the district grade overstates school quality for this exact location.
- Market conditions: Rents flat; 135 active listings in the ZIP; 17 comparable units currently listed for rent nearby; rentals at typical pace (median 26d on market — plan ~3-4 weeks tenant-placement turnaround); 2,299 units permitted in Adams County in 2024 (343 in 5+ unit buildings).
- This rent runs 45% of the median local income ($62k/yr) — at the standard rent-burdened threshold; future hikes will face affordability resistance.
Forward outlook
- Local home prices are declining (-3.0%/yr); year-one equity from $539 of loan paydown is wiped out by about $2k of value loss. Plan a longer hold.
- Adams County population projected at +44% by 2050 — long-run rental-demand tailwind backs the buy-and-hold thesis.
Negotiation context
- Only 14 days on market — expect competitive offers; lowballing is unlikely to land.
Risks & watch-outs
- Watch-outs: HOA is 59% of rent.
Questions for the listing agent
- What do current leases actually rent for vs. the listed asking? Can we see a recent rent roll and the last 12 months of T-12 income?
- What does the HOA fee cover, when was the last increase, and are there any pending special assessments or reserve-fund shortfalls?
- Is there a deadline driving the sale (1031 exchange, divorce, estate, relocation)? That informs how much negotiation room exists.
- Schools are F-rated, which usually means shorter tenancies and higher turnover. Who's the typical renter profile here, and what's been the actual vacancy rate?
- Crime grade is F in this area — have there been break-ins, vandalism, or insurance claims at this property in the last 3 years? What carrier currently insures it and at what premium?
- The area grade is low — what's the realistic commute time and amenity access for the typical tenant pool here? Any planned neighborhood developments (good or bad) we should know about?
- What's the average days-on-market for RENTAL listings here right now (not sales)? A rising rental-DOM trend means longer vacancies and softer asking-rent achievability than the comps imply.
- What's the recent tenant-quality profile in this submarket — average credit score on applications, eviction rate, late-payment / NSF rate, and stable-employment percentage? A property-management company in the area should have these aggregated.
- How much new for-sale + rental construction is in the pipeline within 1–3 miles? Heavy new supply typically softens prices + rents 12–24 months out; constrained supply supports both.
Investment metrics
- 1% rule
- 2.96% ✓
- Cap rate
- 5.26%
- Cash-on-cash
- -3.69%
- DSCR
- 0.84
- GRM
- 2.8
CMA / ARV
- ARV (on-the-fly)
- $84,916
- Comps found
- 12
Show comp detail 12 sales within ~0.75 mi
| Address | Dist | Beds/Ba | Sqft | Sold | Price | $/sf | Match |
|---|---|---|---|---|---|---|---|
| 9595 Pecos St #203 | 0.60mi | 4/2.0 | 1,216 (+2%) | 2mo | $107,500 | $88 | 68 |
| 2635 Pheasant St | 0.25mi | 3/2.0 (-1) | 1,080 (-10%) | 1mo | $50,000 | $46 | 66 |
| 2940 Hawk St | 0.07mi | 3/2.0 (-1) | 1,056 (-12%) | 7mo | $75,000 | $71 | 66 |
| 9755 Elderberry St | 0.17mi | 3/2.0 (-1) | 1,344 (+12%) | 2mo | $85,000 | $63 | 65 |
| 2551 W 92nd | 0.54mi | 5/2.0 (+1) | 1,188 (-1%) | 7mo | $100,000 | $84 | 63 |
| 2551 W 92nd Ave | 0.54mi | 3/2.0 (-1) | 1,216 (+2%) | 7mo | $89,000 | $73 | 61 |
| 2551 W 92 Ave | 0.54mi | 3/2.0 (-1) | 1,232 (+3%) | 8mo | $115,000 | $93 | 58 |
| 2551 W 92nd Ave | 0.54mi | 3/2.0 (-1) | 1,120 (-6%) | 6mo | $55,000 | $49 | 54 |
| 1801 W 92nd Ave | 0.72mi | 3/2.0 (-1) | 1,152 (-4%) | 5mo | $132,000 | $115 | 51 |
| 1801 W 92nd Ave | 0.72mi | 3/2.0 (-1) | 1,248 (+4%) | 6mo | $76,000 | $61 | 49 |
| 1801 W 92nd Ave | 0.72mi | 3/2.0 (-1) | 1,056 (-12%) | 8mo | $54,000 | $51 | 35 |
| 1801 W 92nd Ave | 0.72mi | 3/2.0 (-1) | 1,344 (+12%) | 8mo | $93,000 | $69 | 35 |
Match score weights: distance 35% · size 25% · config 20% · recency 20%. Top-matched comps best support the ARV.
Projected returns pro-forma
-3.0% appreciation · 0.77% rent growth · sell at horizon
- IRR
- -31.4%
- Equity multiple
- 0.03×
- Total profit
- $-21,115
- Equity at exit
- $11,630
- IRR
- —
- Equity multiple
- -0.84×
- Total profit
- $-40,247
- Equity at exit
- $6,744
Cash invested: $21,840 (down + closing). Projections, not guarantees.
Landlord ↔ Tenant lean methodology
- Overall (STATE)
- 38 Tenant-Leaning
- State Colorado
- 38 Tenant-Leaning · D+4
- County
- — inherits STATE
- City
- — inherits STATE
ZIP-level market 80260
- Rents YoY
- 0.8%
- Active inventory
- 135
- Price-to-rent
- 2.8×
Monthly cashflow live
- Estimated rent
- $2,306 high interval (Pro) →
- Mortgage (P&I)
- −$409
- Tax est. 1.5%
- −$98 /mo · $1,170/yr
- Insurance
- −$32
- HOA
- −$1,350
- Vacancy / Maint / Mgmt
- −$484
- Net cashflow
- $-67
Break-even live
Sensitivity live
| Price | -10% $-13 | -5% $-40 | +0% $-67 | +5% $-94 | +10% $-121 |
|---|---|---|---|---|---|
| Rent | -10% $-249 | -5% $-158 | +0% $-67 | +5% $24 | +10% $115 |
| Rate | -1.0pp $-28 | -0.5pp $-47 | base $-67 | +0.5pp $-87 | +1.0pp $-108 |
UW: 25.0% down · 7.5% · 30yr · 1.5% tax · 5.0% vac · 8.0% maint · 8.0% mgmt
Financing live
Cash to close
- Down payment
- $19,500
- Closing costs
- $2,340
- Reserves months
- —
- Total cash needed
- —
Loan-product check · same deal, 3 products live
Conventional
25% down · 7.5% · 30yr
- Down + closing
- —
- Monthly P&I
- —
- Monthly cashflow
- —
- DSCR
- —
- Eligible?
- —
Personal DTI + credit; lowest rate.
DSCR
20% down · 8.5% · 30yr
- Down + closing
- —
- Monthly P&I
- —
- Monthly cashflow
- —
- DSCR
- —
- Eligible?
- —
No personal income docs; deal must DSCR.
Hard money
10% down · 12.0% · 12mo
- Down + closing
- —
- Monthly P&I
- —
- Monthly cashflow
- —
- DSCR
- —
- Eligible?
- —
Short-term bridge; refi at stabilization.
Rent comps 17 comps
| Address | Beds | Baths | Sqft | Rent | $/sqft | DOM | Units | Dist |
|---|---|---|---|---|---|---|---|---|
| 9400 Elm Ct #645 Denver, CO | 3.0 | 2.0 | 1184 | $2,203 | $1.86 | 26d | 1 | 0.49mi |
| 3323 W 96th Cir Westminster, CO | 1.0–3.0 | 1.0–3.0 | 1190 | $3,339 | $2.81 | 0d | 23 | 0.53mi |
| 10154 Wyandott Cir N Thornton, CO | 3.0 | 2.5 | 1464 | $2,465 | $1.68 | 18d | 1 | 0.65mi |
| 1801 W 92nd Ave #754 Denver, CO | 3.0 | 2.0 | 1123 | $1,995 | $1.78 | 7d | 1 | 0.70mi |
| 1921 W 101st Ave Unit 1921 Thornton, CO | 3.0 | 2.5 | 1335 | $2,800 | $2.10 | 17d | 1 | 0.72mi |
| 9783 Croke Dr Denver, CO | 3.0 | 1.5 | 1240 | $1,999 | $1.61 | 7d | 1 | 1.02mi |
| 9132 Osceola St Westminster, CO | 3.0 | 2.0 | 1204 | $2,350 | $1.95 | 26d | 1 | 1.15mi |
| 9130 Osceola St Westminster, CO | 3.0 | 2.0 | 1204 | $2,350 | $1.95 | 13d | 1 | 1.15mi |
| 9710 Huron St Unit B Northglenn, CO | 3.0 | 2.0 | 1292 | $2,080 | $1.61 | 20d | 1 | 1.31mi |
| 8670 Clay St Unit 4211 Westminster, CO | 3.0 | 2.0 | 1110 | $2,186 | $1.97 | 26d | 1 | 1.33mi |
| 8670 Clay St Unit 5201 Westminster, CO | 3.0 | 2.0 | 1110 | $2,550 | $2.30 | 26d | 1 | 1.33mi |
| 8670 Clay St Unit 6301 Westminster, CO | 3.0 | 2.0 | 1110 | $2,325 | $2.09 | 26d | 1 | 1.33mi |
| 8670 Clay St Unit 7219 Westminster, CO | 3.0 | 2.0 | 1110 | $2,373 | $2.14 | 26d | 1 | 1.34mi |
| 747 W 96th Ave Denver, CO | 3.0 | 1.0 | 864 | $1,395 | $1.61 | 7d | 1 | 1.35mi |
| 747 W 96th Ave Denver, CO | 3.0 | 1.0 | 864 | $1,395 | $1.61 | 26d | 1 | 1.35mi |
| 707 W 96th Ave Thornton, CO | 3.0 | 1.0 | 859 | $1,350 | $1.57 | 26d | 1 | 1.37mi |
| 9189 Gale Blvd Thornton, CO | 1.0–3.0 | 1.0–2.0 | 755 | $1,699 | $2.25 | 26d | 1 | 1.41mi |
HOA detail
- Monthly dues
- $1,350 · $16,200/yr
- Likely covers
- pool
Listing history 11 events
-
2026-06-22status $78,000 Pending Accepting Backup Offers 14 DOM
-
2026-06-21days on market $78,000 Active 14 DOM
-
2026-06-18days on market $78,000 Active 11 DOM
-
2026-06-17days on market $78,000 Active 10 DOM
-
2026-06-16days on market $78,000 Active 9 DOM
-
2026-06-15days on market $78,000 Active 8 DOM
-
2026-06-13days on market $78,000 Active 6 DOM
-
2026-06-13statusdays on market $78,000 Active 5 DOM
-
2026-05-04status Pending Accepting Backup Offers
-
2026-04-30$78,000 Active
-
2026-04-29historical $78,000
ⓘ Source: listings_history table (triggers on properties + properties_extension) + one-shot
backfill from property_details.listing_events for pre-trigger history.
Climate risk First Street
- Flood 1/10 Low FEMA zone X (unshaded) · 0% chance over 30 yrs
- Wildfire 1/10 Low
- Heat 3/10 Moderate 7 d/yr ≥92°F today · 18 d/yr by 30 yrs out
- Wind 2/10 Low
- Air quality 4/10 Moderate 6 unhealthy d/yr today · 8 by 30 yrs out
Nearby sold comps map
Loading sold comps map…
Walkable amenities ~0.75 mi
Loading nearby amenities…
Taxation est. · year 1
- Rental income
- $27,674
- − Mortgage interest
- −$4,369
- − Property taxes
- −$1,170
- − Insurance
- −$390
- − Repairs & maintenance
- −$2,214
- − Management
- −$2,214
- − HOA
- −$16,200
- − Depreciation
- −$2,269
- Taxable loss
- −$1,152
- Est. tax savings @ 24.0%
- +$277
- After-tax cash flow
- $-530/yr
For passive investors: Depreciation is non-cash, so a rental often shows a tax loss while cash-flowing — sheltering income. Rental losses are passive: they offset passive income freely, and up to $25,000/yr can offset ordinary (W-2) income if you actively participate and your MAGI is under $100k (phasing out to $0 by $150k); unused losses carry forward. On sale, claimed depreciation is recaptured at up to 25%, and gains may owe capital-gains tax (a 1031 exchange can defer both). Figures are a year-1 estimate at your 24.0% rate — not tax advice; consult a CPA.
Condition & rehab AI · 12 photos
This home is in good condition with a good condition score of 80. It is move-in ready with a cosmetic rehab level. The highest-ROI updates would be painting the exterior and interior walls, landscaping improvements, new flooring in bathrooms, and new kitchen appliances.
Value-add opportunities
- Both Painting exterior and interior walls — Enhances curb appeal and interior aesthetics
- Both Landscaping improvements — Enhances curb appeal and adds value
- Both New flooring in bathrooms — Improves aesthetics and functionality
- Both New kitchen appliances — Modernizes the space and adds value
Renovation cost estimate screening
Value-add ROI direction
- Both Painting exterior and interior walls — Enhances curb appeal and interior aesthetics ↑
- Both Landscaping improvements — Enhances curb appeal and adds value ↑
- Both New flooring in bathrooms — Improves aesthetics and functionality ↑
- Both New kitchen appliances — Modernizes the space and adds value ↑
ⓘ Cost ranges are severity-bucket heuristics (US national rule-of-thumb). Get contractor quotes + a written scope before underwriting a rehab budget.
Schools (NCES district)
- District
- Adams 12 Five Star Schools
- NCES district ID
- 0806900
- Math proficiency
- 31% ▼ -4.00%
- Reading proficiency
- 46% ▬ 0.00%
- Median HH income
- $67,478
- Composite
- 34.87/100
- National rank
- #5086
- State rank
- #26 of 86 in CO
Livability — Federal Heights
- Score
- 76/100
- State rank
- #28
- US rank
- #3380
Category grades
Schools grade is shown separately in the Schools card above.
Census & demographics
- Census place
- Federal Heights, CO
- County
- Adams County · 464,133 people
- City population
- 34,677
- Metro
- Denver-Aurora-Lakewood, CO
- Population (ZIP)
- 34,677
- Household income
- $61,852
- Rent vs Own
- Severe rent burden
- 1521.0
Population outlook (Adams County) Hauer SSP2
- Today (2025)
- 598,184 people
- By 2030
- 651,880 · +9.0%
- By 2040
- 759,778 · +27.0%
- By 2050
- 862,889 · +44.3%
- By 2075
- 1,085,994 · +81.5%
- By 2100
- 1,211,318 · +102.5%
Race, ethnicity, and origin ACS 2023
- Neighborhood character
- Majority Hispanic (61%)
- Race & ethnicity
- Hispanic / Latino 61% White 30% Two or more races 26% Asian 3% Black 3%
- Hispanic origin (detail)
- Mexican 51%
- Common ancestry
- Romanian 1% Slovak 1% Italian 1%
- Foreign-born
- 25% · Canada, Vietnam, China
- Languages at home
- 53% English-only · Spanish 42% Other Asian/Pacific 2% Other Indo-European 1%
Political lean MEDSL · Adams
- 2024 margin
- Lean D (+9.0) · D 53.2% · R 44.1% · Other 2.7%
- 2008→2024 swing
- -9.3pp toward R · 2008: 18.4pp · 2024: 9.0pp
- All cycles
- 2024: D+9.0 2020: D+16.3 2016: D+7.2 2012: D+15.1 2008: D+18.4
Not yet ingested
- Civics
- —
Market trends
- HPI YoY
- ▼ -260.84%
- Current HPI
- 285.4552
- Rent YoY
- ▲ 0.77%
- Metro
- Denver-Aurora-Lakewood, CO
- State GDP YoY
- ▲ 1.95%
- F500 in state
- 14
Industry mix (Fortune 500 HQ in CO)
| Industry | F500 HQs | Revenue |
|---|---|---|
| Technology Distribution | 1 | $31B |
|
||
| Food / Agriculture | 1 | $18B |
|
||
| Packaging | 1 | $14B |
|
||
| Healthcare | 1 | $13B |
|
||
| Energy | 1 | $10B |
|
||
| Technology | 1 | $4B |
|
||
Price history
+0.0% since first listed3 events — show timeline
- 2026-05-04 Pending — REColorado as Distributed by MLS Grid
- 2026-04-30 Listed $78,000 REColorado as Distributed by MLS Grid
- 2026-04-29 Coming Soon $78,000 REColorado as Distributed by MLS Grid
Cash-flow waterfall
monthlySold comps — $/sqft
last 12 mo · ≤1 miLoading sold comps…