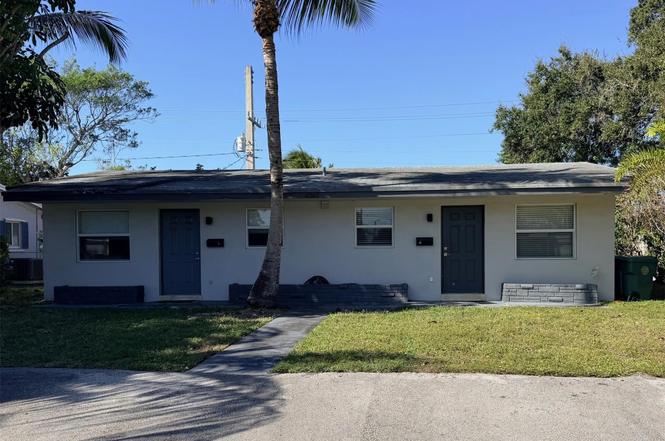
 Duplex
4385 NE 13th Ave · Oakland Park, FL
Flood risk 4/10 · Minor
- FEMA flood zone
- X (shaded)
- Chance of flooding over 30 yrs
- 0.22%
- Est. flood insurance / yr
- $507 – $1,088
Fire risk 1/10 · Minimal
- Est. fire insurance / yr
- $947 – $1,759
Heat risk 10/10 · Severe
- Hot days now (above 105°F)
- 7 days/yr
- Hot days in 30 yrs
- 26 days/yr
Wind risk 10/10 · Severe
- Chance of severe wind over 30 yrs
- 99.0%
Air-quality risk 2/10 · Minimal
- Unhealthy air days now
- 1 days/yr
- Unhealthy air days in 30 yrs
- 2 days/yr
Risk factors via First Street. Map © Google.
Why this score? — see what drove the C grade
The composite is a weighted blend of 9 inputs, each scored 0–100. Each bar is that input's sub-score; the figure is the points it added to the 100-point composite (weight × sub-score).
- Cash flow +23.3/30.0
- DSCR +7.5/10.0
- ARV discount +7.5/15.0
- 1% rule +6.3/10.0
- Schools +4.1/10.0
- Livability +3.9/5.0
- Rent growth +3.0/5.0
- Condition / age +2.5/5.0
- Appreciation +0.0/10.0
$449,000
🖨 Deal sheet 📄 Offer letter ✓ Due diligence
Multi-family units
County records classify this as Multi-Family (2-4 Unit). Listing-text estimate: 2 units. confirmed
Listing remarks
Strong income opportunity in Coral Heights. This duplex features two 1 bed/1 bath units. One unit was updated in 2020 with new appliances, countertops, flooring, A/C units, and in unit laundry. The second unit is ready for renovation to maximize rental potential. Property includes impact windows and doors, four front parking spaces, and spacious backyards with paver patios. Pipes redone in 2025. Excellent location east of Dixie Highway, close to Oakland Park’s Culinary Arts District, Federal Highway shopping and dining, and just ten minutes from the beach. Cash only.
Key facts
- Updated appliances
- Paver patios
- Excellent location
Tags
Property features AI
Finance
- Financial info: Two total units
- HOA & community: Association covers grounds maintenance, sewer, trash and water
Exterior
- Utilities: Public water; Public sewer; Cable available
- Home design: Duplex; Single-story; Resale property
- Construction: CBS construction; Composition/shingle roof
- Exterior features: Patio
Interior
- Flooring: Tile flooring; Vinyl flooring
- Heating & cooling: Window/wall heating; Ceiling fans; Wall/window air conditioning units
- Interior features: Blinds on windows
Neighborhood map
What this means for you Summary
Snapshot
- This is a 2 × 1-bed/?-bath units multifamily listed at $449k.
Deal economics
- At list price, monthly cash flow is $821 ($10k/yr) — positive. Per door: $411/mo.
- The deal already cash-flows at list — no discount required.
- Meets the 1% rule at list price ($5k rent vs $449k).
- Recommended offer: $409k (9.0% below list) — sets the bar for market timing.
- Cap rate 8.5% vs local median 3.8% in Oakland Park — top-decile yield for the area; either an underpriced asset or a hidden risk that comps aren't pricing in. Stress-test before assuming the spread holds.
Location & tenants
- Location reads 77/100 on livability (#193 in FL, #3,082 nationally) — a middle-class / working-renter tenant base. Strengths: commute A+, housing A+, health & safety A+; Watch: schools D, amenities F.
- Broward (suburban): math 42% / reading 53% proficiency, ranked #46 of 73 in FL (top 63%) — families likely to look elsewhere, expect single-tenant / working-renter base with shorter leases.
- Market conditions: Rents rising (+2.0%/yr); 355 active listings in the ZIP; 14 comparable units currently listed for rent nearby; rentals at typical pace (median 20d on market — plan ~3-4 weeks tenant-placement turnaround); solid renter incomes; 2,111 units permitted in Broward County in 2024 (1,265 in 5+ unit buildings).
- At $5,059/mo this rent would consume 81% of the median local household income ($75k/yr) (locally 1755% of renters already pay >50% of income on rent) — very limited rent-growth headroom before tenants either downsize or default.
Forward outlook
- Local home prices are declining (-3.0%/yr); year-one equity from $3k of loan paydown is wiped out by about $13k of value loss. Plan a longer hold.
- Broward County population projected at +34% by 2050 — long-run rental-demand tailwind backs the buy-and-hold thesis.
Negotiation context
- It's been on market 99 days — a 9% lower offer ($409k) is reasonable based on typical stale-listing flexibility.
- Current owner paid $165k; list at $449k implies a 172% gain — meaningful room to come down on a strong offer.
Risks & watch-outs
- Climate carrying-cost: severe wind risk, 99% chance of damaging wind over 30y; extreme-heat days projected 7→26/yr by 2055 (HVAC capex compounding) — expect insurance premiums to compound above CPI over the hold.
Questions for the listing agent
- It's been on market 99 days. Have you received any prior offers? Is the seller open to a 9% concession, seller financing, or rate buy-down credit?
- Can we see the unit-by-unit rent roll, current vacancy, and any below-market leases? What's the average tenancy length?
- What capital expenditures (roof, boiler, parking lot, exteriors) have been made in the last 5 years, and what's planned in the next 2?
- Built in 1964 — when were the roof, HVAC, electrical panel, plumbing, and water heater last replaced?
- Why hasn't it sold? Are there any deal-killer items the seller is aware of (foundation, flood, title, zoning, code violations)?
- Is there a deadline driving the sale (1031 exchange, divorce, estate, relocation)? That informs how much negotiation room exists.
- Schools are D-rated, which usually means shorter tenancies and higher turnover. Who's the typical renter profile here, and what's been the actual vacancy rate?
- What's the average days-on-market for RENTAL listings here right now (not sales)? A rising rental-DOM trend means longer vacancies and softer asking-rent achievability than the comps imply.
- What's the recent tenant-quality profile in this submarket — average credit score on applications, eviction rate, late-payment / NSF rate, and stable-employment percentage? A property-management company in the area should have these aggregated.
- How much new apartment / multifamily construction is in the pipeline within 1–3 miles? Heavy new supply (>2% of stock underway) typically softens rents 12–24 months out; light construction supports rent growth.
Investment metrics
- 1% rule
- 1.13% ✓
- Cap rate
- 8.49%
- Cash-on-cash
- 7.84%
- DSCR
- 1.35
- GRM
- 7.4
CMA / ARV
No comps found within radius.
Projected returns pro-forma
-3.0% appreciation · 2.01% rent growth · sell at horizon
- IRR
- -5.5%
- Equity multiple
- 0.80×
- Total profit
- $-25,311
- Equity at exit
- $66,947
- IRR
- 3.0%
- Equity multiple
- 1.20×
- Total profit
- $25,742
- Equity at exit
- $38,821
Cash invested: $125,720 (down + closing). Projections, not guarantees.
Landlord ↔ Tenant lean methodology
- Overall (STATE)
- 87 Strongly Landlord-Friendly
- State Florida
- 87 Strongly Landlord-Friendly · R+3
- County
- — inherits STATE
- City
- — inherits STATE
ZIP-level market 33334
- Home prices YoY
- -34.6%
- Rents YoY
- 2.0%
- Active inventory
- 355
- Price-to-rent
- 14.8×
Monthly cashflow live
- Estimated rent
- $5,059 medium interval (Pro) →
- Mortgage (P&I)
- −$2,355
- Tax from tax record
- −$634 /mo · $7,602/yr
- Insurance
- −$187
- HOA
- −$0
- Vacancy / Maint / Mgmt
- −$1,062
- Net cashflow
- $821
Break-even live
2-unit breakdown (identical units grouped — click to expand)
| Units | Beds | Baths | Est. rent |
|---|---|---|---|
| 2× units | 1 | — | $5,060 |
| #1 | 1 | — | $2,530 |
| #2 | 1 | — | $2,530 |
| Total (2 units) | $5,059 | ||
UW: 25.0% down · 7.5% · 30yr · 1.5% tax · 5.0% vac · 8.0% maint · 8.0% mgmt
Financing live
Cash to close
- Down payment
- $112,250
- Closing costs
- $13,470
- Reserves months
- —
- Total cash needed
- —
Loan-product check · same deal, 3 products live
Conventional
25% down · 7.5% · 30yr
- Down + closing
- —
- Monthly P&I
- —
- Monthly cashflow
- —
- DSCR
- —
- Eligible?
- —
Personal DTI + credit; lowest rate.
DSCR
20% down · 8.5% · 30yr
- Down + closing
- —
- Monthly P&I
- —
- Monthly cashflow
- —
- DSCR
- —
- Eligible?
- —
No personal income docs; deal must DSCR.
Hard money
10% down · 12.0% · 12mo
- Down + closing
- —
- Monthly P&I
- —
- Monthly cashflow
- —
- DSCR
- —
- Eligible?
- —
Short-term bridge; refi at stabilization.
Rent comps 14 comps
| Address | Beds | Baths | Sqft | Rent | $/sqft | DOM | Units | Dist |
|---|---|---|---|---|---|---|---|---|
| 4511 NE 13th Ave Oakland Park, FL | 2.0 | 2.0 | 1400 | $3,200 | $2.29 | 7d | 1 | 0.18mi |
| 1421 NE 41st St Oakland Park, FL | 2.0 | 2.0 | 1366 | $4,000 | $2.93 | 24d | 1 | 0.19mi |
| 3781 NE 13th Ave Oakland Park, FL | 2.0 | 1.0 | 869 | $3,900 | $4.49 | 24d | 1 | 0.49mi |
| 3801 Dixie Hwy Oakland Park, FL | 2.0 | 1.0–2.0 | 944 | $2,894 | $3.07 | 14d | 45 | 0.49mi |
| 351 NE 41st St Oakland Park, FL | 2.0 | 1.0 | 900 | $3,400 | $3.78 | 24d | 1 | 0.75mi |
| 1680 NE 34th Ln Unit B Oakland Park, FL | 2.0 | 2.0 | 1084 | $3,100 | $2.86 | 19d | 1 | 0.88mi |
| 4804 NE 21st Ave #4804 Fort Lauderdale, FL | 2.0 | 2.0 | 1400 | $4,500 | $3.21 | 24d | 1 | 0.98mi |
| 3411 N Federal Hwy Fort Lauderdale, FL | 2.0 | 1.0–2.0 | 754 | $2,885 | $3.83 | 2d | 59 | 0.99mi |
| 3333 N Federal Hwy Fort Lauderdale, FL | 2.0 | 1.0–2.0 | 736 | $2,677 | $3.63 | 2d | 13 | 1.15mi |
| 3000 NE 6th Ave Wilton Manors, FL | 2.0 | 1.0–2.0 | 921 | $2,805 | $3.05 | 3d | 20 | 1.22mi |
| 2816 NE 9th Ter Wilton Manors, FL | 2.0 | 1.0 | 1146 | $3,800 | $3.32 | 24d | 1 | 1.28mi |
| 2741 NE 16th Ave Wilton Manors, FL | 2.0 | 2.0 | 1400 | $3,500 | $2.50 | 24d | 1 | 1.30mi |
| 331 NW 38th St Oakland Park, FL | 2.0 | 1.5 | 1040 | $3,900 | $3.75 | 7d | 1 | 1.33mi |
| 331 NW 38th St Oakland Park, FL | 2.0 | 1.5 | 1040 | $3,900 | $3.75 | 16d | 1 | 1.33mi |
Listing history 17 events
-
2026-06-18days on market $449,000 Active 99 DOM
-
2026-06-17days on market $449,000 Active 98 DOM
-
2026-06-16days on market $449,000 Active 97 DOM
-
2026-06-15days on market $449,000 Active 96 DOM
-
2026-06-13days on market $449,000 Active 94 DOM
-
2026-06-09days on market $449,000 Active 90 DOM
-
2026-06-07days on market $449,000 Active 88 DOM
-
2026-06-04days on market $449,000 Active 85 DOM
-
2026-06-03days on market $449,000 Active 84 DOM
-
2026-06-02days on market $449,000 Active 83 DOM
-
2026-06-01days on market $449,000 Active 82 DOM
-
2026-05-31days on market $449,000 Active 81 DOM
-
2026-04-27price $475,000
-
2026-01-28$499,000 Active
-
2003-08-27soldstatus $165,000
-
2000-09-29soldstatus $95,000
-
1995-10-20soldstatus $80,000
ⓘ Source: listings_history table (triggers on properties + properties_extension) + one-shot
backfill from property_details.listing_events for pre-trigger history.
Tax reassessment forecast FL · Resets to sale price
- Current annual tax
- $7,602 · $634/mo
- Projected year-2 tax
- $7,602 · $634/mo
- Expected delta
- $0/yr ($0/mo · 0.0%)
ⓘ Screening estimate from a state-policy table — verify with the county assessor before closing.
Climate risk First Street
- Flood 4/10 Moderate FEMA zone X (shaded) · 22% chance over 30 yrs
- Wildfire 1/10 Low
- Heat 10/10 Extreme 7 d/yr ≥105°F today · 26 d/yr by 30 yrs out
- Wind 10/10 Extreme 99% chance of damaging wind over 30 yrs
- Air quality 2/10 Low 1 unhealthy d/yr today · 2 by 30 yrs out
Nearby sold comps map
Loading sold comps map…
Walkable amenities ~0.75 mi
Loading nearby amenities…
Taxation est. · year 1
- Rental income
- $60,708
- − Mortgage interest
- −$25,151
- − Property taxes
- −$7,602
- − Insurance
- −$2,245
- − Repairs & maintenance
- −$4,857
- − Management
- −$4,857
- − Depreciation
- −$13,062
- Taxable income
- $2,935
- Est. tax owed @ 24.0%
- −$704
- After-tax cash flow
- $9,153/yr
For passive investors: Depreciation is non-cash, so a rental often shows a tax loss while cash-flowing — sheltering income. Rental losses are passive: they offset passive income freely, and up to $25,000/yr can offset ordinary (W-2) income if you actively participate and your MAGI is under $100k (phasing out to $0 by $150k); unused losses carry forward. On sale, claimed depreciation is recaptured at up to 25%, and gains may owe capital-gains tax (a 1031 exchange can defer both). Figures are a year-1 estimate at your 24.0% rate — not tax advice; consult a CPA.
Schools (NCES district)
- District
- Broward
- NCES district ID
- 1200180
- Math proficiency
- 42% ▼ -18.00%
- Reading proficiency
- 53% ▼ -5.00%
- Median HH income
- $52,139
- Composite
- 40.88/100
- National rank
- #3621
- State rank
- #46 of 73 in FL
Livability — Oakland Park
- Score
- 77/100
- State rank
- #193
- US rank
- #3082
Category grades
Schools grade is shown separately in the Schools card above.
Census & demographics
- Census place
- Oakland Park, FL
- County
- Broward County · 1,963,430 people
- City population
- 68,410
- Metro
- Miami-Fort Lauderdale-Pompano Beach, FL
- Population (ZIP)
- 30,935
- Household income
- $75,361
- Rent vs Own
- Severe rent burden
- 1755.0
Population outlook (Broward County) Hauer SSP2
- Today (2025)
- 2,207,033 people
- By 2030
- 2,360,704 · +7.0%
- By 2040
- 2,661,208 · +20.6%
- By 2050
- 2,946,698 · +33.5%
- By 2075
- 3,602,273 · +63.2%
- By 2100
- 3,970,984 · +79.9%
Race, ethnicity, and origin ACS 2023
- Neighborhood character
- Diverse neighborhood (Simpson 0.68)
- Race & ethnicity
- White 43% Hispanic / Latino 32% Two or more races 25% Black 17% Asian 2%
- Hispanic origin (detail)
- Mexican 2% Puerto Rican 4% Cuban 4%
- Common ancestry
- Hispanic 5% Lithuanian 3% Romanian 2%
- Foreign-born
- 31% · Canada, Jamaica, Vietnam
- Languages at home
- 59% English-only · Spanish 28% Other Indo-European 5% French/Haitian/Cajun 5%
Political lean MEDSL · Broward
- 2024 margin
- D (+17.0) · D 58.0% · R 41.0%
- 2008→2024 swing
- -17.8pp toward R · 2008: 34.7pp · 2024: 17.0pp
- All cycles
- 2024: D+17.0 2020: D+29.8 2016: D+35.0 2012: D+34.9 2008: D+34.7
Not yet ingested
- Civics
- —
Market trends
- HPI YoY
- ▼ -208.58%
- Current HPI
- 394.9526
- Rent YoY
- ▲ 2.01%
- Metro
- Miami-Fort Lauderdale-Pompano Beach, FL
- State GDP YoY
- ▲ 3.28%
- F500 in state
- 36
Industry mix (Fortune 500 HQ in FL)
| Industry | F500 HQs | Revenue |
|---|---|---|
| Industrial Technology | 2 | $29B |
|
||
| Insurance | 2 | $17B |
|
||
| Retail | 1 | $60B |
|
||
| Technology Distribution | 1 | $58B |
|
||
| Homebuilding | 1 | $35B |
|
||
| Technology Manufacturing | 1 | $35B |
|
||
Price history
+493.8% since first listed5 events — show timeline
- 2026-04-27 Price Changed $475,000 Beaches MLS
- 2026-01-28 Listed $499,000 Beaches MLS
- 2003-08-27 Sold (Public Records) $165,000 Public Records
- 2000-09-29 Sold (Public Records) $95,000 Public Records
- 1995-10-20 Sold (Public Records) $80,000 Public Records
Property tax history
+8.8%/yrLatest (2025): $7,602 · +5.6% YoY. Source: county tax records.
Cash-flow waterfall
monthlySold comps — $/sqft
last 12 mo · ≤1 miLoading sold comps…