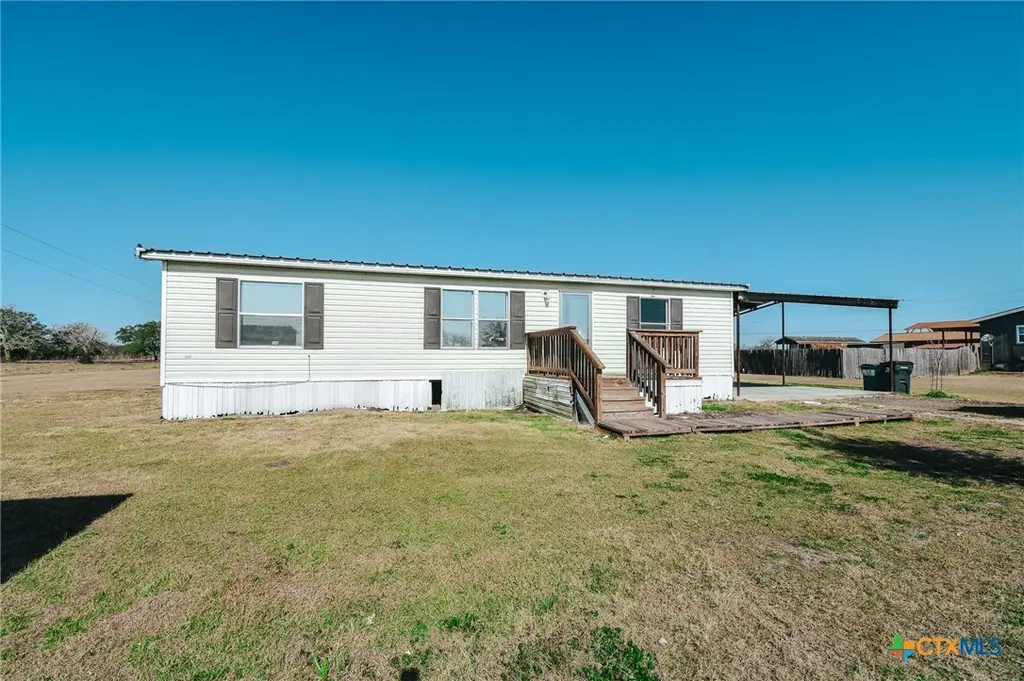
413 West Oaks Dr · Quail Creek, TX
Flood risk 7/10 · Major
- FEMA flood zone
- X
- Chance of flooding over 30 yrs
- 0.99%
- Est. flood insurance / yr
- $507 – $1,088
Fire risk 5/10 · Moderate
- Est. fire insurance / yr
- $1,222 – $2,270
Heat risk 9/10 · Severe
- Hot days now (above 111°F)
- 7 days/yr
- Hot days in 30 yrs
- 22 days/yr
Wind risk 9/10 · Severe
- Chance of severe wind over 30 yrs
- 99.0%
Air-quality risk 1/10 · Minimal
- Unhealthy air days now
- 0 days/yr
- Unhealthy air days in 30 yrs
- 0 days/yr
Risk factors via First Street. Map © Google.
Why this score? — see what drove the C- grade
The composite is a weighted blend of 9 inputs, each scored 0–100. Each bar is that input's sub-score; the figure is the points it added to the 100-point composite (weight × sub-score).
- Cash flow +21.1/30.0
- ARV discount +7.5/15.0
- DSCR +6.7/10.0
- 1% rule +5.7/10.0
- Livability +3.4/5.0
- Rent growth +2.5/5.0
- Schools +2.5/10.0
- Condition / age +2.5/5.0
- Appreciation +0.0/10.0
$144,500
🖨 Deal sheet 📄 Offer letter ✓ Due diligence
Listing remarks
Welcome to 413 West Oaks, a 3 bedroom, 2 bath manufactured home offering 1,144 square feet of living space on a spacious 1.75-acre lot. Built in 2017, this property provides newer construction and a functional layout, making it a strong opportunity for an investor or buyer. The living room flows into the kitchen, creating an open and practical living area, and the bedrooms are generously sized. The property includes a covered carport for convenient parking and additional utility. While the home does need some work, the combination of acreage, newer build year, and layout offers potential for renovation or investment. With plenty of space and room to improve, this property is ready for its n
Key facts
- 1.75 acre lot
- 3 parking spots
- Built 2017
Property features AI
Exterior
- Parking: Attached carport; Carport with 3 spaces
- Security: Smoke detectors
- Utilities: Electricity available; Water: private well; Sewer: aerobic septic and public sewer (not connected at lot)
- Home design: Double-wide mobile home; Single-story; Pillar/post/pier foundation; Metal roof; HardiPlank-type exterior; Resale condition
- Construction: Built (year source: assessor)
- Exterior features: No additional exterior features listed; Asphalt road access; Property located outside city limits; Lot between one and three acres
Interior
- Kitchen: Dishwasher; Electric range; Range; Vented exhaust fan; Pantry
- Bedrooms: Split bedrooms (bedrooms separated by living space)
- Flooring: Carpet; Vinyl
- Bathrooms: 2 full bathrooms
- Heating & cooling: Central heating (electric); Central air conditioning (electric, one unit)
- Interior features: Ceiling fans; Open floor plan; Split-bedroom layout; Tub with shower; Kitchen and family room combined; Kitchen and dining area combined; Pantry
- Laundry & utility: Washer hookup; Electric dryer hookup; Indoor laundry room; Electric water heater; Water heater
Neighborhood map
What this means for you Summary
Snapshot
- This is a 3-bed/2.0-bath manufactured listed at $144k.
Deal economics
- At list price, monthly cash flow is $141 ($2k/yr) — positive.
- The deal already cash-flows at list — no discount required.
- Meets the 1% rule at list price ($2k rent vs $144k).
- Recommended offer: $142k (1.5% below list) — sets the bar for market timing.
- Cap rate 8.0% vs local median 2.1% in Quail Creek — top-decile yield for the area; either an underpriced asset or a hidden risk that comps aren't pricing in. Stress-test before assuming the spread holds.
Location & tenants
- Location reads 68/100 on livability (#476 in TX) — a middle-class / working-renter tenant base. Strengths: crime A+, cost of living A+, housing A+; Watch: health & safety C-, schools D-, amenities F.
- Victoria ISD (urban): math 24% / reading 33% proficiency, ranked #645 of 826 in TX (top 78%) — low school quality limits family demand, transient renter base, plan for 1-2y turnover.
- Market conditions: 147 active listings in the ZIP; 43 units permitted in Victoria County in 2024 (0 in 5+ unit buildings).
Forward outlook
- Local home prices are declining (-3.0%/yr); year-one equity from $999 of loan paydown is wiped out by about $4k of value loss. Plan a longer hold.
- Victoria County population projected at +34% by 2050 — long-run rental-demand tailwind backs the buy-and-hold thesis.
Negotiation context
- It's been on market 24 days — a 2% lower offer ($142k) is reasonable based on typical stale-listing flexibility.
- 12 sale attempts since 14y ago with the ask held roughly flat each time — persistent listings suggest the price (not the market) is what's stuck; bring a comps-based counter.
- Current owner paid $16k; list at $144k implies a 803% gain — meaningful room to come down on a strong offer.
Risks & watch-outs
- Watch-outs: flood insurance adds $66/mo.
- Climate carrying-cost: major flood risk; severe wind risk, 99% chance of damaging wind over 30y; moderate wildfire risk; extreme-heat days projected 7→22/yr by 2055 (HVAC capex compounding) — expect insurance premiums to compound above CPI over the hold.
Questions for the listing agent
- What's the actual annual flood-insurance premium (NFIP or private), and is the property in a SFHA with mandatory coverage?
- Is there a deadline driving the sale (1031 exchange, divorce, estate, relocation)? That informs how much negotiation room exists.
- Schools are D-rated, which usually means shorter tenancies and higher turnover. Who's the typical renter profile here, and what's been the actual vacancy rate?
- What's the average days-on-market for RENTAL listings here right now (not sales)? A rising rental-DOM trend means longer vacancies and softer asking-rent achievability than the comps imply.
- What's the recent tenant-quality profile in this submarket — average credit score on applications, eviction rate, late-payment / NSF rate, and stable-employment percentage? A property-management company in the area should have these aggregated.
- How much new for-sale + rental construction is in the pipeline within 1–3 miles? Heavy new supply typically softens prices + rents 12–24 months out; constrained supply supports both.
Investment metrics
- 1% rule
- 1.07% ✓
- Cap rate
- 8.02%
- Cash-on-cash
- 6.15%
- DSCR
- 1.27
- GRM
- 7.8
CMA / ARV
No comps found within radius.
Projected returns pro-forma
-3.0% appreciation · 3.0% rent growth · sell at horizon
- IRR
- -9.7%
- Equity multiple
- 0.64×
- Total profit
- $-14,365
- Equity at exit
- $21,545
- IRR
- -0.2%
- Equity multiple
- 0.98×
- Total profit
- $-649
- Equity at exit
- $12,494
Cash invested: $40,460 (down + closing). Projections, not guarantees.
Landlord ↔ Tenant lean methodology
- Overall (STATE)
- 87 Strongly Landlord-Friendly
- State Texas
- 87 Strongly Landlord-Friendly · R+5
- County
- — inherits STATE
- City
- — inherits STATE
ZIP-level market 77905
- Home prices YoY
- -33.0%
- Active inventory
- 147
- Price-to-rent
- 7.8×
Monthly cashflow live
- Estimated rent
- $1,548 medium interval (Pro) →
- Mortgage (P&I)
- −$758
- Tax from tax record
- −$198 /mo · $2,370/yr
- Insurance
- −$60
- Flood insurance flood zone
- −$66 /mo · $798/yr
- HOA
- −$0
- Vacancy / Maint / Mgmt
- −$325
- Net cashflow
- $141
Break-even live
UW: 25.0% down · 7.5% · 30yr · 1.5% tax · 5.0% vac · 8.0% maint · 8.0% mgmt
Financing live
Cash to close
- Down payment
- $36,125
- Closing costs
- $4,335
- Reserves months
- —
- Total cash needed
- —
Loan-product check · same deal, 3 products live
Conventional
25% down · 7.5% · 30yr
- Down + closing
- —
- Monthly P&I
- —
- Monthly cashflow
- —
- DSCR
- —
- Eligible?
- —
Personal DTI + credit; lowest rate.
DSCR
20% down · 8.5% · 30yr
- Down + closing
- —
- Monthly P&I
- —
- Monthly cashflow
- —
- DSCR
- —
- Eligible?
- —
No personal income docs; deal must DSCR.
Hard money
10% down · 12.0% · 12mo
- Down + closing
- —
- Monthly P&I
- —
- Monthly cashflow
- —
- DSCR
- —
- Eligible?
- —
Short-term bridge; refi at stabilization.
Listing history 50 events
-
2026-06-19days on market $144,500 Active 24 DOM
-
2026-06-18days on market $144,500 Active 23 DOM
-
2026-06-17days on market $144,500 Active 22 DOM
-
2026-06-16days on market $144,500 Active 21 DOM
-
2026-06-15days on market $144,500 Active 20 DOM
-
2026-06-14days on market $144,500 Active 18 DOM
-
2026-06-13days on market $144,500 Active 17 DOM
-
2026-06-10days on market $144,500 Active 15 DOM
-
2026-06-09days on market $144,500 Active 14 DOM
-
2026-06-08days on market $144,500 Active 13 DOM
-
2026-06-07days on market $144,500 Active 12 DOM
-
2026-06-03days on market $144,500 Active 8 DOM
-
2026-06-02days on market $144,500 Active 7 DOM
-
2026-06-01days on market $144,500 Active 6 DOM
-
2026-05-31days on market $144,500 Active 5 DOM
-
2026-05-30days on market $144,500 Active 4 DOM
-
2026-05-12price $148,500 739-char remark
-
2026-05-04price $149,300 739-char remark
-
2026-04-29price $149,400 739-char remark
-
2026-04-20$149,500 Active 739-char remark
-
2026-04-20historical
-
2026-04-13price $152,300
-
2026-04-07price $152,400
-
2026-03-31price $152,500
-
2026-03-17status Active
-
2026-03-13historical Active Under Contract
-
2026-03-09$154,500 Active
-
2026-03-09historical
-
2026-03-02price $158,500
-
2026-02-24price $159,200
-
2026-02-16price $159,300
-
2026-02-11$159,500 Active
-
2020-05-19status Pending
-
2020-05-19status Active
-
2020-03-21historical
-
2019-12-02soldstatus
-
2019-11-14status Pending
-
2019-11-14historical
-
2019-10-11price $115,900
-
2019-05-16price $116,900
-
2019-02-24status Active
-
2019-01-19historical
-
2018-12-26$119,900 Active
-
2018-12-22$119,900 Active
-
2018-07-06soldstatus
-
2018-02-15$119,000
-
2017-06-12soldstatus $16,000
-
2016-08-18$17,000
-
2012-09-10soldstatus $29,500
-
2012-09-07$29,500
ⓘ Source: listings_history table (triggers on properties + properties_extension) + one-shot
backfill from property_details.listing_events for pre-trigger history.
Tax reassessment forecast TX · Resets to sale price
- Current annual tax
- $2,370 · $198/mo
- Projected year-2 tax
- $2,644 · $220/mo
- Expected delta
- +$274/yr (+$23/mo · 11.6%)
ⓘ Screening estimate from a state-policy table — verify with the county assessor before closing.
Climate risk First Street
- Flood 7/10 Severe FEMA zone X · 99% chance over 30 yrs
- Wildfire 5/10 Major
- Heat 9/10 Extreme 7 d/yr ≥111°F today · 22 d/yr by 30 yrs out
- Wind 9/10 Extreme 99% chance of damaging wind over 30 yrs
- Air quality 1/10 Low 0 unhealthy d/yr today · 0 by 30 yrs out
Nearby sold comps map
Loading sold comps map…
Walkable amenities ~0.75 mi
Loading nearby amenities…
Taxation est. · year 1
- Rental income
- $18,576
- − Mortgage interest
- −$8,094
- − Property taxes
- −$2,370
- − Insurance
- −$1,520
- − Repairs & maintenance
- −$1,486
- − Management
- −$1,486
- − Depreciation
- −$4,204
- Taxable loss
- −$585
- Est. tax savings @ 24.0%
- +$140
- After-tax cash flow
- $1,831/yr
For passive investors: Depreciation is non-cash, so a rental often shows a tax loss while cash-flowing — sheltering income. Rental losses are passive: they offset passive income freely, and up to $25,000/yr can offset ordinary (W-2) income if you actively participate and your MAGI is under $100k (phasing out to $0 by $150k); unused losses carry forward. On sale, claimed depreciation is recaptured at up to 25%, and gains may owe capital-gains tax (a 1031 exchange can defer both). Figures are a year-1 estimate at your 24.0% rate — not tax advice; consult a CPA.
Schools (NCES district)
- District
- Victoria ISD
- NCES district ID
- 4844150
- Math proficiency
- 24% ▼ -12.00%
- Reading proficiency
- 33% ▼ -2.00%
- Median HH income
- $50,534
- Composite
- 24.98/100
- National rank
- #7562
- State rank
- #645 of 826 in TX
Livability — Quail Creek
- Score
- 68/100
- State rank
- #476
- US rank
- #9560
Category grades
Schools grade is shown separately in the Schools card above.
Census & demographics
- Population (ZIP)
- 16,346
Population outlook (Victoria County) Hauer SSP2
- Today (2025)
- 106,119 people
- By 2030
- 113,161 · +6.6%
- By 2040
- 127,402 · +20.1%
- By 2050
- 141,953 · +33.8%
- By 2075
- 179,410 · +69.1%
- By 2100
- 200,127 · +88.6%
Race, ethnicity, and origin ACS 2023
- Neighborhood character
- Majority White (63%)
- Race & ethnicity
- White 63% Hispanic / Latino 30% Two or more races 18% Black 4%
- Hispanic origin (detail)
- Mexican 27%
- Common ancestry
- Slovak 2% Serbian 2% Lithuanian 1%
- Foreign-born
- 3% · Canada
- Languages at home
- 87% English-only · Spanish 12%
Political lean MEDSL · Victoria
- 2024 margin
- Solid R (+42.6) · D 28.4% · R 71.0%
- 2008→2024 swing
- -9.0pp toward R · 2008: -33.6pp · 2024: -42.6pp
- All cycles
- 2024: R+42.6 2020: R+38.0 2016: R+40.0 2012: R+37.8 2008: R+33.6
Not yet ingested
- Civics
- —
Market trends
- HPI YoY
- ▼ -68.60%
- Current HPI
- 139.4036
- Rent YoY
- —
- Metro
- —
- State GDP YoY
- ▲ 3.95%
- F500 in state
- 110
Industry mix (Fortune 500 HQ in TX)
| Industry | F500 HQs | Revenue |
|---|---|---|
| Energy | 16 | $1,198B |
|
||
| Technology | 5 | $198B |
|
||
| Engineering / Construction | 4 | $72B |
|
||
| Energy Services | 3 | $60B |
|
||
| Utilities | 3 | $41B |
|
||
| Healthcare | 2 | $330B |
|
||
Price history
+389.8% since first listed36 events — show timeline
- 2026-05-26 Listing Removed — CTXMLS
- 2026-05-26 Listed $144,500 CTXMLS
- 2026-05-12 Price Changed $148,500 CTXMLS
- 2026-05-04 Price Changed $149,300 CTXMLS
- 2026-04-29 Price Changed $149,400 CTXMLS
- 2026-04-20 Listing Removed — CTXMLS
- 2026-04-20 Listed $149,500 CTXMLS
- 2026-04-13 Price Changed $152,300 CTXMLS
- 2026-04-07 Price Changed $152,400 CTXMLS
- 2026-03-31 Price Changed $152,500 CTXMLS
- 2026-03-17 Relisted — CTXMLS
- 2026-03-13 Contingent — CTXMLS
- 2026-03-09 Listing Removed — CTXMLS
- 2026-03-09 Listed $154,500 CTXMLS
- 2026-03-02 Price Changed $158,500 CTXMLS
- 2026-02-24 Price Changed $159,200 CTXMLS
- 2026-02-16 Price Changed $159,300 CTXMLS
- 2026-02-11 Listed $159,500 CTXMLS
- 2020-05-19 Pending — CTXMLS
- 2020-05-19 Relisted — CTXMLS
- 2020-03-21 Delisted — CBMLS
- 2019-12-02 Sold (Public Records) — Public Records
- 2019-11-14 Pending — CTXMLS
- 2019-11-14 Listing Removed — CTXMLS
- 2019-10-11 Price Changed $115,900 CTXMLS
- 2019-05-16 Price Changed $116,900 CTXMLS
- 2019-02-24 Relisted — CTXMLS
- 2019-01-19 Listing Removed — CTXMLS
- 2018-12-26 Listed $119,900 CTXMLS
- 2018-12-22 Listed $119,900 CBMLS
- 2018-07-06 Sold (Public Records) — Public Records
- 2018-02-15 Listed $119,000 CBMLS
- 2017-06-12 Sold (MLS) $16,000 CTXMLS
- 2016-08-18 Listed $17,000 CTXMLS
- 2012-09-10 Sold (MLS) $29,500 CTXMLS
- 2012-09-07 Listed $29,500 CTXMLS
Property tax history
+9.8%/yrLatest (2025): $2,370 · +8.1% YoY. Source: county tax records.
Cash-flow waterfall
monthlySold comps — $/sqft
last 12 mo · ≤1 miLoading sold comps…