1701 Upland Dr #216 · Houston, TX
Flood risk 3/10 · Minor
- FEMA flood zone
- X (unshaded)
- Chance of flooding over 30 yrs
- 0.2%
- Est. flood insurance / yr
- $507 – $1,088
Fire risk 4/10 · Minor
- Est. fire insurance / yr
- $1,222 – $2,270
Heat risk 9/10 · Severe
- Hot days now (above 110°F)
- 7 days/yr
- Hot days in 30 yrs
- 25 days/yr
Wind risk 9/10 · Severe
- Chance of severe wind over 30 yrs
- 99.0%
Air-quality risk 3/10 · Minor
- Unhealthy air days now
- 2 days/yr
- Unhealthy air days in 30 yrs
- 3 days/yr
Risk factors via First Street. Map © Google.
Why this score? — see what drove the D grade
The composite is a weighted blend of 9 inputs, each scored 0–100. Each bar is that input's sub-score; the figure is the points it added to the 100-point composite (weight × sub-score).
- ARV discount +13.8/15.0
- Cash flow +8.6/30.0
- 1% rule +5.9/10.0
- Schools +4.1/10.0
- Livability +3.7/5.0
- Condition / age +2.5/5.0
- DSCR +2.4/10.0
- Rent growth +2.3/5.0
- Appreciation +0.0/10.0
$159,000
🖨 Deal sheet (PDF) 📄 Offer letter ✓ Due diligence
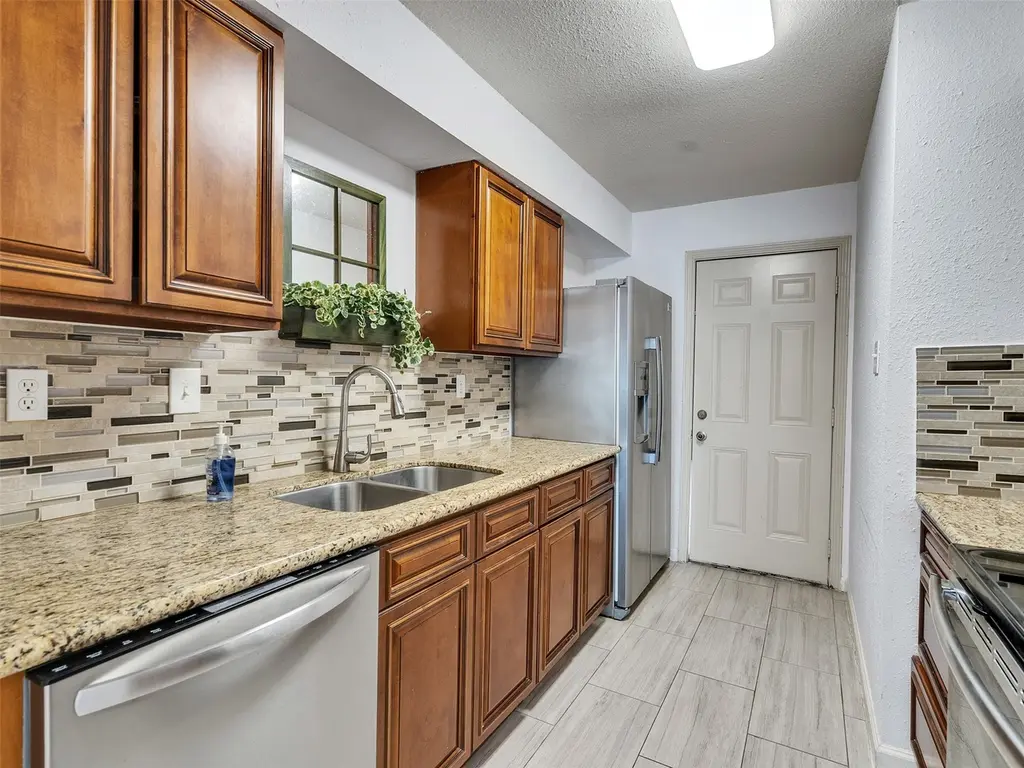
Listing remarks MLS
Beautiful MANNED GATED condominium fully remodeled. With 3 bedrooms and 2 full baths! Spacious living room with open concept to the dining and kitchen. New tile and laminate flooring. Kitchen offers New Granite countertops, New Stainless Steel appliances. New sinks throughout. New bathroom cabinets. Fresh paint throughout home. Located in Upland Park Townhomes. Beautiful and big community pool! Near Memorial City Mall. Minutes away from 1-10 and Beltway 8. SPRING BRANCH SCHOOL. LOCATION LOCATION LOCATION !!!
Key facts
- Fully remodeled
- Big community pool
- Manned gated
Tags
Neighborhood map
What this means for you Summary
Snapshot
- This is a 3-bed/2.0-bath condo listed at $159k.
Deal economics
- At list price, monthly cash flow is $-136 ($-2k/yr) — negative.
- To cash-flow at today's rent, offer at most $135k (15.1% below list).
- Meets the 1% rule at list price ($2k rent vs $159k).
- Recommended offer: $135k (15.1% below list) — sets the bar for cash-flow.
- Cap rate 5.3% vs local median 3.2% in Houston — top-decile yield for the area; either an underpriced asset or a hidden risk that comps aren't pricing in. Stress-test before assuming the spread holds.
Location & tenants
- Location reads 74/100 on livability (#184 in TX, #4,771 nationally) — a middle-class / working-renter tenant base. Strengths: amenities A+, cost of living A+, housing A+; Watch: crime F.
- Spring Branch ISD (urban): math 47% / reading 46% proficiency, ranked #215 of 826 in TX (top 26%) — families likely to look elsewhere, expect single-tenant / working-renter base with shorter leases.
- Zoned schools: Sherwood El (math 26% / reading 34%, grade F, #2,500 of 4,322 statewide, top 58%, 460 students, 66% FRL); Spring Forest Middle (math 39% / reading 44%, grade F, #595 of 1,662 statewide, top 37%, 962 students, 56% FRL); Stratford H S (math 52% / reading 59%, grade C, #364 of 1,632 statewide, top 23%, 2,272 students, 33% FRL) — zoned schools at 52% FRL track the district average.
- Market conditions: Rents soft (-0.9%/yr); 202 active listings in the ZIP; 40 comparable units currently listed for rent nearby; rentals at typical pace (median 21d on market — plan ~3-4 weeks tenant-placement turnaround); solid renter incomes; 29,883 units permitted in Harris County in 2024 (8,621 in 5+ unit buildings).
Forward outlook
- Local home prices are declining (-3.0%/yr); year-one equity from $1k of loan paydown is wiped out by about $5k of value loss. Plan a longer hold.
- Harris County population projected at +47% by 2050 — long-run rental-demand tailwind backs the buy-and-hold thesis.
Negotiation context
- It's been on market 285 days — a 12% lower offer ($140k) is reasonable based on typical stale-listing flexibility.
- 6 sale attempts since 7y ago with the ask held roughly flat each time — persistent listings suggest the price (not the market) is what's stuck; bring a comps-based counter.
Risks & watch-outs
- Watch-outs: HOA is 26% of rent.
- Climate carrying-cost: severe wind risk, 99% chance of damaging wind over 30y; extreme-heat days projected 7→25/yr by 2055 (HVAC capex compounding) — expect insurance premiums to compound above CPI over the hold.
Questions for the listing agent
- What do current leases actually rent for vs. the listed asking? Can we see a recent rent roll and the last 12 months of T-12 income?
- It's been on market 285 days. Have you received any prior offers? Is the seller open to a 15% concession, seller financing, or rate buy-down credit?
- Built in 1972 — when were the roof, HVAC, electrical panel, plumbing, and water heater last replaced?
- What does the HOA fee cover, when was the last increase, and are there any pending special assessments or reserve-fund shortfalls?
- Any open or pending special assessments — roof, HVAC, plumbing, elevator, façade? What's the per-unit balance and payoff schedule, and is the seller paying it off at close or rolling it to the buyer?
- Why hasn't it sold? Are there any deal-killer items the seller is aware of (foundation, flood, title, zoning, code violations)?
- Is there a deadline driving the sale (1031 exchange, divorce, estate, relocation)? That informs how much negotiation room exists.
- Schools are D-rated, which usually means shorter tenancies and higher turnover. Who's the typical renter profile here, and what's been the actual vacancy rate?
- Crime grade is F in this area — have there been break-ins, vandalism, or insurance claims at this property in the last 3 years? What carrier currently insures it and at what premium?
- The area grade is low — what's the realistic commute time and amenity access for the typical tenant pool here? Any planned neighborhood developments (good or bad) we should know about?
- What's the average days-on-market for RENTAL listings here right now (not sales)? A rising rental-DOM trend means longer vacancies and softer asking-rent achievability than the comps imply.
- What's the recent tenant-quality profile in this submarket — average credit score on applications, eviction rate, late-payment / NSF rate, and stable-employment percentage? A property-management company in the area should have these aggregated.
- How much new apartment / multifamily construction is in the pipeline within 1–3 miles? Heavy new supply (>2% of stock underway) typically softens rents 12–24 months out; light construction supports rent growth.
Investment metrics
- 1% rule
- 1.09% ✓
- Cap rate
- 5.26%
- Cash-on-cash
- -3.67%
- DSCR
- 0.84
- GRM
- 7.6
CMA / ARV
- ARV (median comp)
- $185,093
- List price
- $159,000
- Delta
- -14.10%
- Verdict
- UNDERPRICED
- Comps
- 20 within 1.0 mi
Projected returns pro-forma
-3.0% appreciation · 0.0% rent growth · sell at horizon
- IRR
- -27.1%
- Equity multiple
- 0.12×
- Total profit
- $-39,257
- Equity at exit
- $23,707
- IRR
- -51.2%
- Equity multiple
- -0.44×
- Total profit
- $-63,906
- Equity at exit
- $13,747
Cash invested: $44,520 (down + closing). Projections, not guarantees.
Landlord ↔ Tenant lean methodology
- Overall (STATE)
- 87 Strongly Landlord-Friendly
- State Texas
- 87 Strongly Landlord-Friendly · R+5
- County
- — inherits STATE
- City
- — inherits STATE
ZIP-level market 77043
- Rents YoY
- -0.9%
- Active inventory
- 202
- Price-to-rent
- 7.6×
Monthly cashflow live
- Estimated rent
- $1,737 high interval (Pro) →
- Mortgage (P&I)
- −$834
- Tax from tax record
- −$159 /mo · $1,905/yr
- Insurance
- −$66
- HOA
- −$450
- Vacancy / Maint / Mgmt
- −$365
- Net cashflow
- $-136
Break-even live
Sensitivity live
| Price | -10% $-46 | -5% $-91 | +0% $-136 | +5% $-181 | +10% $-226 |
|---|---|---|---|---|---|
| Rent | -10% $-274 | -5% $-205 | +0% $-136 | +5% $-68 | +10% $1 |
| Rate | -1.0pp $-56 | -0.5pp $-96 | base $-136 | +0.5pp $-177 | +1.0pp $-219 |
UW: 25.0% down · 7.5% · 30yr · 1.5% tax · 5.0% vac · 8.0% maint · 8.0% mgmt
Financing live
Cash to close
- Down payment
- $39,750
- Closing costs
- $4,770
- Reserves months
- —
- Total cash needed
- —
Loan-product check · same deal, 3 products live
Conventional
25% down · 7.5% · 30yr
- Down + closing
- —
- Monthly P&I
- —
- Monthly cashflow
- —
- DSCR
- —
- Eligible?
- —
Personal DTI + credit; lowest rate.
DSCR
20% down · 8.5% · 30yr
- Down + closing
- —
- Monthly P&I
- —
- Monthly cashflow
- —
- DSCR
- —
- Eligible?
- —
No personal income docs; deal must DSCR.
Hard money
10% down · 12.0% · 12mo
- Down + closing
- —
- Monthly P&I
- —
- Monthly cashflow
- —
- DSCR
- —
- Eligible?
- —
Short-term bridge; refi at stabilization.
Rent comps 40 comps
| Address | Beds | Baths | Sqft | Rent | $/sqft | DOM | Units | Dist |
|---|---|---|---|---|---|---|---|---|
| 1701 Upland Dr Houston, TX | 2.0–4.0 | 1.5–3.0 | 1340 | $1,850 | $1.38 | 45d | 8 | 0.09mi |
| 1707 Upland Dr Houston, TX | 2.0 | 2.0 | 1190 | $1,309 | $1.10 | 26d | 1 | 0.12mi |
| 1707 Upland Dr Houston, TX | 3.0 | 2.0 | 1350 | $1,465 | $1.09 | 45d | 1 | 0.12mi |
| 1707 Upland Dr Houston, TX | 3.0 | 2.0 | 1350 | $1,465 | $1.09 | 20d | 1 | 0.12mi |
| 1521 Sherwood Forest St Apt 303 Houston, TX | 2.0 | 2.5 | 1120 | $1,379 | $1.23 | 21d | 1 | 0.15mi |
| 1521 Sherwood Forest St Apt 405 Houston, TX | 2.0 | 2.5 | 1032 | $1,309 | $1.27 | 5d | 1 | 0.15mi |
| 1521 Sherwood Forest St Apt 1203 Houston, TX | 2.0 | 1.5 | 1188 | $1,299 | $1.09 | 5d | 1 | 0.15mi |
| 1521 Sherwood Forest St Unit 702 Houston, TX | 2.0 | 2.5 | 1108 | $1,359 | $1.23 | 21d | 1 | 0.15mi |
| 1521 Sherwood Forest St Houston, TX | 3.0 | 1.0–2.5 | 878 | $1,459 | $1.66 | 26d | 16 | 0.15mi |
| 1839 Sherwood Forest St Houston, TX | 3.0 | 2.5 | 1752 | $1,700 | $0.97 | 45d | 1 | 0.43mi |
| 1095 Brittmoore Rd Unit 1128 Houston, TX | 3.0 | 2.0 | 1475 | $2,284 | $1.55 | 45d | 1 | 0.63mi |
| 1095 Brittmoore Rd Unit 525 Houston, TX | 3.0 | 2.0 | 1475 | $2,336 | $1.58 | 0d | 1 | 0.63mi |
| 1095 Brittmoore Rd Unit 2174 Houston, TX | 2.0 | 2.0 | 1134 | $1,893 | $1.67 | 12d | 1 | 0.63mi |
| 1095 Brittmoore Rd Unit 3174 Houston, TX | 3.0 | 2.0 | 1475 | $2,387 | $1.62 | 0d | 1 | 0.63mi |
| 1095 Brittmoore Rd Unit 1132 Houston, TX | 2.0 | 2.0 | 1134 | $1,884 | $1.66 | 45d | 1 | 0.63mi |
| 1095 Brittmoore Rd Unit 3174 Houston, TX | 3.0 | 2.0 | 1475 | $2,376 | $1.61 | 12d | 1 | 0.63mi |
| 1095 Brittmoore Rd Unit 425 Houston, TX | 2.0 | 2.0 | 1134 | $1,853 | $1.63 | 0d | 1 | 0.63mi |
| 1095 Brittmoore Rd Unit 2148 Houston, TX | 2.0 | 2.0 | 1134 | $1,894 | $1.67 | 0d | 1 | 0.63mi |
| 1599 Brittmoore Rd Houston, TX | 2.0 | 2.0 | 1134 | $1,983 | $1.75 | 13d | 1 | 0.64mi |
| 10920 Day Rd Unit 2752 Houston, TX | 2.0 | 2.0 | 1204 | $1,445 | $1.20 | 45d | 1 | 0.67mi |
| 10920 Day Rd Unit 2064 Houston, TX | 2.0 | 2.0 | 1302 | $1,550 | $1.19 | 45d | 1 | 0.67mi |
| 1095 Brittmoore Rd Houston, TX | 2.0 | 2.0 | 1134 | $1,983 | $1.75 | 45d | 1 | 0.71mi |
| 11070 Old Katy Rd Houston, TX | 1.0–2.0 | 1.0–2.0 | 1060 | $2,166 | $2.04 | 0d | 21 | 0.73mi |
| 10902 Katy Fwy Houston, TX | 1.0–3.0 | 1.5–3.0 | 1421 | $2,735 | $1.92 | 0d | 19 | 0.87mi |
| 935 N Wilcrest Dr Houston, TX | 1.0–2.0 | 1.0–2.5 | 1260 | $2,561 | $2.03 | 0d | 22 | 0.89mi |
| 11601 Katy Fwy Unit 406 Houston, TX | 2.0 | 2.0 | 1079 | $1,200 | $1.11 | 45d | 1 | 1.01mi |
| 11601 Katy Fwy Unit 507 Houston, TX | 2.0 | 2.0 | 1148 | $1,250 | $1.09 | 45d | 1 | 1.01mi |
| 11601 Katy Fwy Unit 131 Houston, TX | 2.0 | 1.0 | 911 | $1,100 | $1.21 | 45d | 1 | 1.01mi |
| 11601 Katy Fwy Unit 227 Houston, TX | 2.0 | 2.0 | 1053 | $1,200 | $1.14 | 20d | 1 | 1.01mi |
| 874 Yorkchester Dr Houston, TX | 3.0 | 2.0 | 1282 | $1,620 | $1.26 | 45d | 1 | 1.11mi |
| 13800 Myrtlea Dr Houston, TX | 2.0 | 2.0 | 1075 | $1,355 | $1.26 | 13d | 1 | 1.12mi |
| 1888 Brittmoore Rd Houston, TX | 1.0–2.0 | 1.0–2.0 | 904 | $2,025 | $2.24 | 0d | 11 | 1.24mi |
| 10829 Hammerly Blvd Houston, TX | 2.0 | 2.0 | 1226 | $2,064 | $1.68 | 26d | 1 | 1.25mi |
| 11002 Hammerly Blvd Houston, TX | 2.0–4.0 | 2.5 | 1686 | $1,700 | $1.01 | 0d | 2 | 1.27mi |
| 10850 Hammerly Blvd Houston, TX | 1.0–2.0 | 1.0–2.0 | 882 | $2,355 | $2.67 | 0d | 21 | 1.30mi |
| 905 Town and Country Blvd Unit 2174 Houston, TX | 2.0 | 2.0 | 1210 | $2,527 | $2.09 | 12d | 1 | 1.33mi |
| 905 Town and Country Blvd Unit 2148 Houston, TX | 2.0 | 2.0 | 1210 | $2,487 | $2.06 | 0d | 1 | 1.33mi |
| 905 Town and Country Blvd Unit 942 Houston, TX | 2.0 | 2.0 | 1350 | $2,802 | $2.08 | 45d | 1 | 1.33mi |
| 905 Town and Country Blvd Unit 424 Houston, TX | 2.0 | 2.0 | 1210 | $2,503 | $2.07 | 7d | 1 | 1.33mi |
| 909 Town and Country Blvd Unit 12634 Houston, TX | 2.0 | 2.0 | 1256 | $1,798 | $1.43 | 45d | 1 | 1.36mi |
HOA detail condo
- Monthly dues
- $450 · $5,400/yr
- Likely covers
- poolsecurity
- Assessments
- None detected in remarks — confirm with the listing agent.
Listing history 31 events
-
2026-06-21days on market $159,000 Active 285 DOM
-
2026-06-18days on market $159,000 Active 282 DOM
-
2026-06-17days on market $159,000 Active 281 DOM
-
2026-06-16days on market $159,000 Active 280 DOM
-
2026-06-15days on market $159,000 Active 279 DOM
-
2026-06-13days on market $159,000 Active 277 DOM
-
2026-06-09days on market $159,000 Active 273 DOM
-
2026-06-08days on market $159,000 Active 272 DOM
-
2026-06-07days on market $159,000 Active 271 DOM
-
2026-06-04days on market $159,000 Active 268 DOM
-
2026-06-03days on market $159,000 Active 267 DOM
-
2026-06-02days on market $159,000 Active 266 DOM
-
2026-06-01days on market $159,000 Active 265 DOM
-
2026-05-31days on market $159,000 Active 264 DOM
-
2025-09-09$159,000 Active 513-char remark
Show marketing remark (513 chars)
Beautiful MANNED GATED condominium fully remodeled. With 3 bedrooms and 2 full baths! Spacious living room with open concept to the dining and kitchen. New tile and laminate flooring. Kitchen offers New Granite countertops, New Stainless Steel appliances. New sinks throughout. New bathroom cabinets. Fresh paint throughout home. Located in Upland Park Townhomes. Beautiful and big community pool! Near Memorial City Mall. Minutes away from 1-10 and Beltway 8. SPRING BRANCH SCHOOL. LOCATION LOCATION LOCATION !!!
-
2025-07-02historical
-
2025-06-26historical $1,700
-
2025-06-19$169,900 Active
-
2025-04-27historical
-
2025-02-28$1,700
-
2024-05-16price $184,900
-
2023-12-13price $194,900
-
2023-12-13status Active
-
2023-08-30historical
-
2023-03-06price $184,900
-
2023-02-17price $199,000
-
2022-07-01price $209,000
-
2022-05-11$225,000 Active
-
2019-08-08historical
-
2019-06-28$149,000 Active
-
1993-09-07soldstatus
ⓘ Source: listings_history table (triggers on properties + properties_extension) + one-shot
backfill from property_details.listing_events for pre-trigger history.
Tax reassessment forecast TX · Resets to sale price
- Current annual tax
- $1,905 · $159/mo
- Projected year-2 tax
- $2,910 · $242/mo
- Expected delta
- +$1,005/yr (+$84/mo · 52.8%)
ⓘ Screening estimate from a state-policy table — verify with the county assessor before closing.
Climate risk First Street
- Flood 3/10 Moderate FEMA zone X (unshaded) · 20% chance over 30 yrs
- Wildfire 4/10 Moderate
- Heat 9/10 Extreme 7 d/yr ≥110°F today · 25 d/yr by 30 yrs out
- Wind 9/10 Extreme 99% chance of damaging wind over 30 yrs
- Air quality 3/10 Moderate 2 unhealthy d/yr today · 3 by 30 yrs out
Nearby sold comps map
Loading sold comps map…
Walkable amenities ~0.75 mi
Loading nearby amenities…
Taxation est. · year 1
- Rental income
- $20,848
- − Mortgage interest
- −$8,906
- − Property taxes
- −$1,905
- − Insurance
- −$795
- − Repairs & maintenance
- −$1,668
- − Management
- −$1,668
- − HOA
- −$5,400
- − Depreciation
- −$4,625
- Taxable loss
- −$4,119
- Est. tax savings @ 24.0%
- +$989
- After-tax cash flow
- $-647/yr
For passive investors: Depreciation is non-cash, so a rental often shows a tax loss while cash-flowing — sheltering income. Rental losses are passive: they offset passive income freely, and up to $25,000/yr can offset ordinary (W-2) income if you actively participate and your MAGI is under $100k (phasing out to $0 by $150k); unused losses carry forward. On sale, claimed depreciation is recaptured at up to 25%, and gains may owe capital-gains tax (a 1031 exchange can defer both). Figures are a year-1 estimate at your 24.0% rate — not tax advice; consult a CPA.
Schools (NCES district)
- District
- Spring Branch ISD
- NCES district ID
- 4841100
- Math proficiency
- 47% ▼ -4.00%
- Reading proficiency
- 46% ▼ -1.00%
- Median HH income
- $60,311
- Composite
- 40.88/100
- National rank
- #3624
- State rank
- #215 of 826 in TX
Livability — Houston
- Score
- 74/100
- State rank
- #184
- US rank
- #4771
Category grades
Schools grade is shown separately in the Schools card above.
Census & demographics
- Census place
- Houston, TX
- County
- Harris County · 4,702,590 people
- City population
- 3,226,434
- Metro
- Houston-The Woodlands-Sugar Land, TX
- Population (ZIP)
- 29,048
- Household income
- $79,359
- Rent vs Own
- Severe rent burden
- 1667.0
Population outlook (Harris County) Hauer SSP2
- Today (2025)
- 5,571,493 people
- By 2030
- 6,089,821 · +9.3%
- By 2040
- 7,142,806 · +28.2%
- By 2050
- 8,185,864 · +46.9%
- By 2075
- 10,574,329 · +89.8%
- By 2100
- 12,109,958 · +117.4%
Race, ethnicity, and origin ACS 2023
- Neighborhood character
- Diverse neighborhood (Simpson 0.66)
- Race & ethnicity
- Hispanic / Latino 44% White 37% Two or more races 25% Black 8% Asian 6%
- Hispanic origin (detail)
- Mexican 24% Puerto Rican 3%
- Common ancestry
- Lithuanian 3% Slovak 2% Romanian 2%
- Foreign-born
- 31% · Canada, China, Vietnam
- Languages at home
- 52% English-only · Spanish 36% French/Haitian/Cajun 2% Vietnamese 1%
Political lean MEDSL · Harris
- 2024 margin
- Lean D (+5.5) · D 52.0% · R 46.4% · Other 1.6%
- 2008→2024 swing
- +3.9pp toward D · 2008: 1.6pp · 2024: 5.5pp
- All cycles
- 2024: D+5.5 2020: D+13.3 2016: D+12.4 2012: D+0.1 2008: D+1.6
Not yet ingested
- Civics
- —
Market trends
- HPI YoY
- ▼ -283.51%
- Current HPI
- 286.4053
- Rent YoY
- ▼ -0.86%
- Metro
- Houston-The Woodlands-Sugar Land, TX
- State GDP YoY
- ▲ 3.95%
- F500 in state
- 110
Industry mix (Fortune 500 HQ in TX)
| Industry | F500 HQs | Revenue |
|---|---|---|
| Energy | 16 | $1,198B |
|
||
| Technology | 5 | $198B |
|
||
| Engineering / Construction | 4 | $72B |
|
||
| Energy Services | 3 | $60B |
|
||
| Utilities | 3 | $41B |
|
||
| Healthcare | 2 | $330B |
|
||
Price history
+6.7% since first listed17 events — show timeline
- 2025-09-09 Listed $159,000 HARMLS
- 2025-07-02 Listing Removed — HARMLS
- 2025-06-26 Rental Removed $1,700 HARMLS
- 2025-06-19 Listed $169,900 HARMLS
- 2025-04-27 Listing Removed — HARMLS
- 2025-02-28 Listed for Rent $1,700 HARMLS
- 2024-05-16 Price Changed $184,900 HARMLS
- 2023-12-13 Price Changed $194,900 HARMLS
- 2023-12-13 Relisted — HARMLS
- 2023-08-30 Listing Removed — HARMLS
- 2023-03-06 Price Changed $184,900 HARMLS
- 2023-02-17 Price Changed $199,000 HARMLS
- 2022-07-01 Price Changed $209,000 HARMLS
- 2022-05-11 Listed $225,000 HARMLS
- 2019-08-08 Listing Removed — HARMLS
- 2019-06-28 Listed $149,000 HARMLS
- 1993-09-07 Sold (Public Records) — Public Records
Property tax history
+13.5%/yrLatest (2025): $1,905 · +18.2% YoY. Source: county tax records.
Cash-flow waterfall
monthlySold comps — $/sqft
last 12 mo · ≤1 miLoading sold comps…