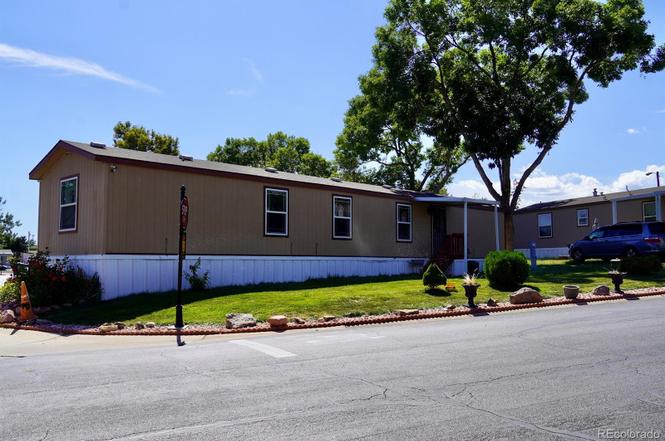
9100 Tejon st Lot 4 · Federal Heights, CO
Flood risk 1/10 · Minimal
- FEMA flood zone
- X (unshaded)
- Chance of flooding over 30 yrs
- 0.0%
- Est. flood insurance / yr
- $507 – $1,088
Fire risk 1/10 · Minimal
- Est. fire insurance / yr
- $939 – $1,743
Heat risk 3/10 · Minor
- Hot days now (above 93°F)
- 7 days/yr
- Hot days in 30 yrs
- 19 days/yr
Wind risk 2/10 · Minimal
- Chance of severe wind over 30 yrs
- —
Air-quality risk 4/10 · Minor
- Unhealthy air days now
- 6 days/yr
- Unhealthy air days in 30 yrs
- 8 days/yr
Risk factors via First Street. Map © Google.
Why this score? — see what drove the B- grade
The composite is a weighted blend of 9 inputs, each scored 0–100. Each bar is that input's sub-score; the figure is the points it added to the 100-point composite (weight × sub-score).
- Cash flow +30.0/30.0
- 1% rule +10.0/10.0
- DSCR +10.0/10.0
- ARV discount +7.5/15.0
- Livability +3.8/5.0
- Schools +3.5/10.0
- Rent growth +2.7/5.0
- Condition / age +2.5/5.0
- Appreciation +0.0/10.0
$110,000
🖨 Deal sheet 📄 Offer letter ✓ Due diligence
Listing remarks
Welcome to this corner lot Mobile home, in the Lamplighter Village Community. This home offers 3 Bed, 2 Full Bathrooms. 3 Car carport. Shed in the back for convenient storage. This home also features Efficient Sprinkler system to keep your lawn lush and green with minimal effort. 5 Minutes away from highway I25. Thornton town center. Come check it out and make this house your Home!
Key facts
- Shed in the back
- Corner lot
- Thornton town center
Tags
Property features AI
Finance
- Other: Building area reported as 1,050 (public records)
- Financial info: Annual tax amount listed as $100
- HOA & community: Land lease fee $1,200 per month (lease through Jan 1, 2100)
Exterior
- Parking: 2 off-street parking spaces (total 2)
- Utilities: Community sewer
- Home design: Manufactured in park (manufactured home); Individual ownership
- Construction: Wood siding; Membrane roof
- Exterior features: Lot located in a land-lease park (Lot #4); Monthly land lease
Interior
- Kitchen: Dishwasher; Microwave; Range; Refrigerator
- Bedrooms: 3 bedrooms, all on the main level; Primary suite on the main level
- Bathrooms: 2 full bathrooms, both on the main level
- Heating & cooling: Forced air heating; Central air conditioning
- Interior features: Dishwasher; Microwave; Range; Refrigerator
Neighborhood map
What this means for you Summary
Snapshot
- This is a 3-bed/2.0-bath manufactured listed at $110k.
Deal economics
- At list price, monthly cash flow is $807 ($10k/yr) — positive.
- The deal already cash-flows at list — no discount required.
- Meets the 1% rule at list price ($2k rent vs $110k).
- Recommended offer: $100k (9.0% below list) — sets the bar for market timing.
- Cap rate 15.1% vs local median 4.2% in Federal Heights — top-decile yield for the area; either an underpriced asset or a hidden risk that comps aren't pricing in. Stress-test before assuming the spread holds.
Location & tenants
- Location reads 76/100 on livability (#28 in CO, #3,380 nationally) — a middle-class / working-renter tenant base. Strengths: commute A+, cost of living A+, housing A+; Watch: health & safety D+, crime F.
- Adams 12 Five Star Schools (suburban): math 31% / reading 46% proficiency, ranked #26 of 86 in CO (top 30%) — families likely to look elsewhere, expect single-tenant / working-renter base with shorter leases.
- Zoned schools: Federal Heights Elementary School (math 2% / reading 8%, grade F, #958 of 966 statewide, top 100%, 414 students, 87% FRL); Northglenn Middle School (math 8% / reading 12%, grade F, #246 of 270 statewide, top 91%, 684 students, 85% FRL); Northglenn High School (math 16% / reading 38%, grade F, #257 of 381 statewide, top 68%, 1,959 students, 69% FRL) — zoned schools average 81% FRL vs 33% district-wide (47 pts higher); higher-poverty schools than district average — tighter screening recommended.
- Zoned-school proficiency averages 14% at this address vs 38% district-wide (-24 pts) — the specific schools serving this property underperform the Adams 12 Five Star Schools average; the district grade overstates school quality for this exact location.
- Market conditions: Rents flat; 138 active listings in the ZIP; 40 comparable units currently listed for rent nearby; rentals at typical pace (median 22d on market — plan ~3-4 weeks tenant-placement turnaround); 2,299 units permitted in Adams County in 2024 (343 in 5+ unit buildings).
- This rent runs 36% of the median local income ($62k/yr) — at the standard rent-burdened threshold; future hikes will face affordability resistance.
Forward outlook
- Local home prices are declining (-3.0%/yr); year-one equity from $761 of loan paydown is wiped out by about $3k of value loss. Plan a longer hold.
- Adams County population projected at +44% by 2050 — long-run rental-demand tailwind backs the buy-and-hold thesis.
- At projected returns (-3.0% appreciation + 0.8% rent growth), your $31k cash investment doubles in ~5 years — after that, you're playing with house money.
Negotiation context
- It's been on market 104 days — a 9% lower offer ($100k) is reasonable based on typical stale-listing flexibility.
Questions for the listing agent
- It's been on market 104 days. Have you received any prior offers? Is the seller open to a 9% concession, seller financing, or rate buy-down credit?
- Why hasn't it sold? Are there any deal-killer items the seller is aware of (foundation, flood, title, zoning, code violations)?
- Is there a deadline driving the sale (1031 exchange, divorce, estate, relocation)? That informs how much negotiation room exists.
- Schools are F-rated, which usually means shorter tenancies and higher turnover. Who's the typical renter profile here, and what's been the actual vacancy rate?
- Crime grade is F in this area — have there been break-ins, vandalism, or insurance claims at this property in the last 3 years? What carrier currently insures it and at what premium?
- What's the average days-on-market for RENTAL listings here right now (not sales)? A rising rental-DOM trend means longer vacancies and softer asking-rent achievability than the comps imply.
- What's the recent tenant-quality profile in this submarket — average credit score on applications, eviction rate, late-payment / NSF rate, and stable-employment percentage? A property-management company in the area should have these aggregated.
- How much new for-sale + rental construction is in the pipeline within 1–3 miles? Heavy new supply typically softens prices + rents 12–24 months out; constrained supply supports both.
Investment metrics
- 1% rule
- 1.69% ✓
- Cap rate
- 15.10%
- Cash-on-cash
- 31.46%
- DSCR
- 2.40
- GRM
- 4.9
CMA / ARV
- ARV (on-the-fly)
- $54,600
- Comps found
- 12
Show comp detail 12 sales within ~0.75 mi
| Address | Dist | Beds/Ba | Sqft | Sold | Price | $/sf | Match |
|---|---|---|---|---|---|---|---|
| 1801 W 92nd Ave | 0.38mi | 3/2.0 | 1,056 (+1%) | 8mo | $54,000 | $51 | 75 |
| 1801 W 92nd Ave #471 | 0.38mi | 2/2.0 (-1) | 1,064 (+1%) | 3mo | $34,000 | $32 | 73 |
| 1801 W 92nd Ave #222 | 0.38mi | 3/— | 1,036 (-1%) | 10mo | $63,000 | $61 | 72 |
| 1801 W 92nd Ave #218 | 0.38mi | 2/2.0 (-1) | 1,024 (-2%) | 2mo | $33,000 | $32 | 71 |
| 1801 W 92nd Ave | 0.38mi | 2/2.0 (-1) | 1,024 (-2%) | 4mo | $55,000 | $54 | 70 |
| 1801 W 92nd Ave | 0.38mi | 2/2.0 (-1) | 1,024 (-2%) | 5mo | $47,000 | $46 | 69 |
| 1801 W 92nd Ave #625 | 0.38mi | 2/2.0 (-1) | 1,056 (+1%) | 14mo | $27,000 | $26 | 65 |
| 2551 W 92nd Ave | 0.51mi | 3/2.0 | 1,024 (-2%) | 12mo | $104,200 | $102 | 62 |
| 1801 W 92nd Ave | 0.38mi | 3/2.0 | 1,152 (+10%) | 5mo | $132,000 | $115 | 62 |
| 2551 W 92nd Ave | 0.51mi | 3/2.0 | 1,120 (+7%) | 6mo | $55,000 | $49 | 60 |
| 1801 W 92nd Ave #375 | 0.38mi | 2/— (-1) | 960 (-9%) | 11mo | $65,000 | $68 | 54 |
| 2800 W 90th Ave | 0.65mi | 2/2.0 (-1) | 960 (-9%) | 0mo | $49,500 | $52 | 50 |
Match score weights: distance 35% · size 25% · config 20% · recency 20%. Top-matched comps best support the ARV.
Projected returns pro-forma
-3.0% appreciation · 0.77% rent growth · sell at horizon
- IRR
- 23.9%
- Equity multiple
- 1.96×
- Total profit
- $29,485
- Equity at exit
- $16,401
- IRR
- 30.4%
- Equity multiple
- 3.46×
- Total profit
- $75,752
- Equity at exit
- $9,511
Cash invested: $30,800 (down + closing). Projections, not guarantees.
Landlord ↔ Tenant lean methodology
- Overall (STATE)
- 38 Tenant-Leaning
- State Colorado
- 38 Tenant-Leaning · D+4
- County
- — inherits STATE
- City
- — inherits STATE
ZIP-level market 80260
- Rents YoY
- 0.8%
- Active inventory
- 138
- Price-to-rent
- 4.9×
Monthly cashflow live
- Estimated rent
- $1,858 high interval (Pro) →
- Mortgage (P&I)
- −$577
- Tax from tax record
- −$38 /mo · $450/yr
- Insurance
- −$46
- HOA
- −$0
- Vacancy / Maint / Mgmt
- −$390
- Net cashflow
- $807
Break-even live
UW: 25.0% down · 7.5% · 30yr · 1.5% tax · 5.0% vac · 8.0% maint · 8.0% mgmt
Financing live
Cash to close
- Down payment
- $27,500
- Closing costs
- $3,300
- Reserves months
- —
- Total cash needed
- —
Loan-product check · same deal, 3 products live
Conventional
25% down · 7.5% · 30yr
- Down + closing
- —
- Monthly P&I
- —
- Monthly cashflow
- —
- DSCR
- —
- Eligible?
- —
Personal DTI + credit; lowest rate.
DSCR
20% down · 8.5% · 30yr
- Down + closing
- —
- Monthly P&I
- —
- Monthly cashflow
- —
- DSCR
- —
- Eligible?
- —
No personal income docs; deal must DSCR.
Hard money
10% down · 12.0% · 12mo
- Down + closing
- —
- Monthly P&I
- —
- Monthly cashflow
- —
- DSCR
- —
- Eligible?
- —
Short-term bridge; refi at stabilization.
Rent comps 40 comps
| Address | Beds | Baths | Sqft | Rent | $/sqft | DOM | Units | Dist |
|---|---|---|---|---|---|---|---|---|
| 1801 W 92nd Ave #754 Denver, CO | 3.0 | 2.0 | 1123 | $1,995 | $1.78 | 5d | 1 | 0.39mi |
| 9151 Fontaine St Denver, CO | 2.0 | 1.0 | 700 | $1,313 | $1.88 | 3d | 1 | 0.49mi |
| 9189 Gale Blvd Thornton, CO | 1.0–3.0 | 1.0–2.0 | 755 | $1,699 | $2.25 | 24d | 1 | 0.49mi |
| 8778 Osage St Thornton, CO | 2.0 | 2.0 | 960 | $1,495 | $1.56 | 24d | 1 | 0.52mi |
| 8778 Osage St Thornton, CO | 2.0 | 1.0 | 949 | $1,495 | $1.58 | 22d | 1 | 0.52mi |
| 8675 Mariposa St Thornton, CO | 2.0 | 2.0 | 960 | $1,487 | $1.55 | 24d | 1 | 0.63mi |
| 9050 N Elm Ct Unit 1 Federal Heights, CO | 2.0 | 1.0 | 912 | $1,745 | $1.91 | 5d | 1 | 0.66mi |
| 1401 W 85th Ave Federal Heights, CO | 2.0 | 2.0–2.5 | 909 | $1,650 | $1.81 | 5d | 4 | 0.67mi |
| 1800 W 85th Ave Denver, CO | 1.0–2.0 | 1.0–2.0 | 798 | $1,609 | $2.02 | 2d | 45 | 0.69mi |
| 1300 Milky Way Thornton, CO | 1.0–2.0 | 1.0–2.0 | 826 | $1,595 | $1.93 | 2d | 21 | 0.69mi |
| 8901 Huron St Thornton, CO | 1.0–2.0 | 1.0 | 729 | $1,764 | $2.42 | 4d | 5 | 0.70mi |
| 1183 Milky Way Thornton, CO | 2.0 | 1.5 | 1200 | $2,147 | $1.79 | 15d | 1 | 0.72mi |
| 8705 Santa Fe Dr Thornton, CO | 2.0 | 1.5 | 1048 | $1,850 | $1.77 | 24d | 1 | 0.72mi |
| 9400 Elm Ct #645 Denver, CO | 3.0 | 2.0 | 1184 | $2,203 | $1.86 | 24d | 1 | 0.74mi |
| 8670 Clay St Unit 7317 Westminster, CO | 2.0 | 2.0 | 1111 | $2,054 | $1.85 | 24d | 1 | 0.76mi |
| 8670 Clay St Unit 5307 Westminster, CO | 2.0 | 2.0 | 951 | $1,891 | $1.99 | 5d | 1 | 0.76mi |
| 8670 Clay St Unit 6301 Westminster, CO | 3.0 | 2.0 | 1110 | $2,325 | $2.09 | 24d | 1 | 0.77mi |
| 8670 Clay St Unit 5201 Westminster, CO | 3.0 | 2.0 | 1110 | $2,550 | $2.30 | 24d | 1 | 0.77mi |
| 8670 Clay St Unit 5309 Westminster, CO | 2.0 | 2.0 | 1111 | $2,206 | $1.99 | 24d | 1 | 0.77mi |
| 8670 Clay St Unit 4312 Westminster, CO | 2.0 | 1.0 | 1038 | $1,891 | $1.82 | 24d | 1 | 0.77mi |
| 8670 Clay St Unit 5107 Westminster, CO | 2.0 | 2.0 | 951 | $1,891 | $1.99 | 24d | 1 | 0.77mi |
| 8670 Clay St Unit 7309 Westminster, CO | 2.0 | 2.0 | 951 | $1,761 | $1.85 | 24d | 1 | 0.77mi |
| 8670 Clay St Unit 7220 Westminster, CO | 2.0 | 1.0 | 1038 | $1,761 | $1.70 | 24d | 1 | 0.77mi |
| 8670 Clay St Unit 4211 Westminster, CO | 3.0 | 2.0 | 1110 | $2,186 | $1.97 | 24d | 1 | 0.77mi |
| 8972 Fox Dr Unit 102 Thornton, CO | 3.0 | 2.0 | 1472 | $2,295 | $1.56 | 5d | 1 | 0.77mi |
| 1654 Aspen Meadows Cir Unit Labs Denver, CO | 3.0 | 2.5 | 1355 | $2,400 | $1.77 | 24d | 1 | 0.77mi |
| 8670 Clay St Unit 7219 Westminster, CO | 3.0 | 2.0 | 1110 | $2,373 | $2.14 | 24d | 1 | 0.77mi |
| 700 W 91st Ave Thornton, CO | 1.0–2.0 | 1.0–2.0 | 857 | $2,082 | $2.43 | 3d | 12 | 0.79mi |
| 9081 Federal Blvd Westminster, CO | 2.0 | 1.0 | 855 | $1,466 | $1.72 | 3d | 3 | 0.83mi |
| 8865 Federal Blvd #202 Denver, CO | 2.0 | 1.0 | 1067 | $1,700 | $1.59 | 11d | 1 | 0.87mi |
| 647 W 91st Ave Denver, CO | 1.0–2.0 | 1.0 | 750 | $1,525 | $2.03 | 2d | 6 | 0.88mi |
| 2740 W 86th Ave Westminster, CO | 2.0 | 1.0 | 1000 | $1,565 | $1.56 | 3d | 2 | 0.89mi |
| 8900 Fox Dr #6 Thornton, CO | 2.0 | 2.0 | 1310 | $1,900 | $1.45 | 11d | 1 | 0.90mi |
| 8910 Fox Dr #14 Thornton, CO | 2.0 | 2.0 | 1108 | $1,950 | $1.76 | 18d | 1 | 0.91mi |
| 8330 Zuni St #206 Denver, CO | 2.0 | 1.0 | 800 | $1,580 | $1.98 | 24d | 1 | 0.96mi |
| 9783 Croke Dr Denver, CO | 3.0 | 1.5 | 1240 | $1,999 | $1.61 | 5d | 1 | 1.03mi |
| 747 W 96th Ave Denver, CO | 3.0 | 1.0 | 864 | $1,395 | $1.61 | 24d | 1 | 1.04mi |
| 747 W 96th Ave Denver, CO | 3.0 | 1.0 | 864 | $1,395 | $1.61 | 5d | 1 | 1.04mi |
| 707 W 96th Ave Thornton, CO | 3.0 | 1.0 | 859 | $1,350 | $1.57 | 24d | 1 | 1.06mi |
| 9710 Huron St Unit B Northglenn, CO | 3.0 | 2.0 | 1292 | $2,080 | $1.61 | 18d | 1 | 1.11mi |
Listing history 19 events
-
2026-06-18days on market $110,000 Active 104 DOM
-
2026-06-17pricedays on market $110,000 Active 103 DOM
-
2026-06-16days on market $112,500 Active 102 DOM
-
2026-06-15price $112,500 Active 101 DOM
-
2026-06-15days on market $115,500 Active 101 DOM
-
2026-06-13days on market $115,500 Active 99 DOM
-
2026-06-13days on market $115,500 Active 98 DOM
-
2026-06-09days on market $115,500 Active 95 DOM
-
2026-06-08days on market $115,500 Active 94 DOM
-
2026-06-08price $115,500 Active 93 DOM
-
2026-06-07days on market $120,500 Active 93 DOM
-
2026-06-04days on market $120,500 Active 90 DOM
-
2026-06-03days on market $120,500 Active 89 DOM
-
2026-06-02days on market $120,500 Active 88 DOM
-
2026-06-01days on market $120,500 Active 87 DOM
-
2026-05-31days on market $120,500 Active 86 DOM
-
2026-05-05price $126,500
-
2026-04-24price $130,000
-
2026-03-06$135,000 Active
ⓘ Source: listings_history table (triggers on properties + properties_extension) + one-shot
backfill from property_details.listing_events for pre-trigger history.
Tax reassessment forecast CO · Resets to sale price
- Current annual tax
- $450 · $38/mo
- Projected year-2 tax
- $605 · $50/mo
- Expected delta
- +$155/yr (+$13/mo · 34.4%)
ⓘ Screening estimate from a state-policy table — verify with the county assessor before closing.
Climate risk First Street
- Flood 1/10 Low FEMA zone X (unshaded) · 0% chance over 30 yrs
- Wildfire 1/10 Low
- Heat 3/10 Moderate 7 d/yr ≥93°F today · 19 d/yr by 30 yrs out
- Wind 2/10 Low
- Air quality 4/10 Moderate 6 unhealthy d/yr today · 8 by 30 yrs out
Nearby sold comps map
Loading sold comps map…
Walkable amenities ~0.75 mi
Loading nearby amenities…
Taxation est. · year 1
- Rental income
- $22,292
- − Mortgage interest
- −$6,162
- − Property taxes
- −$450
- − Insurance
- −$550
- − Repairs & maintenance
- −$1,783
- − Management
- −$1,783
- − Depreciation
- −$3,200
- Taxable income
- $8,363
- Est. tax owed @ 24.0%
- −$2,007
- After-tax cash flow
- $7,681/yr
For passive investors: Depreciation is non-cash, so a rental often shows a tax loss while cash-flowing — sheltering income. Rental losses are passive: they offset passive income freely, and up to $25,000/yr can offset ordinary (W-2) income if you actively participate and your MAGI is under $100k (phasing out to $0 by $150k); unused losses carry forward. On sale, claimed depreciation is recaptured at up to 25%, and gains may owe capital-gains tax (a 1031 exchange can defer both). Figures are a year-1 estimate at your 24.0% rate — not tax advice; consult a CPA.
Schools (NCES district)
- District
- Adams 12 Five Star Schools
- NCES district ID
- 0806900
- Math proficiency
- 31% ▼ -4.00%
- Reading proficiency
- 46% ▬ 0.00%
- Median HH income
- $67,478
- Composite
- 34.87/100
- National rank
- #5086
- State rank
- #26 of 86 in CO
Livability — Federal Heights
- Score
- 76/100
- State rank
- #28
- US rank
- #3380
Category grades
Schools grade is shown separately in the Schools card above.
Census & demographics
- Census place
- Federal Heights, CO
- County
- Adams County · 464,133 people
- City population
- 34,677
- Metro
- Denver-Aurora-Lakewood, CO
- Population (ZIP)
- 34,677
- Household income
- $61,852
- Rent vs Own
- Severe rent burden
- 1521.0
Population outlook (Adams County) Hauer SSP2
- Today (2025)
- 598,184 people
- By 2030
- 651,880 · +9.0%
- By 2040
- 759,778 · +27.0%
- By 2050
- 862,889 · +44.3%
- By 2075
- 1,085,994 · +81.5%
- By 2100
- 1,211,318 · +102.5%
Race, ethnicity, and origin ACS 2023
- Neighborhood character
- Majority Hispanic (61%)
- Race & ethnicity
- Hispanic / Latino 61% White 30% Two or more races 26% Asian 3% Black 3%
- Hispanic origin (detail)
- Mexican 51%
- Common ancestry
- Romanian 1% Slovak 1% Italian 1%
- Foreign-born
- 25% · Canada, Vietnam, China
- Languages at home
- 53% English-only · Spanish 42% Other Asian/Pacific 2% Other Indo-European 1%
Political lean MEDSL · Adams
- 2024 margin
- Lean D (+9.0) · D 53.2% · R 44.1% · Other 2.7%
- 2008→2024 swing
- -9.3pp toward R · 2008: 18.4pp · 2024: 9.0pp
- All cycles
- 2024: D+9.0 2020: D+16.3 2016: D+7.2 2012: D+15.1 2008: D+18.4
Not yet ingested
- Civics
- —
Market trends
- HPI YoY
- ▼ -260.84%
- Current HPI
- 285.4552
- Rent YoY
- ▲ 0.77%
- Metro
- Denver-Aurora-Lakewood, CO
- State GDP YoY
- ▲ 1.95%
- F500 in state
- 14
Industry mix (Fortune 500 HQ in CO)
| Industry | F500 HQs | Revenue |
|---|---|---|
| Technology Distribution | 1 | $31B |
|
||
| Food / Agriculture | 1 | $18B |
|
||
| Packaging | 1 | $14B |
|
||
| Healthcare | 1 | $13B |
|
||
| Energy | 1 | $10B |
|
||
| Technology | 1 | $4B |
|
||
Price history
-6.3% since first listed3 events — show timeline
- 2026-05-05 Price Changed $126,500 REColorado as Distributed by MLS Grid
- 2026-04-24 Price Changed $130,000 REColorado as Distributed by MLS Grid
- 2026-03-06 Listed $135,000 REColorado as Distributed by MLS Grid
Property tax history
+2.6%/yrLatest (2025): $450 · +349.5% YoY. Source: county tax records.
Cash-flow waterfall
monthlySold comps — $/sqft
last 12 mo · ≤1 miLoading sold comps…