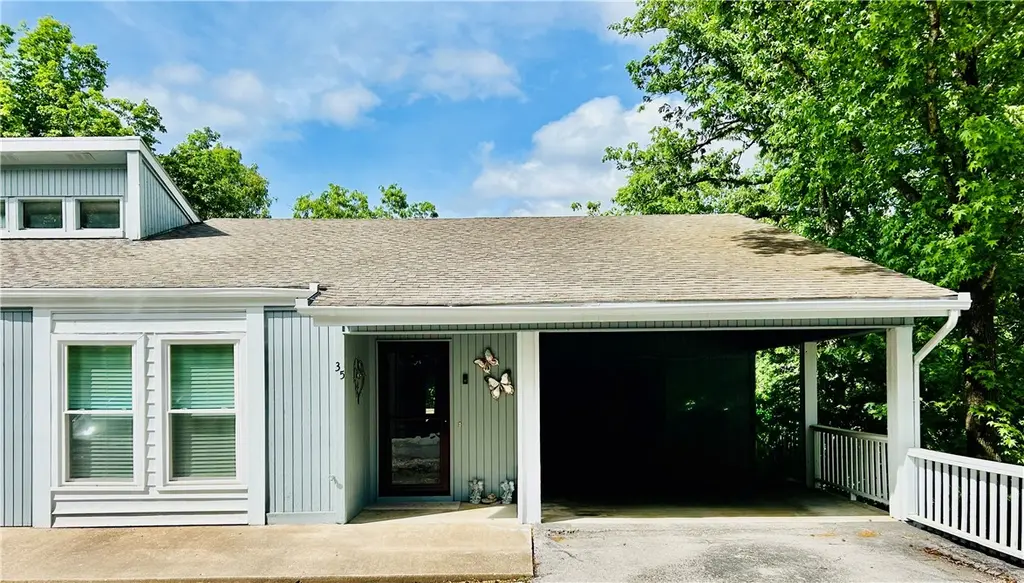
35 Estes Dr · Bella Vista, AR
Flood risk 1/10 · Minimal
- FEMA flood zone
- X (unshaded)
- Chance of flooding over 30 yrs
- 0.0%
- Est. flood insurance / yr
- $473 – $860
Fire risk 1/10 · Minimal
- Est. fire insurance / yr
- $1,499 – $2,785
Heat risk 5/10 · Moderate
- Hot days now (above 105°F)
- 7 days/yr
- Hot days in 30 yrs
- 20 days/yr
Wind risk 2/10 · Minimal
- Chance of severe wind over 30 yrs
- 2.0%
Air-quality risk 2/10 · Minimal
- Unhealthy air days now
- 0 days/yr
- Unhealthy air days in 30 yrs
- 1 days/yr
Risk factors via First Street. Map © Google.
Why this score? — see what drove the D grade
The composite is a weighted blend of 9 inputs, each scored 0–100. Each bar is that input's sub-score; the figure is the points it added to the 100-point composite (weight × sub-score).
- Cash flow +12.5/30.0
- ARV discount +8.2/15.0
- Schools +5.2/10.0
- 1% rule +4.2/10.0
- DSCR +3.7/10.0
- Livability +3.4/5.0
- Rent growth +2.5/5.0
- Condition / age +2.5/5.0
- Appreciation +0.0/10.0
$250,000
🖨 Deal sheet (PDF) 📄 Offer letter ✓ Due diligence
Listing remarks
Fantastic Bella Vista location! This two-level townhouse offers 3 bedrooms and 2 baths with plenty of storage. The primary bedroom is located on the upper level, while the large lower-level bedroom features direct access to the new back deck. The oversized living area also opens to the new deck, creating a great space to relax and enjoy the peaceful surroundings. Dining area includes a convenient pass-through from the kitchen for easy entertaining. Updates include new windows in the primary bedroom and large lower-level bedroom. One of the few townhomes in the area with a covered carport with attached storage closet, plus an additional under-unit storage room accessible from the back. Enjoy
Key facts
- Covered carport
- New back deck
- Paved walking trail
Tags
Property features AI
Finance
- HOA & community: Bella Vista POA; HOA fees: $40 monthly and an additional $90 monthly (see agent for details); Community amenities include clubhouse, fitness facilities, golf, playground, pool, tennis courts, lake access, sidewalks, trails/paths, biking, shopping, and nearby schools/park
Exterior
- Parking: Attached carport (1 covered space); Has carport
- Security: Smoke detectors
- Utilities: Cable available; Electricity available; Public water; Public sewer
- Home design: Multi-family zoning; 2-story property; Has a view
- Construction: Masonite exterior; Architectural shingle roof; Crawlspace foundation; Built 25+ years ago
- Exterior features: Covered patio/deck; Concrete driveway; Views; Near park; Wooded setting; Zero lot line; Public road frontage; Lake Windsor nearby; Community pool
Interior
- Kitchen: Dishwasher; Electric cooktop; Range hood; Disposal; Refrigerator; Electric water heater
- Bedrooms: Two basement bedrooms (each about 14 x 12)
- Flooring: Carpet; Laminate; Tile
- Bathrooms: Two full bathrooms
- Heating & cooling: Central heating (electric); Central air (electric)
- Interior features: Ceiling fans; Split-bedroom layout; Walk-in closet(s); Window treatments and blinds; Storage space; Finished basement; Full basement with crawlspace
- Laundry & utility: Washer hookup; Dryer hookup
Neighborhood map
What this means for you Summary
Snapshot
- This is a 3-bed/2.0-bath townhouse listed at $250k.
Deal economics
- At list price, monthly cash flow is $-38 ($-456/yr) — negative.
- To cash-flow at today's rent, offer at most $245k (2.2% below list).
- To meet the 1% rule (rent ≥ 1% of price), the offer needs to be $230k (7.9% below list).
- Recommended offer: $230k (7.9% below list) — sets the bar for 1% rule.
- Cap rate 6.1% vs local median 3.6% in Bella Vista — top-decile yield for the area; either an underpriced asset or a hidden risk that comps aren't pricing in. Stress-test before assuming the spread holds.
Location & tenants
- Location reads 67/100 on livability (#111 in AR) — a middle-class / working-renter tenant base. Strengths: cost of living A+, housing A+, schools A; Watch: amenities F, commute F, health & safety F.
- Bentonville School District (urban): math 59% / reading 59% proficiency, ranked #3 of 238 in AR (top 1%) — acceptable for families but not a draw, mixed tenant base, ~2y average lease.
- Market conditions: 838 active listings in the ZIP; 14 comparable units currently listed for rent nearby; rentals at typical pace (median 17d on market — plan ~3-4 weeks tenant-placement turnaround); solid renter incomes; 4,359 units permitted in Benton County in 2024 (402 in 5+ unit buildings).
- This rent runs 34% of the median local income ($82k/yr) — at the standard rent-burdened threshold; future hikes will face affordability resistance.
Forward outlook
- Local home prices are declining (-3.0%/yr); year-one equity from $2k of loan paydown is wiped out by about $8k of value loss. Plan a longer hold.
- Benton County population projected at +56% by 2050 — long-run rental-demand tailwind backs the buy-and-hold thesis.
Negotiation context
- It's been on market 41 days — a 3% lower offer ($242k) is reasonable based on typical stale-listing flexibility.
- 2 sale attempts since 12y ago; this cycle's ask has dropped $15k (6%) from the opening price — seller is motivated, your offer sets the floor, not the list.
- Current owner paid $76k; list at $250k implies a 229% gain — meaningful room to come down on a strong offer.
Risks & watch-outs
- Climate carrying-cost: extreme-heat days projected 7→20/yr by 2055 (HVAC capex compounding) — expect insurance premiums to compound above CPI over the hold.
Questions for the listing agent
- What do current leases actually rent for vs. the listed asking? Can we see a recent rent roll and the last 12 months of T-12 income?
- It's been on market 41 days. Have you received any prior offers? Is the seller open to a 8% concession, seller financing, or rate buy-down credit?
- What does the HOA fee cover, when was the last increase, and are there any pending special assessments or reserve-fund shortfalls?
- Is there a deadline driving the sale (1031 exchange, divorce, estate, relocation)? That informs how much negotiation room exists.
- Schools are A-rated — typically a magnet for longer-tenancy family renters. What's the average tenant stay here, and is there a school-zone premium baked into asking?
- The area grade is low — what's the realistic commute time and amenity access for the typical tenant pool here? Any planned neighborhood developments (good or bad) we should know about?
- What's the average days-on-market for RENTAL listings here right now (not sales)? A rising rental-DOM trend means longer vacancies and softer asking-rent achievability than the comps imply.
- What's the recent tenant-quality profile in this submarket — average credit score on applications, eviction rate, late-payment / NSF rate, and stable-employment percentage? A property-management company in the area should have these aggregated.
- How much new for-sale + rental construction is in the pipeline within 1–3 miles? Heavy new supply typically softens prices + rents 12–24 months out; constrained supply supports both.
Investment metrics
- 1% rule
- 0.92% ✗
- Cap rate
- 6.11%
- Cash-on-cash
- -0.65%
- DSCR
- 0.97
- GRM
- 9.0
CMA / ARV
- ARV (on-the-fly)
- $254,160
- Comps found
- 11
Show comp detail 11 sales within ~0.75 mi
| Address | Dist | Beds/Ba | Sqft | Sold | Price | $/sf | Match |
|---|---|---|---|---|---|---|---|
| 31 Abingdon Ln | 0.35mi | 3/2.0 | 1,760 (-0%) | 5mo | $212,000 | $120 | 79 |
| 2 Mindy Ln | 0.11mi | 3/2.0 | 1,600 (-9%) | 5mo | $280,000 | $175 | 75 |
| 28 Estes Dr | 0.03mi | 3/2.0 | 1,559 (-12%) | 8mo | $225,000 | $144 | 73 |
| 4 Estes Dr | 0.04mi | 3/2.0 | 1,567 (-11%) | 9mo | $246,500 | $157 | 72 |
| 16 Gretchen Ln | 0.35mi | 3/2.0 | 1,788 (+1%) | 13mo | $272,500 | $152 | 70 |
| 6 Barbara Ln | 0.45mi | 3/3.0 | 1,800 (+2%) | 10mo | $174,000 | $97 | 63 |
| 11 Connie Ln | 0.15mi | 3/2.0 | 1,918 (+9%) | 18mo | $282,000 | $147 | 63 |
| 2 William Ln | 0.47mi | 3/2.0 | 1,712 (-3%) | 21mo | $275,000 | $161 | 56 |
| 4 Gretchen Ln | 0.38mi | 3/3.0 | 1,600 (-9%) | 15mo | $196,500 | $123 | 50 |
| 2 Gail Ln | 0.46mi | 3/2.5 | 1,920 (+9%) | 23mo | $260,000 | $135 | 42 |
| 5 August Ln | 0.43mi | 4/3.0 (+1) | 1,966 (+11%) | 20mo | $275,000 | $140 | 35 |
Match score weights: distance 35% · size 25% · config 20% · recency 20%. Top-matched comps best support the ARV.
Projected returns pro-forma
-3.0% appreciation · 3.0% rent growth · sell at horizon
- IRR
- -17.3%
- Equity multiple
- 0.39×
- Total profit
- $-42,815
- Equity at exit
- $37,276
- IRR
- -9.2%
- Equity multiple
- 0.43×
- Total profit
- $-39,931
- Equity at exit
- $21,615
Cash invested: $70,000 (down + closing). Projections, not guarantees.
Landlord ↔ Tenant lean methodology
- Overall (STATE)
- 92 Strongly Landlord-Friendly
- State Arkansas
- 92 Strongly Landlord-Friendly · R+14
- County
- — inherits STATE
- City
- — inherits STATE
ZIP-level market 72715
- Home prices YoY
- -6.6%
- Active inventory
- 838
- Price-to-rent
- 9.0×
Monthly cashflow live
- Estimated rent
- $2,303 high interval (Pro) →
- Mortgage (P&I)
- −$1,311
- Tax est. 1.5%
- −$312 /mo · $3,750/yr
- Insurance
- −$104
- HOA
- −$130
- Vacancy / Maint / Mgmt
- −$484
- Net cashflow
- $-38
Break-even live
Sensitivity live
| Price | -10% $135 | -5% $48 | +0% $-38 | +5% $-124 | +10% $-211 |
|---|---|---|---|---|---|
| Rent | -10% $-220 | -5% $-129 | +0% $-38 | +5% $53 | +10% $144 |
| Rate | -1.0pp $88 | -0.5pp $26 | base $-38 | +0.5pp $-103 | +1.0pp $-169 |
UW: 25.0% down · 7.5% · 30yr · 1.5% tax · 5.0% vac · 8.0% maint · 8.0% mgmt
Financing live
Cash to close
- Down payment
- $62,500
- Closing costs
- $7,500
- Reserves months
- —
- Total cash needed
- —
Loan-product check · same deal, 3 products live
Conventional
25% down · 7.5% · 30yr
- Down + closing
- —
- Monthly P&I
- —
- Monthly cashflow
- —
- DSCR
- —
- Eligible?
- —
Personal DTI + credit; lowest rate.
DSCR
20% down · 8.5% · 30yr
- Down + closing
- —
- Monthly P&I
- —
- Monthly cashflow
- —
- DSCR
- —
- Eligible?
- —
No personal income docs; deal must DSCR.
Hard money
10% down · 12.0% · 12mo
- Down + closing
- —
- Monthly P&I
- —
- Monthly cashflow
- —
- DSCR
- —
- Eligible?
- —
Short-term bridge; refi at stabilization.
Rent comps 14 comps
| Address | Beds | Baths | Sqft | Rent | $/sqft | DOM | Units | Dist |
|---|---|---|---|---|---|---|---|---|
| 6 Connie Ln Bella Vista, AR | 3.0 | 2.0 | 1440 | $2,250 | $1.56 | 25d | 1 | 0.12mi |
| 2 William Ln Bella Vista, AR | 3.0 | 2.0 | 1712 | $1,900 | $1.11 | 23d | 1 | 0.47mi |
| 2 William Ln Bella Vista, AR | 3.0 | 2.0 | 1712 | $1,850 | $1.08 | 16d | 1 | 0.47mi |
| 2 Felton Ln Unit 1241295P Bella Vista, AR | 2.0 | 2.0 | 1388 | $2,815 | $2.03 | 16d | 1 | 0.92mi |
| 9 N Cerney Ln Unit 1297034P Bella Vista, AR | 3.0 | 3.0 | 2497 | $2,340 | $0.94 | 16d | 1 | 0.93mi |
| 15 Baywater Ln Unit 1221842P Bella Vista, AR | 3.0 | 2.0 | 1915 | $5,167 | $2.70 | 23d | 1 | 0.94mi |
| 71 London Dr Bella Vista, AR | 3.0 | 2.0 | 1490 | $2,100 | $1.41 | 25d | 1 | 1.21mi |
| 5 Wreston Ln Bella Vista, AR | 3.0 | 3.0 | 2290 | $2,000 | $0.87 | 16d | 1 | 1.23mi |
| 4 Kemble Cir Bella Vista, AR | 3.0 | 2.0 | 1376 | $1,850 | $1.34 | 25d | 1 | 1.23mi |
| 6 Erith Ln Unit 1512836P Bella Vista, AR | 4.0 | 2.0 | 2077 | $5,027 | $2.42 | 16d | 1 | 1.32mi |
| 26 Purfleet Dr Bella Vista, AR | 3.0 | 2.0 | 1276 | $1,575 | $1.23 | 16d | 1 | 1.42mi |
| 9 Purfleet Dr Unit 1366492P Bella Vista, AR | 3.0 | 2.0 | 1625 | $3,392 | $2.09 | 16d | 1 | 1.46mi |
| 4 Tilbury Ln Bella Vista, AR | 3.0 | 2.5 | 1742 | $1,850 | $1.06 | 16d | 1 | 1.48mi |
| 1 Yarty Ln Bella Vista, AR | 2.0 | 2.0 | 1815 | $2,300 | $1.27 | 25d | 1 | 1.48mi |
HOA detail
- Monthly dues
- $130 · $1,560/yr
Listing history 26 events
-
2026-06-22days on market $250,000 Active 41 DOM
-
2026-06-18days on market $250,000 Active 38 DOM
-
2026-06-17days on market $250,000 Active 37 DOM
-
2026-06-16days on market $250,000 Active 36 DOM
-
2026-06-15pricedays on market $250,000 Active 35 DOM
-
2026-06-14days on market $258,000 Active 33 DOM
-
2026-06-10days on market $258,000 Active 30 DOM
-
2026-06-09days on market $258,000 Active 29 DOM
-
2026-06-08days on market $258,000 Active 28 DOM
-
2026-06-07days on market $258,000 Active 27 DOM
-
2026-06-05days on market $258,000 Active 24 DOM
-
2026-06-03pricedays on market $258,000 Active 23 DOM
-
2026-06-02days on market $265,000 Active 22 DOM
-
2026-06-01days on market $265,000 Active 21 DOM
-
2026-05-31days on market $265,000 Active 20 DOM
-
2026-05-31days on market $265,000 Active 19 DOM
-
2026-05-11$265,000 Active
-
2025-07-16price $279,900
-
2025-06-01price $289,000
-
2023-10-07price $274,900
-
2014-11-11soldstatus $76,000
-
2014-11-07soldstatus $76,000
-
2014-08-29$72,900
-
2011-10-28soldstatus $266,666
-
2006-08-04soldstatus $119,000
-
2005-04-05soldstatus $105,000
ⓘ Source: listings_history table (triggers on properties + properties_extension) + one-shot
backfill from property_details.listing_events for pre-trigger history.
Climate risk First Street
- Flood 1/10 Low FEMA zone X (unshaded) · 0% chance over 30 yrs
- Wildfire 1/10 Low
- Heat 5/10 Major 7 d/yr ≥105°F today · 20 d/yr by 30 yrs out
- Wind 2/10 Low 2% chance of damaging wind over 30 yrs
- Air quality 2/10 Low 0 unhealthy d/yr today · 1 by 30 yrs out
Nearby sold comps map
Loading sold comps map…
Walkable amenities ~0.75 mi
Loading nearby amenities…
Taxation est. · year 1
- Rental income
- $27,641
- − Mortgage interest
- −$14,004
- − Property taxes
- −$3,750
- − Insurance
- −$1,250
- − Repairs & maintenance
- −$2,211
- − Management
- −$2,211
- − HOA
- −$1,560
- − Depreciation
- −$7,273
- Taxable loss
- −$4,618
- Est. tax savings @ 24.0%
- +$1,108
- After-tax cash flow
- $653/yr
For passive investors: Depreciation is non-cash, so a rental often shows a tax loss while cash-flowing — sheltering income. Rental losses are passive: they offset passive income freely, and up to $25,000/yr can offset ordinary (W-2) income if you actively participate and your MAGI is under $100k (phasing out to $0 by $150k); unused losses carry forward. On sale, claimed depreciation is recaptured at up to 25%, and gains may owe capital-gains tax (a 1031 exchange can defer both). Figures are a year-1 estimate at your 24.0% rate — not tax advice; consult a CPA.
Schools (NCES district)
- District
- Bentonville School District
- NCES district ID
- 0503060
- Math proficiency
- 59% ▼ -8.00%
- Reading proficiency
- 59% ▼ -6.00%
- Median HH income
- $66,721
- Composite
- 51.85/100
- National rank
- #1661
- State rank
- #3 of 238 in AR
Livability — Bella Vista
- Score
- 67/100
- State rank
- #111
- US rank
- #11129
Category grades
Schools grade is shown separately in the Schools card above.
Census & demographics
- Census place
- Bella Vista, AR
- County
- Benton County · 259,241 people
- City population
- 31,638
- Metro
- Fayetteville-Springdale-Rogers, AR
- Population (ZIP)
- 17,288
- Household income
- $82,447
- Rent vs Own
- Severe rent burden
- 107.0
Population outlook (Benton County) Hauer SSP2
- Today (2025)
- 318,683 people
- By 2030
- 353,481 · +10.9%
- By 2040
- 425,280 · +33.4%
- By 2050
- 497,239 · +56.0%
- By 2075
- 662,114 · +107.8%
- By 2100
- 776,431 · +143.6%
Race, ethnicity, and origin ACS 2023
- Neighborhood character
- Predominantly White (84%)
- Race & ethnicity
- White 84% Two or more races 12% Hispanic / Latino 6% Asian 1%
- Hispanic origin (detail)
- Mexican 2% Dominican 2%
- Common ancestry
- Lithuanian 4% Slovak 4% Portuguese 2%
- Foreign-born
- 3% · Canada
- Languages at home
- 97% English-only · Spanish 2%
Political lean MEDSL · Benton
- 2024 margin
- Strong R (+27.0) · D 35.2% · R 62.1% · Other 2.7%
- 2008→2024 swing
- +9.6pp toward D · 2008: -36.5pp · 2024: -27.0pp
- All cycles
- 2024: R+27.0 2020: R+26.4 2016: R+34.9 2012: R+40.4 2008: R+36.5
Not yet ingested
- Civics
- —
Market trends
- HPI YoY
- ▼ -21.53%
- Current HPI
- 304.946
- Rent YoY
- —
- Metro
- Fayetteville-Springdale-Rogers, AR
- State GDP YoY
- ▲ 3.80%
- F500 in state
- 10
Industry mix (Fortune 500 HQ in AR)
| Industry | F500 HQs | Revenue |
|---|---|---|
| Retail | 1 | $681B |
|
||
| Food / Agriculture | 1 | $53B |
|
||
| Retail / Energy | 1 | $22B |
|
||
| Transportation / Logistics | 1 | $12B |
|
||
| Energy | 1 | $4B |
|
||
Price history
+152.4% since first listed10 events — show timeline
- 2026-05-11 Listed $265,000 NWARMLS
- 2025-07-16 Price Changed $279,900 NWARMLS
- 2025-06-01 Price Changed $289,000 NWARMLS
- 2023-10-07 Price Changed $274,900 NWARMLS
- 2014-11-11 Sold (Public Records) $76,000 Public Records
- 2014-11-07 Sold (MLS) $76,000 NWARMLS
- 2014-08-29 Listed $72,900 NWARMLS
- 2011-10-28 Sold (Public Records) $266,666 Public Records
- 2006-08-04 Sold (Public Records) $119,000 Public Records
- 2005-04-05 Sold (Public Records) $105,000 Public Records
Property tax history
-9.6%/yrLatest (2025): $280 · -25.3% YoY. Source: county tax records.
Cash-flow waterfall
monthlySold comps — $/sqft
last 12 mo · ≤1 miLoading sold comps…