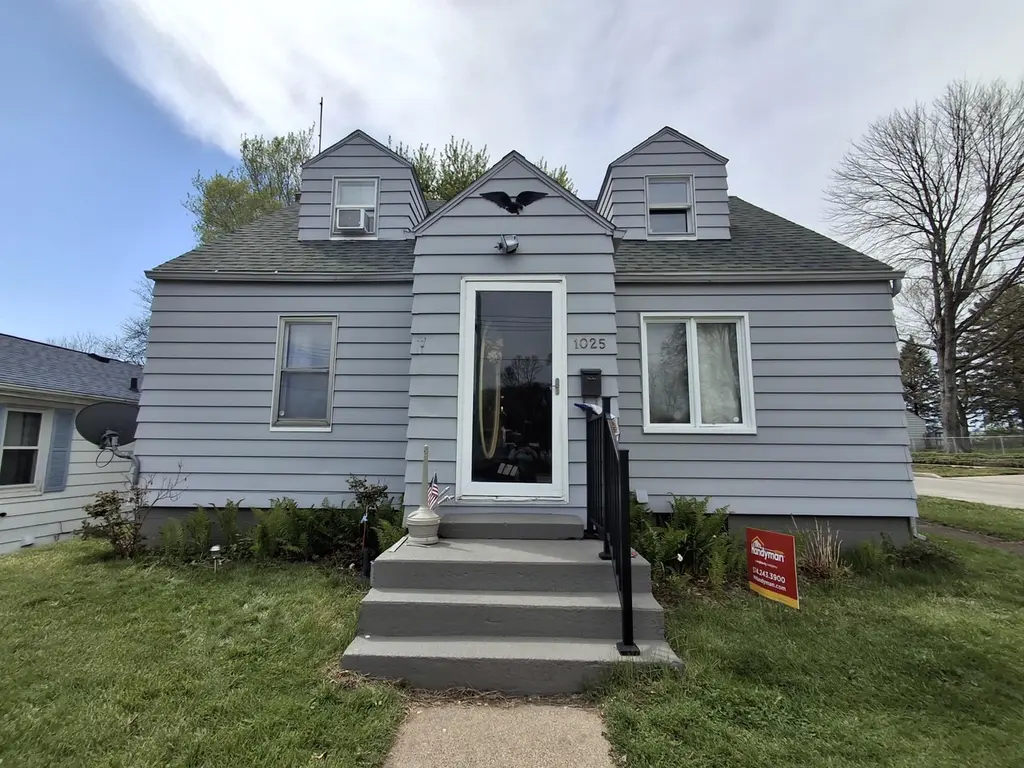
1025 Willow St · Mishawaka, IN
Flood risk 1/10 · Minimal
- FEMA flood zone
- X (unshaded)
- Chance of flooding over 30 yrs
- 0.0%
- Est. flood insurance / yr
- $473 – $860
Fire risk 1/10 · Minimal
- Est. fire insurance / yr
- $717 – $1,331
Heat risk 3/10 · Minor
- Hot days now (above 100°F)
- 7 days/yr
- Hot days in 30 yrs
- 16 days/yr
Wind risk 2/10 · Minimal
- Chance of severe wind over 30 yrs
- —
Air-quality risk 3/10 · Minor
- Unhealthy air days now
- 2 days/yr
- Unhealthy air days in 30 yrs
- 3 days/yr
Risk factors via First Street. Map © Google.
Why this score? — see what drove the B- grade
The composite is a weighted blend of 9 inputs, each scored 0–100. Each bar is that input's sub-score; the figure is the points it added to the 100-point composite (weight × sub-score).
- Cash flow +25.1/30.0
- ARV discount +15.0/15.0
- DSCR +8.2/10.0
- 1% rule +6.0/10.0
- Rent growth +3.8/5.0
- Livability +3.8/5.0
- Condition / age +2.5/5.0
- Schools +2.2/10.0
- Appreciation +0.0/10.0
$149,000
🖨 Deal sheet 📄 Offer letter ✓ Due diligence
Listing remarks
Welcome to 1025 Willow St in Mishawaka! This 3-bed, 1-bath home offers 1,920 sq ft of space. Enjoy a roomy layout, natural light, and a large yard for relaxing or entertaining. Convenient to shopping, dining, and schools, it's ideal for homeowners or investors. Add your personal touch and make it your own. Property sold AS-IS
Key facts
- Large yard
- Convenient to dining
- 5,410 sq ft lot
Tags
Property features AI
Finance
- Other: Occupant type: Owner
Exterior
- Parking: Detached garage; 2 garage spaces
- Utilities: Public water; Public sewer
- Home design: One and one-half story home; Built in 1950
- Construction: Unfinished basement
- Exterior features: Neighborhood view; Back yard fencing (partial)
Interior
- Kitchen: Gas range; Refrigerator
- Bedrooms: Primary bedroom; Second bedroom; Third bedroom
- Bathrooms: 1 full bathroom
- Heating & cooling: Forced air heating; Central air conditioning; Ceiling fans
- Interior features: No additional interior features listed
- Laundry & utility: Basement (unfinished)
Neighborhood map
What this means for you Summary
Snapshot
- This is a 3-bed/1.0-bath single-family listed at $149k.
Deal economics
- At list price, monthly cash flow is $331 ($4k/yr) — positive.
- The deal already cash-flows at list — no discount required.
- Meets the 1% rule at list price ($2k rent vs $149k).
- Cap rate 9.0% vs local median 5.3% in Mishawaka — top-decile yield for the area; either an underpriced asset or a hidden risk that comps aren't pricing in. Stress-test before assuming the spread holds.
Location & tenants
- Location reads 76/100 on livability (#53 in IN, #3,586 nationally) — a middle-class / working-renter tenant base. Strengths: cost of living A+, housing A+, health & safety B; Watch: schools C-, amenities F, employment F.
- School City Of Mishawaka (urban): math 23% / reading 30% proficiency, ranked #260 of 301 in IN (top 86%) — low school quality limits family demand, transient renter base, plan for 1-2y turnover.
- Market conditions: Rents rising fast (+5.2%/yr); 74 active listings in the ZIP; 5 comparable units currently listed for rent nearby; rentals at typical pace (median 14d on market — plan ~3-4 weeks tenant-placement turnaround); 754 units permitted in St. Joseph County in 2024 (460 in 5+ unit buildings).
- This rent runs 35% of the median local income ($57k/yr) — at the standard rent-burdened threshold; future hikes will face affordability resistance.
Forward outlook
- Local home prices are declining (-3.0%/yr); year-one equity from $1k of loan paydown is wiped out by about $4k of value loss. Plan a longer hold.
- At projected returns (-3.0% appreciation + 5.2% rent growth), your $42k cash investment doubles in ~9 years — after that, you're playing with house money.
Negotiation context
- Only 7 days on market — expect competitive offers; lowballing is unlikely to land.
Risks & watch-outs
- Watch-outs: built in 1950 — expect roof / HVAC / electrical / plumbing capex.
Questions for the listing agent
- Built in 1950 — when were the roof, HVAC, electrical panel, plumbing, and water heater last replaced?
- Is there a deadline driving the sale (1031 exchange, divorce, estate, relocation)? That informs how much negotiation room exists.
- What's the average days-on-market for RENTAL listings here right now (not sales)? A rising rental-DOM trend means longer vacancies and softer asking-rent achievability than the comps imply.
- What's the recent tenant-quality profile in this submarket — average credit score on applications, eviction rate, late-payment / NSF rate, and stable-employment percentage? A property-management company in the area should have these aggregated.
- How much new for-sale + rental construction is in the pipeline within 1–3 miles? Heavy new supply typically softens prices + rents 12–24 months out; constrained supply supports both.
Investment metrics
- 1% rule
- 1.10% ✓
- Cap rate
- 8.96%
- Cash-on-cash
- 9.51%
- DSCR
- 1.42
- GRM
- 7.6
CMA / ARV
- ARV (on-the-fly)
- $247,680
- Comps found
- 12
Show comp detail 12 sales within ~0.75 mi
| Address | Dist | Beds/Ba | Sqft | Sold | Price | $/sf | Match |
|---|---|---|---|---|---|---|---|
| 1009 E Mishawaka Ave | 0.44mi | 2/2.0 (-1) | 1,915 (-0%) | 2mo | $242,750 | $127 | 69 |
| 505 E Omer Ave | 0.53mi | 3/1.5 | 1,988 (+4%) | 4mo | $240,000 | $121 | 64 |
| 1616 Chestnut St | 0.40mi | 3/1.5 | 1,788 (-7%) | 12mo | $220,000 | $123 | 58 |
| 901 E Lawrence St | 0.20mi | 4/2.0 (+1) | 1,695 (-12%) | 7mo | $221,000 | $130 | 56 |
| 1817 Margaret Ave | 0.42mi | 3/2.0 | 2,128 (+11%) | 4mo | $225,000 | $106 | 55 |
| 1137 E Mishawaka Ave | 0.54mi | 3/1.0 | 1,716 (-11%) | 4mo | $242,000 | $141 | 54 |
| 433 Park Ave | 0.42mi | 3/2.0 | 1,670 (-13%) | 2mo | $219,000 | $131 | 53 |
| 1719 Maplehurst Ave | 0.48mi | 3/2.5 | 1,706 (-11%) | 1mo | $248,000 | $145 | 52 |
| 112 W Grove St | 0.68mi | 4/2.0 (+1) | 1,799 (-6%) | 2mo | $258,000 | $143 | 47 |
| 414 N Wenger Ave | 0.53mi | 4/1.5 (+1) | 1,740 (-9%) | 10mo | $225,000 | $129 | 44 |
| 425 Gernhart Ave | 0.62mi | 2/2.0 (-1) | 1,692 (-12%) | 10mo | $205,000 | $121 | 34 |
| 1026 E Lincolnway Way | 0.68mi | 3/2.0 | 2,170 (+13%) | 12mo | $241,000 | $111 | 33 |
Match score weights: distance 35% · size 25% · config 20% · recency 20%. Top-matched comps best support the ARV.
Projected returns pro-forma
-3.0% appreciation · 5.2% rent growth · sell at horizon
- IRR
- 0.4%
- Equity multiple
- 1.01×
- Total profit
- $606
- Equity at exit
- $22,216
- IRR
- 12.1%
- Equity multiple
- 2.04×
- Total profit
- $43,512
- Equity at exit
- $12,883
Cash invested: $41,720 (down + closing). Projections, not guarantees.
Landlord ↔ Tenant lean methodology
- Overall (STATE)
- 90 Strongly Landlord-Friendly
- State Indiana
- 90 Strongly Landlord-Friendly · R+11
- County
- — inherits STATE
- City
- — inherits STATE
ZIP-level market 46545
- Rents YoY
- 5.2%
- Active inventory
- 74
- Price-to-rent
- 7.6×
Monthly cashflow live
- Estimated rent
- $1,641 medium interval (Pro) →
- Mortgage (P&I)
- −$781
- Tax from tax record
- −$122 /mo · $1,468/yr
- Insurance
- −$62
- HOA
- −$0
- Vacancy / Maint / Mgmt
- −$345
- Net cashflow
- $331
Break-even live
UW: 25.0% down · 7.5% · 30yr · 1.5% tax · 5.0% vac · 8.0% maint · 8.0% mgmt
Financing live
Cash to close
- Down payment
- $37,250
- Closing costs
- $4,470
- Reserves months
- —
- Total cash needed
- —
Loan-product check · same deal, 3 products live
Conventional
25% down · 7.5% · 30yr
- Down + closing
- —
- Monthly P&I
- —
- Monthly cashflow
- —
- DSCR
- —
- Eligible?
- —
Personal DTI + credit; lowest rate.
DSCR
20% down · 8.5% · 30yr
- Down + closing
- —
- Monthly P&I
- —
- Monthly cashflow
- —
- DSCR
- —
- Eligible?
- —
No personal income docs; deal must DSCR.
Hard money
10% down · 12.0% · 12mo
- Down + closing
- —
- Monthly P&I
- —
- Monthly cashflow
- —
- DSCR
- —
- Eligible?
- —
Short-term bridge; refi at stabilization.
Rent comps 5 comps
| Address | Beds | Baths | Sqft | Rent | $/sqft | DOM | Units | Dist |
|---|---|---|---|---|---|---|---|---|
| 209 E Edgar Ave Mishawaka, IN | 3.0 | 1.0 | 1400 | $1,400 | $1.00 | 14d | 1 | 0.56mi |
| 116 W Mishawaka Ave Mishawaka, IN | 3.0 | 1.0–2.0 | 948 | $2,321 | $2.45 | 14d | 31 | 0.71mi |
| 507 Lincolnway E Unit 507 Mishawaka, IN | 2.0 | 1.0 | 1961 | $950 | $0.48 | 21d | 1 | 0.74mi |
| 103 E 7th St Mishawaka, IN | 4.0 | 2.0 | 2300 | $1,750 | $0.76 | 14d | 1 | 1.18mi |
| 642 E 11th St Mishawaka, IN | 3.0 | 1.0 | 1248 | $1,295 | $1.04 | 21d | 1 | 1.28mi |
Listing history 2 events
-
2026-04-30status Pending
-
2026-04-23$149,000 Active
ⓘ Source: listings_history table (triggers on properties + properties_extension) + one-shot
backfill from property_details.listing_events for pre-trigger history.
Tax reassessment forecast IN · Partial reset (capped growth)
- Current annual tax
- $1,468 · $122/mo
- Projected year-2 tax
- $1,468 · $122/mo
- Expected delta
- $0/yr ($0/mo · 0.0%)
ⓘ Screening estimate from a state-policy table — verify with the county assessor before closing.
Climate risk First Street
- Flood 1/10 Low FEMA zone X (unshaded) · 0% chance over 30 yrs
- Wildfire 1/10 Low
- Heat 3/10 Moderate 7 d/yr ≥100°F today · 16 d/yr by 30 yrs out
- Wind 2/10 Low
- Air quality 3/10 Moderate 2 unhealthy d/yr today · 3 by 30 yrs out
Nearby sold comps map
Loading sold comps map…
Walkable amenities ~0.75 mi
Loading nearby amenities…
Taxation est. · year 1
- Rental income
- $19,692
- − Mortgage interest
- −$8,346
- − Property taxes
- −$1,468
- − Insurance
- −$745
- − Repairs & maintenance
- −$1,575
- − Management
- −$1,575
- − Depreciation
- −$4,335
- Taxable income
- $1,647
- Est. tax owed @ 24.0%
- −$395
- After-tax cash flow
- $3,571/yr
For passive investors: Depreciation is non-cash, so a rental often shows a tax loss while cash-flowing — sheltering income. Rental losses are passive: they offset passive income freely, and up to $25,000/yr can offset ordinary (W-2) income if you actively participate and your MAGI is under $100k (phasing out to $0 by $150k); unused losses carry forward. On sale, claimed depreciation is recaptured at up to 25%, and gains may owe capital-gains tax (a 1031 exchange can defer both). Figures are a year-1 estimate at your 24.0% rate — not tax advice; consult a CPA.
Schools (NCES district)
- District
- School City Of Mishawaka
- NCES district ID
- 1806840
- Math proficiency
- 23% ▼ -9.00%
- Reading proficiency
- 30% ▼ -7.00%
- Median HH income
- $39,290
- Composite
- 22.26/100
- National rank
- #8143
- State rank
- #260 of 301 in IN
Livability — Mishawaka
- Score
- 76/100
- State rank
- #53
- US rank
- #3586
Category grades
Schools grade is shown separately in the Schools card above.
Census & demographics
- Census place
- Mishawaka, IN
- County
- Saint Joseph County · 189,048 people
- City population
- 57,683
- Metro
- South Bend-Mishawaka, IN-MI
- Population (ZIP)
- 26,606
- Household income
- $56,865
- Rent vs Own
- Severe rent burden
- 1243.0
Population outlook (St. Joseph County) Hauer SSP2
- Today (2025)
- 273,186 people
- By 2030
- 273,594 · +0.1%
- By 2040
- 271,641 · -0.6%
- By 2050
- 269,187 · -1.5%
- By 2075
- 263,136 · -3.7%
- By 2100
- 245,659 · -10.1%
Race, ethnicity, and origin ACS 2023
- Neighborhood character
- Predominantly White (78%)
- Race & ethnicity
- White 78% Two or more races 8% Black 7% Hispanic / Latino 6% Asian 3%
- Hispanic origin (detail)
- Mexican 2%
- Common ancestry
- Romanian 6% Lithuanian 2% English 2%
- Foreign-born
- 8% · Canada, China, South Korea
- Languages at home
- 90% English-only · Spanish 4% Chinese 1% Other Indo-European 1%
Political lean MEDSL · St. Joseph
- 2024 margin
- Toss-up / Even · D 50.0% · R 48.5% · Other 1.5%
- 2008→2024 swing
- -15.6pp toward R · 2008: 17.1pp · 2024: 1.5pp
- All cycles
- 2024: D+1.5 2020: D+5.8 2016: D+0.2 2012: D+3.5 2008: D+17.1
Not yet ingested
- Civics
- —
Market trends
- HPI YoY
- ▼ -114.83%
- Current HPI
- 188.2811
- Rent YoY
- ▲ 5.20%
- Metro
- South Bend-Mishawaka, IN-MI
- State GDP YoY
- ▲ 2.90%
- F500 in state
- 18
Industry mix (Fortune 500 HQ in IN)
| Industry | F500 HQs | Revenue |
|---|---|---|
| Industrial Machinery | 2 | $37B |
|
||
| Healthcare | 1 | $177B |
|
||
| Pharmaceuticals | 1 | $45B |
|
||
| Metals / Steel | 1 | $18B |
|
||
| Agriculture | 1 | $17B |
|
||
| Packaging | 1 | $12B |
|
||
Price history
2 events — show timeline
- 2026-04-30 Pending — NIRA MLS as Distributed by MLS Grid
- 2026-04-23 Listed $149,000 NIRA MLS as Distributed by MLS Grid
Property tax history
+2.2%/yrLatest (2023): $1,468 · -0.7% YoY. Source: county tax records.
Cash-flow waterfall
monthlySold comps — $/sqft
last 12 mo · ≤1 miLoading sold comps…