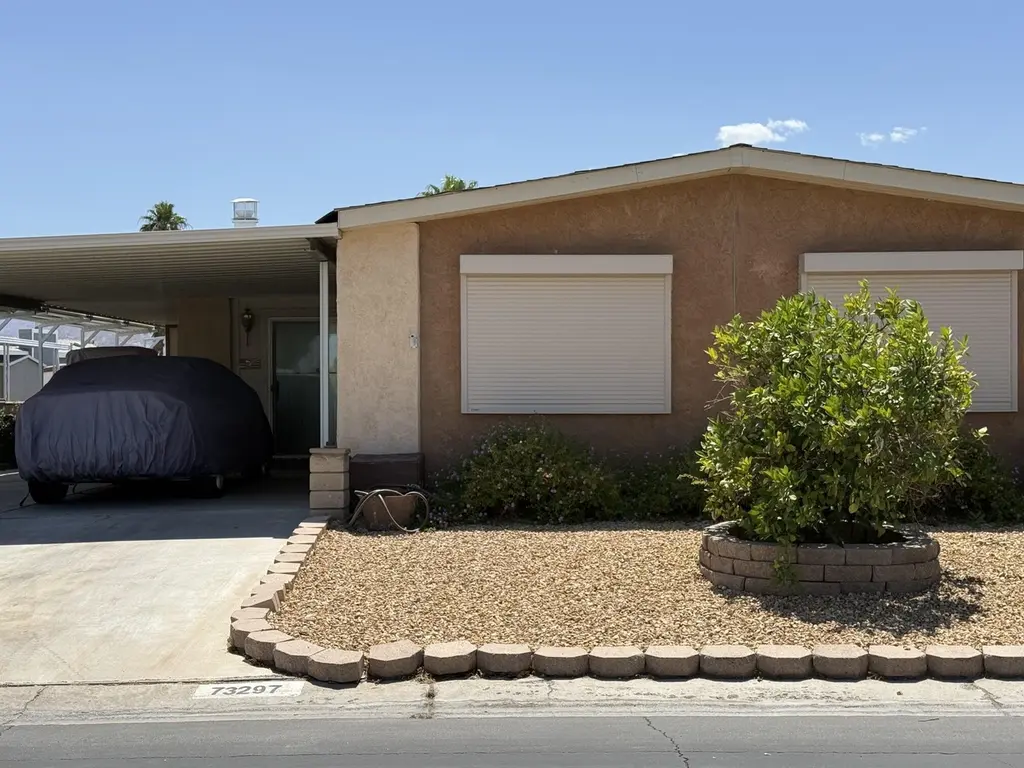
73297 Highland Springs Dr #2 · Palm Desert, CA
Flood risk 1/10 · Minimal
- FEMA flood zone
- X (unshaded)
- Chance of flooding over 30 yrs
- 0.0%
- Est. flood insurance / yr
- $507 – $1,088
Fire risk 1/10 · Minimal
- Est. fire insurance / yr
- $659 – $1,223
Heat risk 9/10 · Severe
- Hot days now (above 114°F)
- 7 days/yr
- Hot days in 30 yrs
- 18 days/yr
Wind risk 1/10 · Minimal
- Chance of severe wind over 30 yrs
- —
Air-quality risk 4/10 · Minor
- Unhealthy air days now
- 5 days/yr
- Unhealthy air days in 30 yrs
- 7 days/yr
Risk factors via First Street. Map © Google.
Why this score? — see what drove the B- grade
The composite is a weighted blend of 9 inputs, each scored 0–100. Each bar is that input's sub-score; the figure is the points it added to the 100-point composite (weight × sub-score).
- Cash flow +23.3/30.0
- ARV discount +15.0/15.0
- 1% rule +7.9/10.0
- DSCR +7.5/10.0
- Schools +3.8/10.0
- Rent growth +2.9/5.0
- Livability +2.6/5.0
- Condition / age +2.2/5.0
- Appreciation +0.0/10.0
$275,000
🖨 Deal sheet 📄 Offer letter ✓ Due diligence
Listing remarks
Welcome to Palm Desert Greens! Home is located on an interior street and close to the Clubhouse! And With Side by Side parking! This unique floorplan offers a separate Living Room, a separate Kitchen, Dining area and a Family room. . House offers two bedrooms, and an separate office. The Primary Bedroom has a long double entry closet with cabinets. The Laundry room has the washer and dryer space, and also extra additional space The windows are updated, and the two front Living room windows have outside shutters. This home has a lot of character! Palm Desert Greens has a beautiful well kept golf course which is included in your HOA dues. A Lovely Clubhouse, Restaurant and bar offering gre
Key facts
- Separate kitchen
- Dining area
- Family room
Tags
Property features AI
Finance
- Other: PUD: yes; Community features include golf course within development and pickleball courts; Furniture included as shown (few exceptions); Property sold as-is
- Financial info: Sale terms: Conventional, cash to new loan, or cash
- HOA & community: Monthly association fee of $400; Association amenities include clubhouse, fitness center, billiard and card rooms, barbecue, picnic area, bocce and tennis courts, sauna, golf course access, bocce ball court; Association fees cover clubhouse, security and cable TV; Senior community; gated
Exterior
- Parking: Two total parking spaces (two covered); Attached carport, side-by-side; Driveway and on-street parking
- Security: 24-hour security; Gated community
- Utilities: Water from Coachella Valley Water (district); Sewer connected and paid; Cable TV available
- Home design: Attached property; One story / single-level; Triple-wide mobile home; Addition: 9' x 40'
- Construction: Pier jacks foundation; Exterior construction: other; Manufactured home by FUQUA (manufacture date 01/01/1980); Mobile home dimensions approx. 24' x 63'; One shed on the property; Mobile home will remain
- Exterior features: Block and other fencing; Sprinkler system with timer; Street lights; Gated community with 24-hour security
Interior
- Kitchen: Granite counters; Refrigerator; Dishwasher; Disposal
- Bedrooms: Bedrooms located on main level
- Flooring: Laminate flooring
- Bathrooms: 2 full bathrooms; Tile shower and shower stall; Tub only in at least one bathroom
- Heating & cooling: Central heating (natural gas); Central air; Evaporative cooling
- Interior features: Drapes; Furnished; Fireplace in family room; Dining area and separate eating area; Utility/other room
- Laundry & utility: Washer and dryer; Laundry area
Neighborhood map
What this means for you Summary
Snapshot
- This is a 2-bed/2.0-bath manufactured listed at $275k. Condition is rated fair.
Deal economics
- At list price, monthly cash flow is $503 ($6k/yr) — positive.
- The deal already cash-flows at list — no discount required.
- Meets the 1% rule at list price ($4k rent vs $275k).
- Recommended offer: $271k (1.5% below list) — sets the bar for market timing.
- Cap rate 8.5% vs local median 3.5% in Palm Desert — top-decile yield for the area; either an underpriced asset or a hidden risk that comps aren't pricing in. Stress-test before assuming the spread holds.
Location & tenants
- Location reads 51/100 on livability (#1,050 in CA) — a working-class tenant base; expect higher turnover. Strengths: schools A-, employment B+, housing B; Watch: crime D, amenities F, commute F.
- Desert Sands Unified (suburban): math 31% / reading 56% proficiency, ranked #199 of 517 in CA (top 38%) — families likely to look elsewhere, expect single-tenant / working-renter base with shorter leases.
- Market conditions: Rents rising (+1.6%/yr); 545 active listings in the ZIP; 40 comparable units currently listed for rent nearby; rentals lingering (median 44d on market — plan ~5-8 weeks vacancy on turnover, expect pricing pressure); 58% of comp listings sitting > 30 days — soft ceiling on asking rent; 9,195 units permitted in Riverside County in 2024 (1,512 in 5+ unit buildings).
- At $3,548/mo this rent would consume 61% of the median local household income ($70k/yr) (locally 1734% of renters already pay >50% of income on rent) — very limited rent-growth headroom before tenants either downsize or default.
Forward outlook
- Local home prices are declining (-3.0%/yr); year-one equity from $2k of loan paydown is wiped out by about $8k of value loss. Plan a longer hold.
- Riverside County population projected at +22% by 2050 — long-run rental-demand tailwind backs the buy-and-hold thesis.
Negotiation context
- It's been on market 22 days — a 2% lower offer ($271k) is reasonable based on typical stale-listing flexibility.
Risks & watch-outs
- Climate carrying-cost: extreme-heat days projected 7→18/yr by 2055 (HVAC capex compounding) — expect insurance premiums to compound above CPI over the hold.
Questions for the listing agent
- Have any recent inspections been done? Can we get a copy of the seller's disclosures and any deferred-maintenance estimates?
- Built in 1979 — when were the roof, HVAC, electrical panel, plumbing, and water heater last replaced?
- What does the HOA fee cover, when was the last increase, and are there any pending special assessments or reserve-fund shortfalls?
- Is there a deadline driving the sale (1031 exchange, divorce, estate, relocation)? That informs how much negotiation room exists.
- Schools are A-rated — typically a magnet for longer-tenancy family renters. What's the average tenant stay here, and is there a school-zone premium baked into asking?
- Crime grade is D in this area — have there been break-ins, vandalism, or insurance claims at this property in the last 3 years? What carrier currently insures it and at what premium?
- What's the average days-on-market for RENTAL listings here right now (not sales)? A rising rental-DOM trend means longer vacancies and softer asking-rent achievability than the comps imply.
- What's the recent tenant-quality profile in this submarket — average credit score on applications, eviction rate, late-payment / NSF rate, and stable-employment percentage? A property-management company in the area should have these aggregated.
- How much new for-sale + rental construction is in the pipeline within 1–3 miles? Heavy new supply typically softens prices + rents 12–24 months out; constrained supply supports both.
Investment metrics
- 1% rule
- 1.29% ✓
- Cap rate
- 8.49%
- Cash-on-cash
- 7.84%
- DSCR
- 1.35
- GRM
- 6.5
CMA / ARV
- ARV (on-the-fly)
- $379,800
- Comps found
- 12
Show comp detail 12 sales within ~0.75 mi
| Address | Dist | Beds/Ba | Sqft | Sold | Price | $/sf | Match |
|---|---|---|---|---|---|---|---|
| 73297 Highland Springs Dr #2 | 0.00mi | 2/2.0 | 1,800 (0%) | 0mo | $275,000 | $153 | 100 |
| 73450 Country Club Dr Unit Sp. 91 | 0.34mi | 2/2.0 | 1,788 (-1%) | 0mo | $255,000 | $143 | 83 |
| 38235 Poppet Canyon Dr | 0.16mi | 2/2.0 | 1,680 (-7%) | 0mo | $355,000 | $211 | 81 |
| 38785 Bautista Canyon Way | 0.33mi | 2/2.0 | 1,760 (-2%) | 2mo | $330,000 | $188 | 79 |
| 73330 Desert Greens Dr N | 0.33mi | 2/2.0 | 1,740 (-3%) | 1mo | $229,080 | $132 | 78 |
| 73045 Buck Springs Dr | 0.24mi | 2/2.0 | 1,680 (-7%) | 2mo | $468,000 | $279 | 76 |
| 38251 Desert Greens Dr E | 0.47mi | 2/2.0 | 1,780 (-1%) | 1mo | $253,000 | $142 | 75 |
| 73701 Half Way Dr | 0.41mi | 2/2.5 | 1,890 (+5%) | 2mo | $400,000 | $212 | 69 |
| 38668 Fawn Springs Dr | 0.17mi | 3/2.5 (+1) | 1,600 (-11%) | 0mo | $410,000 | $256 | 66 |
| 73450 Country Club Dr #87 | 0.34mi | 3/2.0 (+1) | 1,636 (-9%) | 1mo | $222,500 | $136 | 63 |
| 73726 Desert Greens Dr N | 0.50mi | 3/2.0 (+1) | 2,004 (+11%) | 1mo | $460,000 | $230 | 52 |
| 39759 Manzanita Dr | 0.67mi | 3/2.0 (+1) | 1,940 (+8%) | 1mo | $449,900 | $232 | 49 |
Match score weights: distance 35% · size 25% · config 20% · recency 20%. Top-matched comps best support the ARV.
Projected returns pro-forma
-3.0% appreciation · 1.6% rent growth · sell at horizon
- IRR
- -6.1%
- Equity multiple
- 0.78×
- Total profit
- $-17,169
- Equity at exit
- $41,003
- IRR
- 1.5%
- Equity multiple
- 1.10×
- Total profit
- $7,833
- Equity at exit
- $23,777
Cash invested: $77,000 (down + closing). Projections, not guarantees.
Landlord ↔ Tenant lean methodology
- Overall (STATE)
- 18 Strongly Tenant-Friendly
- State California
- 18 Strongly Tenant-Friendly · D+13
- County
- — inherits STATE
- City
- — inherits STATE
ZIP-level market 92260
- Rents YoY
- 1.6%
- Active inventory
- 545
- Price-to-rent
- 6.5×
Monthly cashflow live
- Estimated rent
- $3,548 high interval (Pro) →
- Mortgage (P&I)
- −$1,442
- Tax est. 1.5%
- −$344 /mo · $4,125/yr
- Insurance
- −$115
- HOA
- −$400
- Vacancy / Maint / Mgmt
- −$745
- Net cashflow
- $503
Break-even live
UW: 25.0% down · 7.5% · 30yr · 1.5% tax · 5.0% vac · 8.0% maint · 8.0% mgmt
Financing live
Cash to close
- Down payment
- $68,750
- Closing costs
- $8,250
- Reserves months
- —
- Total cash needed
- —
Loan-product check · same deal, 3 products live
Conventional
25% down · 7.5% · 30yr
- Down + closing
- —
- Monthly P&I
- —
- Monthly cashflow
- —
- DSCR
- —
- Eligible?
- —
Personal DTI + credit; lowest rate.
DSCR
20% down · 8.5% · 30yr
- Down + closing
- —
- Monthly P&I
- —
- Monthly cashflow
- —
- DSCR
- —
- Eligible?
- —
No personal income docs; deal must DSCR.
Hard money
10% down · 12.0% · 12mo
- Down + closing
- —
- Monthly P&I
- —
- Monthly cashflow
- —
- DSCR
- —
- Eligible?
- —
Short-term bridge; refi at stabilization.
Rent comps 40 comps
| Address | Beds | Baths | Sqft | Rent | $/sqft | DOM | Units | Dist |
|---|---|---|---|---|---|---|---|---|
| 38520 Poppet Canyon Dr Palm Desert, CA | 2.0 | 2.0 | 1392 | $3,700 | $2.66 | 43d | 1 | 0.17mi |
| 73075 Buck Springs Dr Palm Desert, CA | 2.0 | 2.0 | 1440 | $1,950 | $1.35 | 43d | 1 | 0.20mi |
| 73639 Cabazon Peak Dr Palm Desert, CA | 2.0 | 2.0 | 1717 | $2,400 | $1.40 | 43d | 1 | 0.28mi |
| 73450 Country Club Dr #120 Palm Desert, CA | 2.0 | 2.0 | 1856 | $2,995 | $1.61 | 11d | 1 | 0.31mi |
| 38250 Azalea Dr Palm Desert, CA | 2.0 | 2.0 | 1806 | $5,500 | $3.05 | 43d | 1 | 0.31mi |
| 4162 Via Mattina Palm Desert, CA | 2.0 | 2.0 | 1867 | $2,950 | $1.58 | 12d | 1 | 0.44mi |
| 4155 Via Mattina Unit 4155 Palm Desert, CA | 2.0 | 3.0 | 2278 | $3,500 | $1.54 | 43d | 1 | 0.46mi |
| 4155 Via Mattina Palm Desert, CA | 3.0 | 3.0 | 2278 | $3,200 | $1.40 | 5d | 1 | 0.46mi |
| 4155 Via Mattina Palm Desert, CA | 3.0 | 3.0 | 2278 | $3,200 | $1.40 | 43d | 1 | 0.46mi |
| 3253 Via Giorna Palm Desert, CA | 2.0 | 2.0 | 1961 | $4,500 | $2.29 | 24d | 1 | 0.50mi |
| 170 Via Tramonto Palm Desert, CA | 3.0 | 2.0 | 1910 | $3,900 | $2.04 | 11d | 1 | 0.50mi |
| 170 Via Tramonto Palm Desert, CA | 3.0 | 2.0 | 1910 | $4,000 | $2.09 | 43d | 1 | 0.50mi |
| 248 Strada Fortuna Palm Desert, CA | 2.0 | 2.0 | 1400 | $2,500 | $1.79 | 43d | 1 | 0.51mi |
| 73843 Line Canyon Ln Palm Desert, CA | 2.0 | 2.0 | 1570 | $2,100 | $1.34 | 11d | 1 | 0.60mi |
| 40064 Silktree Ct Palm Desert, CA | 3.0 | 2.0 | 1712 | $3,200 | $1.87 | 24d | 1 | 0.72mi |
| 37677 Emerson Dr Palm Desert, CA | 3.0 | 2.0 | 1896 | $3,600 | $1.90 | 43d | 1 | 0.74mi |
| 37772 Hollister Dr Palm Desert, CA | 3.0 | 2.0 | 1271 | $3,200 | $2.52 | 43d | 1 | 0.80mi |
| 2701 Via Calderia Palm Desert, CA | 2.0 | 2.0 | 1559 | $2,850 | $1.83 | 24d | 1 | 0.80mi |
| 3443 Via Leonardo Palm Desert, CA | 3.0 | 2.0 | 2341 | $4,000 | $1.71 | 5d | 1 | 0.82mi |
| 40255 Sagewood Dr Palm Desert, CA | 3.0 | 2.0 | 1712 | $3,300 | $1.93 | 18d | 1 | 0.83mi |
| 1701 Retreat Cir Palm Desert, CA | 3.0 | 2.5 | 2034 | $5,300 | $2.61 | 43d | 1 | 0.85mi |
| 1803 Via San Martino Palm Desert, CA | 2.0 | 2.0 | 1559 | $3,900 | $2.50 | 43d | 1 | 0.88mi |
| 122 Kavenish Dr Rancho Mirage, CA | 3.0 | 3.0 | 2324 | $5,500 | $2.37 | 43d | 1 | 0.89mi |
| 40605 Ventana Ct Palm Desert, CA | 3.0 | 2.5 | 2093 | $4,500 | $2.15 | 18d | 1 | 0.90mi |
| 73983 Munn Cir Palm Desert, CA | 3.0 | 2.0 | 2064 | $3,400 | $1.65 | 43d | 1 | 0.91mi |
| 40592 Palm Ct Palm Desert, CA | 3.0 | 2.5 | 2498 | $5,000 | $2.00 | 12d | 1 | 0.92mi |
| 105 Kavenish Dr Rancho Mirage, CA | 3.0 | 3.0 | 1724 | $4,200 | $2.44 | 43d | 1 | 0.92mi |
| 40556 Clover Ln Palm Desert, CA | 3.0 | 2.5 | 1880 | $4,200 | $2.23 | 43d | 1 | 0.93mi |
| 40560 Glenwood Ln Palm Desert, CA | 3.0 | 3.0 | 2052 | $6,500 | $3.17 | 43d | 1 | 0.93mi |
| 41517 Armanac Ct Palm Desert, CA | 3.0 | 2.0 | 1537 | $3,400 | $2.21 | 3d | 1 | 0.95mi |
| 302 Retreat Cir Palm Desert, CA | 3.0 | 3.0 | 2184 | $6,000 | $2.75 | 43d | 1 | 0.96mi |
| 93 Kavenish Dr Rancho Mirage, CA | 3.0 | 3.0 | 2136 | $6,800 | $3.18 | 3d | 1 | 0.98mi |
| 502 Retreat Cir Palm Desert, CA | 3.0 | 3.0 | 2188 | $5,200 | $2.38 | 43d | 1 | 0.99mi |
| 72460 Rodeo Way Rancho Mirage, CA | 2.0 | 2.0 | 1851 | $2,500 | $1.35 | 5d | 1 | 1.01mi |
| 73750 Calle Bisque Palm Desert, CA | 3.0 | 2.0 | 1537 | $6,500 | $4.23 | 43d | 1 | 1.01mi |
| 83 Kavenish Dr Rancho Mirage, CA | 3.0 | 3.0 | 2324 | $8,500 | $3.66 | 44d | 1 | 1.02mi |
| 83 Kavenish Dr Rancho Mirage, CA | 3.0 | 3.0 | 2324 | $8,500 | $3.66 | 24d | 1 | 1.02mi |
| 72385 Beverly Way Rancho Mirage, CA | 2.0 | 2.0 | 1851 | $2,500 | $1.35 | 18d | 1 | 1.02mi |
| 8 Las Cruces Ln Palm Desert, CA | 2.0 | 2.0 | 1705 | $5,000 | $2.93 | 43d | 1 | 1.08mi |
| 195 Desert Lakes Dr Rancho Mirage, CA | 2.0 | 2.0 | 2465 | $6,000 | $2.43 | 43d | 1 | 1.09mi |
HOA detail
- Monthly dues
- $400 · $4,800/yr
Listing history 10 events
-
2026-06-10status $275,000 Pending 22 DOM
-
2026-06-09days on market $275,000 Active Under Contract 22 DOM
-
2026-06-08days on market $275,000 Active Under Contract 21 DOM
-
2026-06-07days on market $275,000 Active Under Contract 20 DOM
-
2026-06-04days on market $275,000 Active Under Contract 17 DOM
-
2026-06-03days on market $275,000 Active Under Contract 16 DOM
-
2026-06-02days on market $275,000 Active Under Contract 15 DOM
-
2026-06-01days on market $275,000 Active Under Contract 14 DOM
-
2026-05-31days on market $275,000 Active Under Contract 13 DOM
-
2026-05-18$275,000 Active
ⓘ Source: listings_history table (triggers on properties + properties_extension) + one-shot
backfill from property_details.listing_events for pre-trigger history.
Climate risk First Street
- Flood 1/10 Low FEMA zone X (unshaded) · 0% chance over 30 yrs
- Wildfire 1/10 Low
- Heat 9/10 Extreme 7 d/yr ≥114°F today · 18 d/yr by 30 yrs out
- Wind 1/10 Low
- Air quality 4/10 Moderate 5 unhealthy d/yr today · 7 by 30 yrs out
Nearby sold comps map
Loading sold comps map…
Walkable amenities ~0.75 mi
Loading nearby amenities…
Taxation est. · year 1
- Rental income
- $42,581
- − Mortgage interest
- −$15,404
- − Property taxes
- −$4,125
- − Insurance
- −$1,375
- − Repairs & maintenance
- −$3,406
- − Management
- −$3,406
- − HOA
- −$4,800
- − Depreciation
- −$8,000
- Taxable income
- $2,064
- Est. tax owed @ 24.0%
- −$495
- After-tax cash flow
- $5,538/yr
For passive investors: Depreciation is non-cash, so a rental often shows a tax loss while cash-flowing — sheltering income. Rental losses are passive: they offset passive income freely, and up to $25,000/yr can offset ordinary (W-2) income if you actively participate and your MAGI is under $100k (phasing out to $0 by $150k); unused losses carry forward. On sale, claimed depreciation is recaptured at up to 25%, and gains may owe capital-gains tax (a 1031 exchange can defer both). Figures are a year-1 estimate at your 24.0% rate — not tax advice; consult a CPA.
Condition & rehab AI · 18 photos
This home requires moderate repairs and maintenance, particularly in the kitchen, bathrooms, and flooring. Fresh paint and updates to these areas can significantly increase its value.
Repairs flagged
- Major Paint — Paint appears faded and needs repainting
- Major Kitchen — No photos of kitchen
- Major Bathrooms — No photos of bathrooms
- Major Flooring — No photos of flooring
Value-add opportunities
- Resale Paint — Fresh paint can enhance curb appeal and home value
- Resale Kitchen and Bathrooms — Upgraded kitchens and bathrooms can significantly increase home value
- Resale Flooring — New flooring can improve the overall look and feel of the home
Renovation cost estimate screening
| Repair item | Severity | Est. cost |
|---|---|---|
| Paint · Paint appears faded and needs repainting | Major | $15,000–50,000 |
| Kitchen · No photos of kitchen | Major | $15,000–50,000 |
| Bathrooms · No photos of bathrooms | Major | $15,000–50,000 |
| Flooring · No photos of flooring | Major | $15,000–50,000 |
| Total estimated repair cost · 4 items | $60,000–200,000 |
Value-add ROI direction
- Resale Paint — Fresh paint can enhance curb appeal and home value ↑
- Resale Kitchen and Bathrooms — Upgraded kitchens and bathrooms can significantly increase home value ↑
- Resale Flooring — New flooring can improve the overall look and feel of the home ↑
ⓘ Cost ranges are severity-bucket heuristics (US national rule-of-thumb). Get contractor quotes + a written scope before underwriting a rehab budget.
Schools (NCES district)
- District
- Desert Sands Unified
- NCES district ID
- 0611110
- Math proficiency
- 31% ▼ -4.00%
- Reading proficiency
- 56% ▲ 7.00%
- Median HH income
- $54,957
- Composite
- 37.77/100
- National rank
- #4346
- State rank
- #199 of 517 in CA
Livability — Palm Desert
- Score
- 51/100
- State rank
- #1050
- US rank
- #25164
Category grades
Schools grade is shown separately in the Schools card above.
Census & demographics
- Census place
- Palm Desert, CA
- County
- Riverside County · 2,287,001 people
- City population
- 58,615
- Metro
- Riverside-San Bernardino-Ontario, CA
- Population (ZIP)
- 30,523
- Household income
- $70,091
- Rent vs Own
- Severe rent burden
- 1734.0
Population outlook (Riverside County) Hauer SSP2
- Today (2025)
- 2,664,475 people
- By 2030
- 2,802,692 · +5.2%
- By 2040
- 3,050,904 · +14.5%
- By 2050
- 3,256,783 · +22.2%
- By 2075
- 3,655,058 · +37.2%
- By 2100
- 3,766,594 · +41.4%
Race, ethnicity, and origin ACS 2023
- Neighborhood character
- Majority White (61%)
- Race & ethnicity
- White 61% Hispanic / Latino 31% Two or more races 20% Asian 4% Black 2%
- Hispanic origin (detail)
- Mexican 25%
- Common ancestry
- Italian 4% Lithuanian 3% Slovak 2%
- Foreign-born
- 18% · Canada, South Korea, Vietnam
- Languages at home
- 73% English-only · Spanish 22% French/Haitian/Cajun 1% Other Indo-European 1%
Political lean MEDSL · Riverside
- 2024 margin
- Toss-up / Even · D 48.0% · R 49.3% · Other 2.6%
- 2008→2024 swing
- -3.6pp toward R · 2008: 2.3pp · 2024: -1.3pp
- All cycles
- 2024: R+1.3 2020: D+8.0 2016: D+4.3 2012: R+0.4 2008: D+2.3
Not yet ingested
- Civics
- —
Market trends
- HPI YoY
- ▼ -364.94%
- Current HPI
- 294.9425
- Rent YoY
- ▲ 1.60%
- Metro
- Riverside-San Bernardino-Ontario, CA
- State GDP YoY
- ▲ 3.21%
- F500 in state
- 116
Industry mix (Fortune 500 HQ in CA)
| Industry | F500 HQs | Revenue |
|---|---|---|
| Technology | 27 | $1,492B |
|
||
| Financial Services | 3 | $174B |
|
||
| Retail | 3 | $44B |
|
||
| Insurance | 3 | $26B |
|
||
| Media / Entertainment | 2 | $115B |
|
||
| Pharmaceuticals / Biotech | 2 | $62B |
|
||
Price history
1 event — show timeline
- 2026-05-18 Listed $275,000 GPSMLS
Cash-flow waterfall
monthlySold comps — $/sqft
last 12 mo · ≤1 miLoading sold comps…