106 W Laburnum Ave · Richmond, VA
Flood risk 1/10 · Minimal
- FEMA flood zone
- X (unshaded)
- Chance of flooding over 30 yrs
- 0.0%
- Est. flood insurance / yr
- $507 – $1,088
Fire risk 1/10 · Minimal
- Est. fire insurance / yr
- $666 – $1,236
Heat risk 8/10 · Major
- Hot days now (above 105°F)
- 7 days/yr
- Hot days in 30 yrs
- 17 days/yr
Wind risk 6/10 · Moderate
- Chance of severe wind over 30 yrs
- 27.0%
Air-quality risk 2/10 · Minimal
- Unhealthy air days now
- 1 days/yr
- Unhealthy air days in 30 yrs
- 3 days/yr
Risk factors via First Street. Map © Google.
Why this score? — see what drove the C- grade
The composite is a weighted blend of 9 inputs, each scored 0–100. Each bar is that input's sub-score; the figure is the points it added to the 100-point composite (weight × sub-score).
- ARV discount +15.0/15.0
- Cash flow +13.0/30.0
- Schools +4.9/10.0
- Rent growth +4.4/5.0
- Livability +4.2/5.0
- DSCR +3.9/10.0
- 1% rule +2.7/10.0
- Condition / age +2.5/5.0
- Appreciation +0.0/10.0
$225,000
🖨 Deal sheet (PDF) 📄 Offer letter ✓ Due diligence
Listing remarks MLS
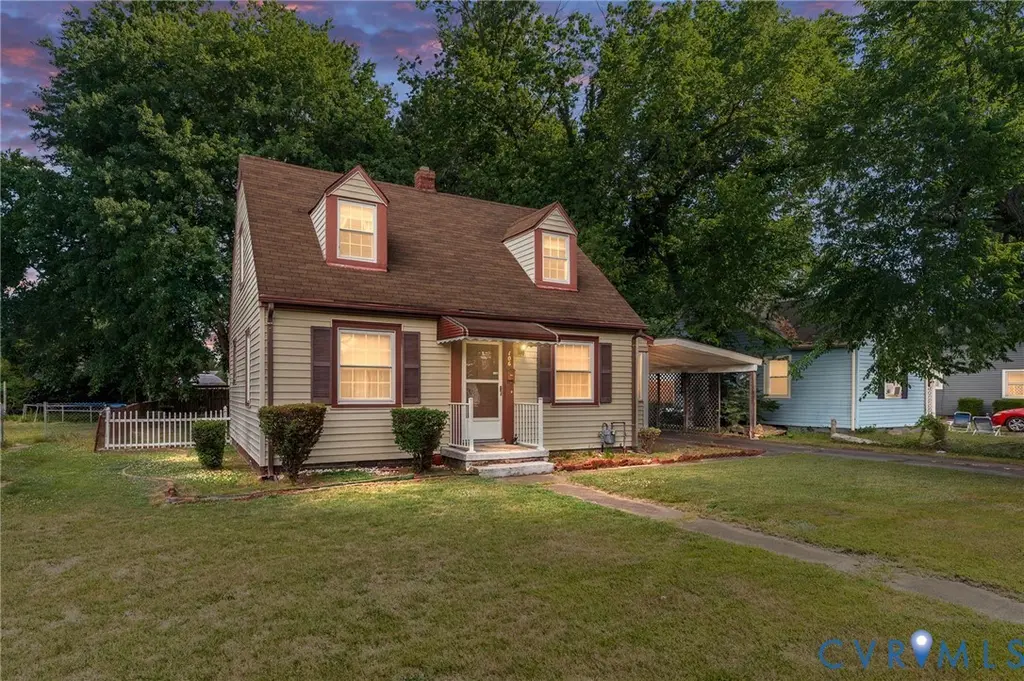
2-bedroom, 1-bath cape-style home offering approximately 1,176 square feet of living space in Richmond’s Northside area. Features include a functional layout, carport parking, and a spacious yard. Conveniently located near major highways, shopping, dining, and downtown Richmond. Property conveys AS IS. Refrigerator and detached shed convey AS IS.
Key facts
- 8,890 sq ft lot
- Parking
- Built 1947
Property features AI
Exterior
- Parking: Carport
- Utilities: Public water; Public sewer
- Home design: Single-story; Resale property; Aluminum and vinyl siding with drywall and frame construction; Asphalt/composition roof
- Construction: Aluminum siding; Vinyl siding; Frame construction; Drywall interior; Asphalt/composition roof
- Exterior features: Porch; Enclosed four-seasons (Florida) room; Storage shed(s); Fenced backyard
Interior
- Kitchen: Gas cooking; Oven; Refrigerator
- Bedrooms: Bedroom on second level
- Flooring: Tile; Vinyl; Wood
- Bathrooms: One full bathroom with tub and shower (second level)
- Heating & cooling: Heat pump heating (electric); Central electric air conditioning
- Interior features: Ceiling fan(s); Dining area; Laminate counters
- Laundry & utility: Electric water heater
Neighborhood map
What this means for you Summary
Snapshot
- This is a 3-bed/1.0-bath single-family listed at $225k.
Deal economics
- At list price, monthly cash flow is $-11 ($-130/yr) — negative.
- To cash-flow at today's rent, offer at most $223k (0.9% below list).
- To meet the 1% rule (rent ≥ 1% of price), the offer needs to be $174k (22.8% below list).
- Recommended offer: $174k (22.8% below list) — sets the bar for 1% rule.
- Cap rate 6.2% vs local median 3.2% in Richmond — top-decile yield for the area; either an underpriced asset or a hidden risk that comps aren't pricing in. Stress-test before assuming the spread holds.
Location & tenants
- Location reads 84/100 on livability (#33 in VA, #793 nationally) — a professional / high-income tenant draw. Strengths: amenities A+, commute A+, health & safety A+; Watch: crime D-.
- Henrico County Public School District (suburban): math 49% / reading 64% proficiency, ranked #68 of 131 in VA (top 52%) — acceptable for families but not a draw, mixed tenant base, ~2y average lease.
- Zoned schools: Laburnum Elementary (math 12% / reading 27%, grade F, #1,089 of 1,108 statewide, top 99%, 456 students, 88% FRL); L. Douglas Wilder Middle (math 47% / reading 51%, grade C-, #238 of 342 statewide, top 71%, 761 students, 89% FRL); Henrico High (math 44% / reading 74%, grade C+, #256 of 319 statewide, top 81%, 1,348 students, 86% FRL) — zoned schools average 88% FRL vs 34% district-wide (54 pts higher); higher-poverty schools than district average — tighter screening recommended.
- Zoned-school proficiency averages 42% at this address vs 56% district-wide (-14 pts) — the specific schools serving this property underperform the Henrico County Public School District average; the district grade overstates school quality for this exact location.
- Market conditions: Rents rising fast (+7.4%/yr); 185 active listings in the ZIP; 33 comparable units currently listed for rent nearby; rentals at typical pace (median 26d on market — plan ~3-4 weeks tenant-placement turnaround); 42% of comp listings sitting > 30 days — soft ceiling on asking rent; 1,826 units permitted in Henrico County in 2024 (785 in 5+ unit buildings).
Forward outlook
- Local home prices are declining (-3.0%/yr); year-one equity from $2k of loan paydown is wiped out by about $7k of value loss. Plan a longer hold.
- Henrico County population projected at +21% by 2050 — long-run rental-demand tailwind backs the buy-and-hold thesis.
Negotiation context
- It's been on market 32 days — a 3% lower offer ($218k) is reasonable based on typical stale-listing flexibility.
- 2 sale attempts with the ask held roughly flat each time — persistent listings suggest the price (not the market) is what's stuck; bring a comps-based counter.
- Current owner paid $23k; list at $225k implies a 866% gain — meaningful room to come down on a strong offer.
Risks & watch-outs
- Watch-outs: built in 1947 — expect roof / HVAC / electrical / plumbing capex.
- Climate carrying-cost: major wind risk, 27% chance of damaging wind over 30y; extreme-heat days projected 7→17/yr by 2055 (HVAC capex compounding) — expect insurance premiums to compound above CPI over the hold.
Questions for the listing agent
- What do current leases actually rent for vs. the listed asking? Can we see a recent rent roll and the last 12 months of T-12 income?
- It's been on market 32 days. Have you received any prior offers? Is the seller open to a 23% concession, seller financing, or rate buy-down credit?
- Built in 1947 — when were the roof, HVAC, electrical panel, plumbing, and water heater last replaced?
- Is there a deadline driving the sale (1031 exchange, divorce, estate, relocation)? That informs how much negotiation room exists.
- Schools are A-rated — typically a magnet for longer-tenancy family renters. What's the average tenant stay here, and is there a school-zone premium baked into asking?
- Crime grade is D in this area — have there been break-ins, vandalism, or insurance claims at this property in the last 3 years? What carrier currently insures it and at what premium?
- What's the average days-on-market for RENTAL listings here right now (not sales)? A rising rental-DOM trend means longer vacancies and softer asking-rent achievability than the comps imply.
- What's the recent tenant-quality profile in this submarket — average credit score on applications, eviction rate, late-payment / NSF rate, and stable-employment percentage? A property-management company in the area should have these aggregated.
- How much new for-sale + rental construction is in the pipeline within 1–3 miles? Heavy new supply typically softens prices + rents 12–24 months out; constrained supply supports both.
Investment metrics
- 1% rule
- 0.77% ✗
- Cap rate
- 6.24%
- Cash-on-cash
- -0.21%
- DSCR
- 0.99
- GRM
- 10.8
CMA / ARV
- ARV (on-the-fly)
- $274,008
- Comps found
- 12
Show comp detail 12 sales within ~0.75 mi
| Address | Dist | Beds/Ba | Sqft | Sold | Price | $/sf | Match |
|---|---|---|---|---|---|---|---|
| 3914 Alma Ave | 0.12mi | 3/1.5 | 1,236 (+5%) | 3mo | $167,500 | $136 | 81 |
| 103 E Laburnum Ave | 0.21mi | 4/1.0 (+1) | 1,189 (+1%) | 3mo | $199,000 | $167 | 81 |
| 107 N Chatham Dr | 0.19mi | 3/1.0 | 1,240 (+5%) | 8mo | $235,000 | $190 | 76 |
| 3906 Alma Ave | 0.08mi | 4/2.0 (+1) | 1,260 (+7%) | 2mo | $275,000 | $218 | 74 |
| 4111 Corbin St | 0.41mi | 3/1.5 | 1,152 (-2%) | 2mo | $305,000 | $265 | 74 |
| 3512 Fendall Ave | 0.30mi | 2/1.0 (-1) | 1,088 (-8%) | 1mo | $157,000 | $144 | 68 |
| 43 Loudon St | 0.38mi | 3/2.5 | 1,200 (+2%) | 7mo | $295,000 | $246 | 67 |
| 802 Cheatwood Ave | 0.53mi | 3/1.0 | 1,128 (-4%) | 6mo | $330,000 | $293 | 63 |
| 3226 Cliff Ave | 0.72mi | 3/1.0 | 1,194 (+2%) | 3mo | $156,000 | $131 | 62 |
| 3407 Garland Ave | 0.49mi | 2/1.0 (-1) | 1,242 (+6%) | 2mo | $301,500 | $243 | 61 |
| 450 Patrick Ave | 0.65mi | 3/2.5 | 1,239 (+5%) | 4mo | $320,000 | $258 | 51 |
| 505 Fayette Ave | 0.60mi | 2/1.0 (-1) | 1,053 (-10%) | 8mo | $245,000 | $233 | 43 |
Match score weights: distance 35% · size 25% · config 20% · recency 20%. Top-matched comps best support the ARV.
Projected returns pro-forma
-3.0% appreciation · 7.43% rent growth · sell at horizon
- IRR
- -12.3%
- Equity multiple
- 0.54×
- Total profit
- $-29,143
- Equity at exit
- $33,548
- IRR
- 1.9%
- Equity multiple
- 1.16×
- Total profit
- $9,775
- Equity at exit
- $19,454
Cash invested: $63,000 (down + closing). Projections, not guarantees.
Landlord ↔ Tenant lean methodology
- Overall (STATE)
- 55 Moderately Landlord-Leaning
- State Virginia
- 55 Moderately Landlord-Leaning · D+2
- County
- — inherits STATE
- City
- — inherits STATE
ZIP-level market 23222
- Rents YoY
- 7.4%
- Active inventory
- 185
- Price-to-rent
- 10.8×
Monthly cashflow live
- Estimated rent
- $1,737 high interval (Pro) →
- Mortgage (P&I)
- −$1,180
- Tax from tax record
- −$109 /mo · $1,310/yr
- Insurance
- −$94
- HOA
- −$0
- Vacancy / Maint / Mgmt
- −$365
- Net cashflow
- $-11
Break-even live
Sensitivity live
| Price | -10% $117 | -5% $53 | +0% $-11 | +5% $-75 | +10% $-138 |
|---|---|---|---|---|---|
| Rent | -10% $-148 | -5% $-79 | +0% $-11 | +5% $58 | +10% $126 |
| Rate | -1.0pp $102 | -0.5pp $46 | base $-11 | +0.5pp $-69 | +1.0pp $-128 |
UW: 25.0% down · 7.5% · 30yr · 1.5% tax · 5.0% vac · 8.0% maint · 8.0% mgmt
Financing live
Cash to close
- Down payment
- $56,250
- Closing costs
- $6,750
- Reserves months
- —
- Total cash needed
- —
Loan-product check · same deal, 3 products live
Conventional
25% down · 7.5% · 30yr
- Down + closing
- —
- Monthly P&I
- —
- Monthly cashflow
- —
- DSCR
- —
- Eligible?
- —
Personal DTI + credit; lowest rate.
DSCR
20% down · 8.5% · 30yr
- Down + closing
- —
- Monthly P&I
- —
- Monthly cashflow
- —
- DSCR
- —
- Eligible?
- —
No personal income docs; deal must DSCR.
Hard money
10% down · 12.0% · 12mo
- Down + closing
- —
- Monthly P&I
- —
- Monthly cashflow
- —
- DSCR
- —
- Eligible?
- —
Short-term bridge; refi at stabilization.
Rent comps 33 comps
| Address | Beds | Baths | Sqft | Rent | $/sqft | DOM | Units | Dist |
|---|---|---|---|---|---|---|---|---|
| 3800 North Ave Richmond, VA | 3.0 | 1.0 | 1008 | $1,650 | $1.64 | 13d | 1 | 0.19mi |
| 106 Trafton St Richmond, VA | 2.0 | 1.0 | 720 | $1,600 | $2.22 | 4d | 1 | 0.24mi |
| 106 Trafton St Richmond, VA | 2.0 | 1.0 | 720 | $1,600 | $2.22 | 19d | 1 | 0.24mi |
| 3600 Moss Side Ave Unit B Richmond, VA | 2.0 | 1.0 | 800 | $2,195 | $2.74 | 45d | 1 | 0.40mi |
| 3716 Delmont St Richmond, VA | 2.0 | 2.0 | 890 | $1,122 | $1.26 | 45d | 1 | 0.42mi |
| 401 Winston St Richmond, VA | 2.0 | 1.0 | 784 | $1,250 | $1.59 | 3d | 15 | 0.55mi |
| 3510 Chamberlayne Ave Apt S Richmond, VA | 2.0 | 1.0 | 849 | $1,175 | $1.38 | 25d | 1 | 0.66mi |
| 3810 Chamberlayne Ave Unit G Richmond, VA | 2.0 | 1.0 | 750 | $1,095 | $1.46 | 19d | 1 | 0.68mi |
| 3810 Chamberlayne Ave Unit B Richmond, VA | 2.0 | 1.0 | 850 | $1,095 | $1.29 | 45d | 1 | 0.68mi |
| 3303 Branch Ave Richmond, VA | 3.0 | 1.0 | 800 | $1,300 | $1.62 | 45d | 1 | 0.71mi |
| 3501 Meadowbridge Rd Richmond, VA | 3.0 | 1.0 | 1383 | $1,495 | $1.08 | 21d | 1 | 0.81mi |
| 3501 Meadowbridge Rd Richmond, VA | 3.0 | 1.0 | 1383 | $1,495 | $1.08 | 25d | 1 | 0.81mi |
| 3909 Patrick Ave Richmond, VA | 3.0 | 1.5 | 1200 | $2,650 | $2.21 | 45d | 1 | 0.93mi |
| 622 Pollock St Richmond, VA | 3.0 | 1.5 | 1122 | $2,300 | $2.05 | 25d | 1 | 0.95mi |
| 2922 Noble Ave Unit A Richmond, VA | 2.0 | 1.0 | 1200 | $1,499 | $1.25 | 6d | 1 | 0.97mi |
| 3200 Brook Rd Richmond, VA | 1.0–2.0 | 1.0–2.5 | 968 | $2,633 | $2.72 | 3d | 20 | 0.99mi |
| 2807 Edgewood Ave Richmond, VA | 3.0 | 1.0 | 1320 | $1,750 | $1.33 | 45d | 1 | 1.09mi |
| 3211 Maryland Ave Richmond, VA | 4.0 | 1.5 | 1344 | $1,871 | $1.39 | 45d | 1 | 1.12mi |
| 3117 Meadowbridge Rd Richmond, VA | 2.0 | 1.0 | 887 | $1,225 | $1.38 | 45d | 1 | 1.14mi |
| 3418 Carolina Ave Unit A Richmond, VA | 2.0 | 1.0 | 1000 | $1,524 | $1.52 | 45d | 1 | 1.16mi |
| 3425 Carolina Ave Unit A Richmond, VA | 3.0 | 1.0 | 1300 | $1,400 | $1.08 | 45d | 1 | 1.19mi |
| 3425 Carolina Ave Unit B Richmond, VA | 3.0 | 1.0 | 1300 | $1,400 | $1.08 | 25d | 1 | 1.19mi |
| 4812 Chamberlayne Ave Unit 2 Richmond, VA | 2.0 | 1.0 | 720 | $1,325 | $1.84 | 19d | 1 | 1.19mi |
| 2806 Hawthorne Ave Unit 1 Richmond, VA | 2.0 | 1.0 | 1144 | $1,400 | $1.22 | 45d | 1 | 1.19mi |
| 4903 Chamberlayne Ave #1 Richmond, VA | 2.0 | 1.0 | 780 | $1,150 | $1.47 | 45d | 1 | 1.28mi |
| 3621 Enslow Ave Richmond, VA | 2.0 | 1.5 | 1232 | $2,850 | $2.31 | 25d | 1 | 1.29mi |
| 3202 1st Ave Richmond, VA | 3.0 | 2.5 | 1440 | $2,062 | $1.43 | 23d | 1 | 1.30mi |
| 2420 Barton Ave Apt 2 Richmond, VA | 2.0 | 1.0 | 900 | $1,150 | $1.28 | 25d | 1 | 1.36mi |
| 835 Winnetka Ave Richmond, VA | 3.0 | 1.5 | 980 | $1,775 | $1.81 | 25d | 1 | 1.37mi |
| 2416 Barton Ave Apt 2 Richmond, VA | 2.0 | 1.0 | 1000 | $1,150 | $1.15 | 45d | 1 | 1.38mi |
| 628 Windomere Ave Richmond, VA | 1.0–2.0 | 1.0–1.5 | 750 | $1,685 | $2.25 | 3d | 6 | 1.42mi |
| 2400 Barton Ave Richmond, VA | 2.0 | 1.0 | 813 | $1,245 | $1.53 | 6d | 2 | 1.43mi |
| 2810 2nd Ave Richmond, VA | 2.0 | 1.0 | 1120 | $1,950 | $1.74 | 45d | 1 | 1.47mi |
Listing history 18 events
-
2026-06-21days on market $225,000 Active 32 DOM
-
2026-06-18days on market $225,000 Active 29 DOM
-
2026-06-17days on market $225,000 Active 28 DOM
-
2026-06-16days on market $225,000 Active 27 DOM
-
2026-06-15days on market $225,000 Active 26 DOM
-
2026-06-13days on market $225,000 Active 24 DOM
-
2026-06-09days on market $225,000 Active 20 DOM
-
2026-06-08days on market $225,000 Active 19 DOM
-
2026-06-07days on market $225,000 Active 18 DOM
-
2026-06-05days on market $225,000 Active 15 DOM
-
2026-06-03days on market $225,000 Active 14 DOM
-
2026-06-02days on market $225,000 Active 13 DOM
-
2026-06-01days on market $225,000 Active 12 DOM
-
2026-05-31days on market $225,000 Active 11 DOM
-
2026-05-21$225,000 Active 354-char remark
Show marketing remark (354 chars)
2-bedroom, 1-bath cape-style home offering approximately 1,176 square feet of living space in Richmond’s Northside area. Features include a functional layout, carport parking, and a spacious yard. Conveniently located near major highways, shopping, dining, and downtown Richmond. Property conveys AS IS. Refrigerator and detached shed convey AS IS.
-
2026-05-21$225,000 Active
Show marketing remark (354 chars)
2-bedroom, 1-bath cape-style home offering approximately 1,176 square feet of living space in Richmond’s Northside area. Features include a functional layout, carport parking, and a spacious yard. Conveniently located near major highways, shopping, dining, and downtown Richmond. Property conveys AS IS. Refrigerator and detached shed convey AS IS.
-
2026-05-18historical $225,000
-
1977-02-01soldstatus $23,300
ⓘ Source: listings_history table (triggers on properties + properties_extension) + one-shot
backfill from property_details.listing_events for pre-trigger history.
Tax reassessment forecast VA · Resets to sale price
- Current annual tax
- $1,310 · $109/mo
- Projected year-2 tax
- $1,845 · $154/mo
- Expected delta
- +$535/yr (+$45/mo · 40.9%)
ⓘ Screening estimate from a state-policy table — verify with the county assessor before closing.
Climate risk First Street
- Flood 1/10 Low FEMA zone X (unshaded) · 0% chance over 30 yrs
- Wildfire 1/10 Low
- Heat 8/10 Severe 7 d/yr ≥105°F today · 17 d/yr by 30 yrs out
- Wind 6/10 Major 27% chance of damaging wind over 30 yrs
- Air quality 2/10 Low 1 unhealthy d/yr today · 3 by 30 yrs out
Nearby sold comps map
Loading sold comps map…
Walkable amenities ~0.75 mi
Loading nearby amenities…
Taxation est. · year 1
- Rental income
- $20,840
- − Mortgage interest
- −$12,603
- − Property taxes
- −$1,310
- − Insurance
- −$1,125
- − Repairs & maintenance
- −$1,667
- − Management
- −$1,667
- − Depreciation
- −$6,545
- Taxable loss
- −$4,078
- Est. tax savings @ 24.0%
- +$979
- After-tax cash flow
- $849/yr
For passive investors: Depreciation is non-cash, so a rental often shows a tax loss while cash-flowing — sheltering income. Rental losses are passive: they offset passive income freely, and up to $25,000/yr can offset ordinary (W-2) income if you actively participate and your MAGI is under $100k (phasing out to $0 by $150k); unused losses carry forward. On sale, claimed depreciation is recaptured at up to 25%, and gains may owe capital-gains tax (a 1031 exchange can defer both). Figures are a year-1 estimate at your 24.0% rate — not tax advice; consult a CPA.
Schools (NCES district)
- District
- Henrico County Public School District
- NCES district ID
- 5101890
- Math proficiency
- 49% ▼ -32.00%
- Reading proficiency
- 64% ▼ -12.00%
- Median HH income
- $61,854
- Composite
- 49.25/100
- National rank
- #2031
- State rank
- #68 of 131 in VA
Livability — Richmond
- Score
- 84/100
- State rank
- #33
- US rank
- #793
Category grades
Schools grade is shown separately in the Schools card above.
Census & demographics
- County
- Richmond City · 178,280 people
- City population
- 287,109
- Metro
- Richmond, VA
- Population (ZIP)
- 26,322
- Household income
- $61,345
- Rent vs Own
- Severe rent burden
- 1325.0
Population outlook (Henrico County) Hauer SSP2
- Today (2025)
- 365,885 people
- By 2030
- 384,255 · +5.0%
- By 2040
- 416,688 · +13.9%
- By 2050
- 442,376 · +20.9%
- By 2075
- 488,037 · +33.4%
- By 2100
- 487,430 · +33.2%
Race, ethnicity, and origin ACS 2023
- Neighborhood character
- Predominantly Black (70%)
- Race & ethnicity
- Black 70% White 21% Two or more races 4% Hispanic / Latino 3% Asian 2%
- Common ancestry
- Lithuanian 1% Italian 1% Serbian 1%
- Foreign-born
- 5% · Canada
- Languages at home
- 95% English-only · Spanish 2% Other Indo-European 1%
Political lean MEDSL · Henrico
- 2024 margin
- Strong D (+28.9) · D 63.7% · R 34.8% · Other 1.5%
- 2008→2024 swing
- +16.6pp toward D · 2008: 12.2pp · 2024: 28.9pp
- All cycles
- 2024: D+28.9 2020: D+29.0 2016: D+21.0 2012: D+11.7 2008: D+12.2
Not yet ingested
- Civics
- —
Market trends
- HPI YoY
- ▼ -288.72%
- Current HPI
- 428.4029
- Rent YoY
- ▲ 7.43%
- Metro
- Richmond, VA
- State GDP YoY
- ▲ 2.40%
- F500 in state
- 50
Industry mix (Fortune 500 HQ in VA)
| Industry | F500 HQs | Revenue |
|---|---|---|
| Aerospace / Defense | 4 | $236B |
|
||
| Technology / Defense | 3 | $32B |
|
||
| Financial Services | 2 | $176B |
|
||
| Utilities | 2 | $27B |
|
||
| Insurance | 2 | $25B |
|
||
| Technology | 2 | $15B |
|
||
Price history
+865.7% since first listed4 events — show timeline
- 2026-05-21 Listed $225,000 WMLS
- 2026-05-21 Listed $225,000 CVRMLS
- 2026-05-18 Coming Soon $225,000 CVRMLS
- 1977-02-01 Sold (Public Records) $23,300 Public Records
Property tax history
+7.2%/yrLatest (2025): $1,310 · +11.2% YoY. Source: county tax records.
Cash-flow waterfall
monthlySold comps — $/sqft
last 12 mo · ≤1 miLoading sold comps…