18145 Soledad Canyon Rd #44 · Santa Clarita, CA
Flood risk 1/10 · Minimal
- FEMA flood zone
- X (unshaded)
- Chance of flooding over 30 yrs
- 0.0%
- Est. flood insurance / yr
- $507 – $1,088
Fire risk 8/10 · Major
- Est. fire insurance / yr
- $659 – $1,223
Heat risk 7/10 · Major
- Hot days now (above 98°F)
- 7 days/yr
- Hot days in 30 yrs
- 20 days/yr
Wind risk 1/10 · Minimal
- Chance of severe wind over 30 yrs
- —
Air-quality risk 8/10 · Major
- Unhealthy air days now
- 18 days/yr
- Unhealthy air days in 30 yrs
- 21 days/yr
Risk factors via First Street. Map © Google.
Why this score? — see what drove the B- grade
The composite is a weighted blend of 9 inputs, each scored 0–100. Each bar is that input's sub-score; the figure is the points it added to the 100-point composite (weight × sub-score).
- Cash flow +30.0/30.0
- DSCR +10.0/10.0
- 1% rule +9.3/10.0
- Schools +5.9/10.0
- Condition / age +4.0/5.0
- Rent growth +3.5/5.0
- Livability +3.5/5.0
- ARV discount +0.0/15.0
- Appreciation +0.0/10.0
$199,900
🖨 Deal sheet 📄 Offer letter ✓ Due diligence
Listing remarks
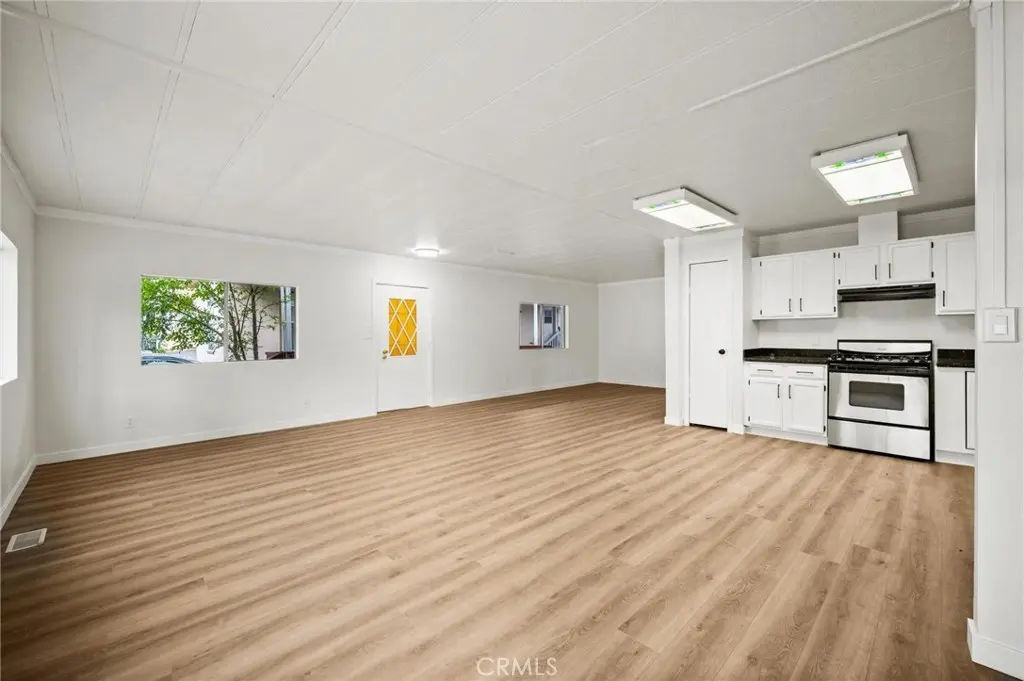
Spacious and inviting mobile home featuring an open floor plan and numerous recent updates throughout. Improvements include new laminate flooring, refinished and repainted kitchen cabinets, and updated fixtures that give the home a clean, refreshed feel. The oversized laundry room offers excellent flexibility and is nearly large enough to function as a small office or bonus space. Outside, you'll find a spacious parking area, a fenced rear area with two separate gates, and two storage sheds included with the sale. Residents can also enjoy access to the community pool. Conveniently located in a community with low park dues for the area, offering exceptional value and affordability.
Key facts
- Open floor plan
- Fenced rear area
- Updated fixtures
Tags
Property features AI
Finance
- Other: Assessed living area source: assessor's data; Elevation measured in feet
- HOA & community: Land lease in place; Land lease $1,100 per month (seller-provided amount); Rent includes trash, pool, water, and sewer
Exterior
- Parking: Attached carport with 2 parking spaces
- Utilities: Public/district water; Public sewer (connected)
- Home design: Double-wide mobile home (24' x 52'); Mobile home remains on site; Single-story; Located in Royal Oaks Mobile Home Park
- Construction: Built year per assessor; Remodeled/updated
- Exterior features: Back yard; Association pool; Two sheds; Has a view; Located in a suburban community
Interior
- Kitchen: Refrigerator; Freezer; Dishwasher
- Flooring: Laminate flooring
- Bathrooms: One full bathroom; One 3/4 bathroom; Upgraded bathroom finishes
- Heating & cooling: Central furnace; Cooling available (see remarks)
- Interior features: One-level home; Ground-level entry; Updated/remodeled condition; Laundry room
- Laundry & utility: Dedicated laundry room
Neighborhood map
What this means for you Summary
Snapshot
- This is a 2-bed/2.0-bath manufactured listed at $200k. Condition is rated good.
Deal economics
- At list price, monthly cash flow is $880 ($11k/yr) — positive.
- The deal already cash-flows at list — no discount required.
- Meets the 1% rule at list price ($3k rent vs $200k).
- Recommended offer: $197k (1.5% below list) — sets the bar for market timing.
- Cap rate 11.6% vs local median 2.8% in Santa Clarita — top-decile yield for the area; either an underpriced asset or a hidden risk that comps aren't pricing in. Stress-test before assuming the spread holds.
Location & tenants
- Location reads 70/100 on livability (#229 in CA) — a middle-class / working-renter tenant base. Strengths: employment A+, housing A, crime A-; Watch: amenities D+, cost of living F, health & safety F.
- William S. Hart Union High (suburban): math 52% / reading 72% proficiency, ranked #155 of 1,400 in CA (top 11%) — acceptable for families but not a draw, mixed tenant base, ~2y average lease; only 18% free/reduced lunch — higher-income household profile.
- Market conditions: Rents rising (+3.8%/yr); 149 active listings in the ZIP; 31 comparable units currently listed for rent nearby; rentals leasing fast (median 2d on market — plan ~1-2 weeks tenant-placement turnaround); high-income renter base; 19,697 units permitted in Los Angeles County in 2024 (9,426 in 5+ unit buildings).
Forward outlook
- Local home prices are declining (-3.0%/yr); year-one equity from $1k of loan paydown is wiped out by about $6k of value loss. Plan a longer hold.
- Los Angeles County population projected at +9% by 2050 — modest demand growth; plan on rents tracking national, not racing it.
- At projected returns (-3.0% appreciation + 3.8% rent growth), your $56k cash investment doubles in ~7 years — after that, you're playing with house money.
Negotiation context
- It's been on market 22 days — a 2% lower offer ($197k) is reasonable based on typical stale-listing flexibility.
Risks & watch-outs
- Climate carrying-cost: severe wildfire risk; extreme-heat days projected 7→20/yr by 2055 (HVAC capex compounding) — expect insurance premiums to compound above CPI over the hold.
Questions for the listing agent
- Is there a deadline driving the sale (1031 exchange, divorce, estate, relocation)? That informs how much negotiation room exists.
- Schools are B-rated — typically a magnet for longer-tenancy family renters. What's the average tenant stay here, and is there a school-zone premium baked into asking?
- What's the average days-on-market for RENTAL listings here right now (not sales)? A rising rental-DOM trend means longer vacancies and softer asking-rent achievability than the comps imply.
- What's the recent tenant-quality profile in this submarket — average credit score on applications, eviction rate, late-payment / NSF rate, and stable-employment percentage? A property-management company in the area should have these aggregated.
- How much new for-sale + rental construction is in the pipeline within 1–3 miles? Heavy new supply typically softens prices + rents 12–24 months out; constrained supply supports both.
Investment metrics
- 1% rule
- 1.43% ✓
- Cap rate
- 11.58%
- Cash-on-cash
- 18.87%
- DSCR
- 1.84
- GRM
- 5.8
CMA / ARV
- ARV (on-the-fly)
- $143,520
- Comps found
- 4
Show comp detail 4 sales within ~0.75 mi
| Address | Dist | Beds/Ba | Sqft | Sold | Price | $/sf | Match |
|---|---|---|---|---|---|---|---|
| 18145 Soledad Canyon Rd #73 | 0.00mi | 3/2.0 (+1) | 1,344 (+8%) | 9mo | $295,000 | $219 | 75 |
| 18540 Soledad Canyon Rd #53 | 0.54mi | 3/2.0 (+1) | 1,344 (+8%) | 2mo | $111,000 | $83 | 56 |
| 18540 Soledad Canyon Rd #109 | 0.54mi | 3/2.0 (+1) | 1,344 (+8%) | 12mo | $155,000 | $115 | 47 |
| 18540 Soledad Canyon Rd #21 | 0.54mi | 3/2.0 (+1) | 1,144 (-8%) | 15mo | $105,000 | $92 | 44 |
Match score weights: distance 35% · size 25% · config 20% · recency 20%. Top-matched comps best support the ARV.
Projected returns pro-forma
-3.0% appreciation · 3.81% rent growth · sell at horizon
- IRR
- 11.6%
- Equity multiple
- 1.47×
- Total profit
- $26,052
- Equity at exit
- $29,806
- IRR
- 21.3%
- Equity multiple
- 2.87×
- Total profit
- $104,844
- Equity at exit
- $17,284
Cash invested: $55,972 (down + closing). Projections, not guarantees.
Landlord ↔ Tenant lean methodology
- Overall (STATE)
- 18 Strongly Tenant-Friendly
- State California
- 18 Strongly Tenant-Friendly · D+13
- County
- — inherits STATE
- City
- — inherits STATE
ZIP-level market 91387
- Rents YoY
- 3.8%
- Active inventory
- 149
- Price-to-rent
- 5.8×
Monthly cashflow live
- Estimated rent
- $2,863 high interval (Pro) →
- Mortgage (P&I)
- −$1,048
- Tax est. 1.5%
- −$250 /mo · $2,998/yr
- Insurance
- −$83
- HOA
- −$0
- Vacancy / Maint / Mgmt
- −$601
- Net cashflow
- $880
Break-even live
UW: 25.0% down · 7.5% · 30yr · 1.5% tax · 5.0% vac · 8.0% maint · 8.0% mgmt
Financing live
Cash to close
- Down payment
- $49,975
- Closing costs
- $5,997
- Reserves months
- —
- Total cash needed
- —
Loan-product check · same deal, 3 products live
Conventional
25% down · 7.5% · 30yr
- Down + closing
- —
- Monthly P&I
- —
- Monthly cashflow
- —
- DSCR
- —
- Eligible?
- —
Personal DTI + credit; lowest rate.
DSCR
20% down · 8.5% · 30yr
- Down + closing
- —
- Monthly P&I
- —
- Monthly cashflow
- —
- DSCR
- —
- Eligible?
- —
No personal income docs; deal must DSCR.
Hard money
10% down · 12.0% · 12mo
- Down + closing
- —
- Monthly P&I
- —
- Monthly cashflow
- —
- DSCR
- —
- Eligible?
- —
Short-term bridge; refi at stabilization.
Rent comps 31 comps
| Address | Beds | Baths | Sqft | Rent | $/sqft | DOM | Units | Dist |
|---|---|---|---|---|---|---|---|---|
| 27940 Solamint Rd Canyon Country, CA | 1.0–2.0 | 1.0–2.0 | 859 | $3,974 | $4.62 | 1d | 5 | 0.10mi |
| 18008 Saratoga Way #513 Canyon Country, CA | 1.0 | 1.0 | 934 | $1,050 | $1.12 | 1d | 1 | 0.17mi |
| 18028 Saratoga Way #557 Canyon Country, CA | 2.0 | 2.0 | 843 | $2,900 | $3.44 | 1d | 1 | 0.21mi |
| 27944 Tyler Ln #448 Canyon Country, CA | 2.0 | 2.0 | 848 | $2,295 | $2.71 | 1d | 1 | 0.24mi |
| 17954 River Cir Canyon Country, CA | 3.0 | 3.0 | 1225 | $2,995 | $2.44 | 1d | 1 | 0.30mi |
| 28015 Sarabande Ln Santa Clarita, CA | 2.0 | 2.0 | 885 | $2,850 | $3.22 | 1d | 1 | 0.34mi |
| 18209 Sierra Hwy #17 Canyon Country, CA | 2.0 | 2.0 | 795 | $2,500 | $3.14 | 10d | 1 | 0.39mi |
| 18209 Sierra Hwy #40 Canyon Country, CA | 2.0 | 2.0 | 795 | $2,350 | $2.96 | 1d | 1 | 0.39mi |
| 18046 Beneda Ln Unit B203 Santa Clarita, CA | 1.0 | 1.0 | 756 | $1,900 | $2.51 | 10d | 1 | 0.40mi |
| 27520 Sierra Hwy Canyon Country, CA | 1.0–3.0 | 1.0–2.0 | 965 | $2,502 | $2.59 | 1d | 1 | 0.40mi |
| 18005 Annes Cir Canyon Country, CA | 1.0–3.0 | 1.0–2.5 | 979 | $2,954 | $3.02 | 1d | 10 | 0.46mi |
| 27303 Sara St Canyon Country, CA | 1.0–3.0 | 1.0–2.0 | 838 | $2,402 | $2.86 | 1d | 6 | 0.49mi |
| 17621 Pauline Ct Canyon Country, CA | 2.0–3.0 | 2.5 | 1200 | $2,539 | $2.12 | 1d | 8 | 0.51mi |
| Jakes Way Santa Clarita, CA | 1.0–2.0 | 1.0–2.0 | 830 | $2,640 | $3.18 | 1d | 20 | 0.62mi |
| 17740 Scherzinger Ln Canyon Country, CA | 2.0 | 2.0 | 825 | $2,150 | $2.61 | 1d | 2 | 0.63mi |
| 17350 Humphreys Pkwy Canyon Country, CA | 1.0–3.0 | 1.0–2.0 | 1009 | $3,248 | $3.22 | 1d | 65 | 0.69mi |
| 18135 Erik Ct Canyon Country, CA | 3.0 | 2.0 | 1155 | $3,200 | $2.77 | 1d | 1 | 0.77mi |
| 18211 Flynn Dr #144 Canyon Country, CA | 2.0 | 2.0 | 1085 | $2,700 | $2.49 | 1d | 1 | 0.80mi |
| 18804 Mandan St #807 Canyon Country, CA | 2.0 | 2.0 | 860 | $2,600 | $3.02 | 1d | 1 | 0.83mi |
| 27105 Silver Oak Ln Canyon Country, CA | 1.0–3.0 | 1.0–2.0 | 1021 | $3,070 | $3.01 | 1d | 25 | 0.89mi |
| 17581 Scherzinger Ln Canyon Country, CA | 2.0 | 1.0 | 800 | $2,380 | $2.98 | 3d | 1 | 0.94mi |
| 17947 Lost Canyon Rd Canyon Country, CA | 2.0 | 2.0 | 1022 | $2,795 | $2.73 | 17d | 1 | 0.99mi |
| 27070 Hidaway Ave #4 Canyon Country, CA | 2.0 | 1.5 | 1078 | $3,200 | $2.97 | 3d | 1 | 1.06mi |
| 19028 Drycliff St Unit C Canyon Country, CA | 3.0 | 1.5 | 982 | $3,600 | $3.67 | 3d | 1 | 1.07mi |
| 17991 Lost Canyon Rd Canyon Country, CA | 3.0 | 2.0 | 1280 | $3,225 | $2.52 | 15d | 1 | 1.10mi |
| 27077 Hidaway Ave Canyon Country, CA | 2.0 | 1.0 | 960 | $2,400 | $2.50 | 1d | 1 | 1.17mi |
| 28136 Bakerton Ave Canyon Country, CA | 3.0 | 2.0 | 1400 | $3,800 | $2.71 | 7d | 1 | 1.26mi |
| 27301 Whites Canyon Rd Canyon Country, CA | 2.0 | 2.0 | 900 | $1,995 | $2.22 | 17d | 2 | 1.33mi |
| 26827 Circle of the Oaks Newhall, CA | 2.0 | 2.0 | 1254 | $2,550 | $2.03 | 10d | 1 | 1.34mi |
| 18742 Vista Del Canon Santa Clarita, CA | 3.0 | 2.0 | 1132 | $2,800 | $2.47 | 1d | 1 | 1.37mi |
| 28085 Whites Canyon Rd Canyon Country, CA | 1.0–2.0 | 1.0–2.0 | 714 | $2,100 | $2.94 | 1d | 7 | 1.43mi |
Listing history 15 events
-
2026-06-18days on market $199,900 Active 22 DOM
-
2026-06-17pricedays on market $199,900 Active 21 DOM
-
2026-06-16days on market $250,000 Active 20 DOM
-
2026-06-15days on market $250,000 Active 19 DOM
-
2026-06-13days on market $250,000 Active 17 DOM
-
2026-06-13days on market $250,000 Active 16 DOM
-
2026-06-09days on market $250,000 Active 13 DOM
-
2026-06-08days on market $250,000 Active 12 DOM
-
2026-06-07days on market $250,000 Active 11 DOM
-
2026-06-04days on market $250,000 Active 8 DOM
-
2026-06-03days on market $250,000 Active 7 DOM
-
2026-06-02days on market $250,000 Active 6 DOM
-
2026-06-01days on market $250,000 Active 5 DOM
-
2026-05-31days on market $250,000 Active 4 DOM
-
2026-05-27$250,000 Active
ⓘ Source: listings_history table (triggers on properties + properties_extension) + one-shot
backfill from property_details.listing_events for pre-trigger history.
Climate risk First Street
- Flood 1/10 Low FEMA zone X (unshaded) · 0% chance over 30 yrs
- Wildfire 8/10 Severe
- Heat 7/10 Severe 7 d/yr ≥98°F today · 20 d/yr by 30 yrs out
- Wind 1/10 Low
- Air quality 8/10 Severe 18 unhealthy d/yr today · 21 by 30 yrs out
Nearby sold comps map
Loading sold comps map…
Walkable amenities ~0.75 mi
Loading nearby amenities…
Taxation est. · year 1
- Rental income
- $34,352
- − Mortgage interest
- −$11,198
- − Property taxes
- −$2,998
- − Insurance
- −$1,000
- − Repairs & maintenance
- −$2,748
- − Management
- −$2,748
- − Depreciation
- −$5,815
- Taxable income
- $7,845
- Est. tax owed @ 24.0%
- −$1,883
- After-tax cash flow
- $8,678/yr
For passive investors: Depreciation is non-cash, so a rental often shows a tax loss while cash-flowing — sheltering income. Rental losses are passive: they offset passive income freely, and up to $25,000/yr can offset ordinary (W-2) income if you actively participate and your MAGI is under $100k (phasing out to $0 by $150k); unused losses carry forward. On sale, claimed depreciation is recaptured at up to 25%, and gains may owe capital-gains tax (a 1031 exchange can defer both). Figures are a year-1 estimate at your 24.0% rate — not tax advice; consult a CPA.
Condition & rehab AI · 12 photos
This mobile home is in good condition with recent updates, making it move-in ready and suitable for both resale and rental.
Value-add opportunities
- Both paint exterior — enhances curb appeal and value
- Both landscaping — improves curb appeal and rental value
- Both install smart home features — attracts tech-savvy buyers and renters
Renovation cost estimate screening
Value-add ROI direction
- Both paint exterior — enhances curb appeal and value ↑
- Both landscaping — improves curb appeal and rental value ↑
- Both install smart home features — attracts tech-savvy buyers and renters ↑
ⓘ Cost ranges are severity-bucket heuristics (US national rule-of-thumb). Get contractor quotes + a written scope before underwriting a rehab budget.
Schools (NCES district)
- District
- William S. Hart Union High
- NCES district ID
- 0642510
- Math proficiency
- 52% ▬ 0.00%
- Reading proficiency
- 72% ▲ 1.00%
- Median HH income
- $95,844
- Composite
- 58.6/100
- National rank
- #2030
- State rank
- #155 of 1400 in CA
Livability — Santa Clarita
- Score
- 70/100
- State rank
- #229
- US rank
- #7378
Category grades
Schools grade is shown separately in the Schools card above.
Census & demographics
- Census place
- Santa Clarita, CA
- County
- Los Angeles County · 9,444,647 people
- City population
- 219,066
- Metro
- Los Angeles-Long Beach-Anaheim, CA
- Population (ZIP)
- 46,869
- Household income
- $117,969
- Rent vs Own
- Severe rent burden
- 1332.0
Population outlook (Los Angeles County) Hauer SSP2
- Today (2025)
- 10,940,515 people
- By 2030
- 11,256,481 · +2.9%
- By 2040
- 11,729,929 · +7.2%
- By 2050
- 11,948,407 · +9.2%
- By 2075
- 11,818,114 · +8.0%
- By 2100
- 10,842,928 · -0.9%
Race, ethnicity, and origin ACS 2023
- Neighborhood character
- Diverse neighborhood (Simpson 0.67)
- Race & ethnicity
- Hispanic / Latino 43% White 36% Two or more races 20% Asian 10% Black 6% Native American 1%
- Hispanic origin (detail)
- Mexican 29%
- Common ancestry
- Italian 2% Romanian 1% Lithuanian 1%
- Foreign-born
- 24% · Canada, South Korea, Vietnam
- Languages at home
- 58% English-only · Spanish 30% Tagalog/Filipino 3% Other Indo-European 3%
Political lean MEDSL · Los Angeles
- 2024 margin
- Solid D (+32.9) · D 64.8% · R 31.9% · Other 3.3%
- 2008→2024 swing
- -7.4pp toward R · 2008: 40.4pp · 2024: 32.9pp
- All cycles
- 2024: D+32.9 2020: D+44.2 2016: D+48.0 2012: D+40.0 2008: D+40.4
Not yet ingested
- Civics
- —
Market trends
- HPI YoY
- ▼ -441.37%
- Current HPI
- 322.2238
- Rent YoY
- ▲ 3.81%
- Metro
- Los Angeles-Long Beach-Anaheim, CA
- State GDP YoY
- ▲ 3.21%
- F500 in state
- 116
Industry mix (Fortune 500 HQ in CA)
| Industry | F500 HQs | Revenue |
|---|---|---|
| Technology | 27 | $1,492B |
|
||
| Financial Services | 3 | $174B |
|
||
| Retail | 3 | $44B |
|
||
| Insurance | 3 | $26B |
|
||
| Media / Entertainment | 2 | $115B |
|
||
| Pharmaceuticals / Biotech | 2 | $62B |
|
||
Price history
1 event — show timeline
- 2026-05-27 Listed $250,000 CRMLS
Property tax history
+6.5%/yrLatest (2025): $385 · +6.5% YoY. Source: county tax records.
Cash-flow waterfall
monthlySold comps — $/sqft
last 12 mo · ≤1 miLoading sold comps…