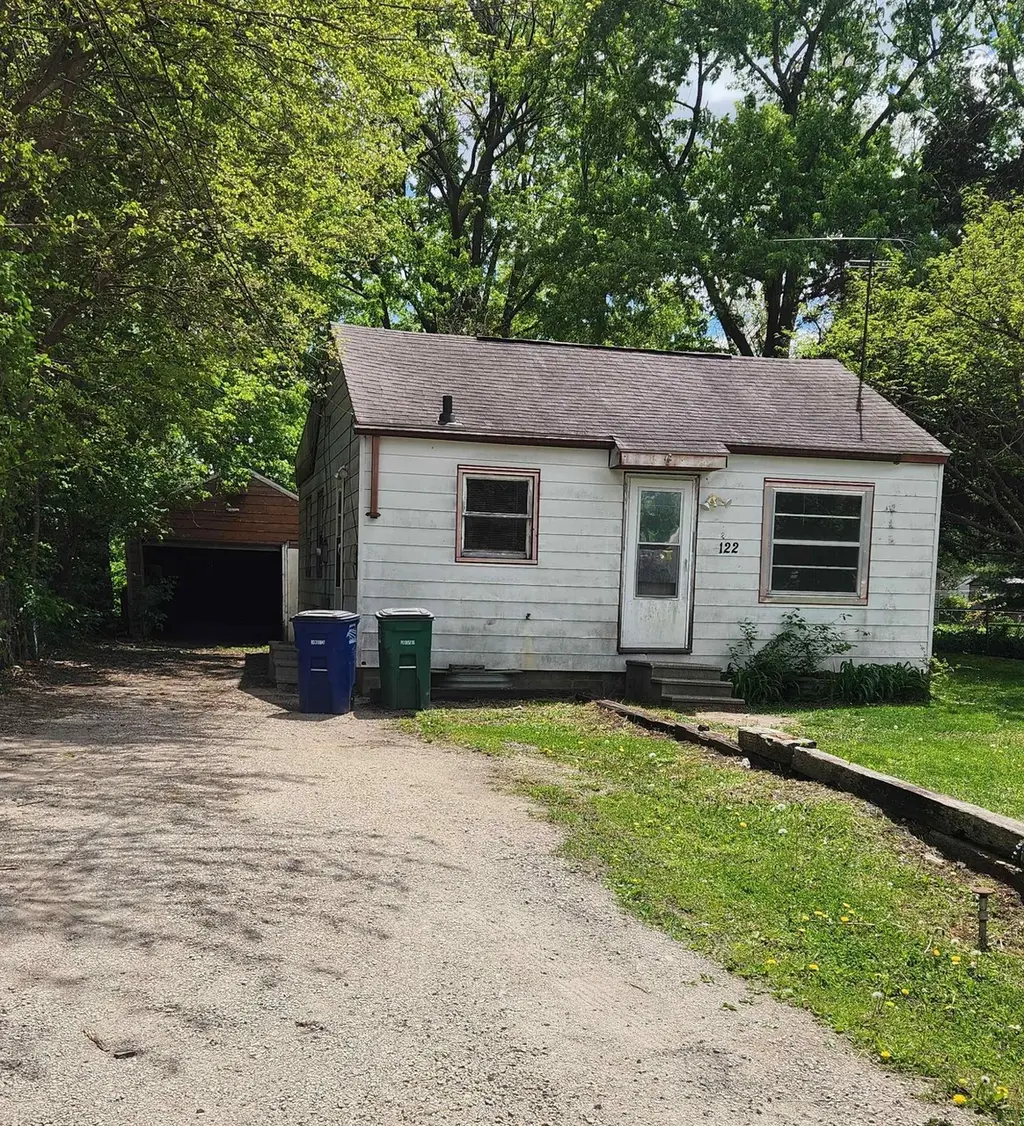
122 Doyle Ave · Evansdale, IA
Flood risk 1/10 · Minimal
- FEMA flood zone
- X
- Chance of flooding over 30 yrs
- 0.0%
- Est. flood insurance / yr
- $473 – $860
Fire risk 1/10 · Minimal
- Est. fire insurance / yr
- $902 – $1,676
Heat risk 3/10 · Minor
- Hot days now (above 101°F)
- 7 days/yr
- Hot days in 30 yrs
- 15 days/yr
Wind risk 2/10 · Minimal
- Chance of severe wind over 30 yrs
- —
Air-quality risk 1/10 · Minimal
- Unhealthy air days now
- 0 days/yr
- Unhealthy air days in 30 yrs
- 0 days/yr
Risk factors via First Street. Map © Google.
Why this score? — see what drove the B grade
The composite is a weighted blend of 9 inputs, each scored 0–100. Each bar is that input's sub-score; the figure is the points it added to the 100-point composite (weight × sub-score).
- Cash flow +30.0/30.0
- 1% rule +10.0/10.0
- DSCR +10.0/10.0
- ARV discount +7.5/15.0
- Schools +4.4/10.0
- Livability +3.4/5.0
- Rent growth +2.5/5.0
- Condition / age +2.5/5.0
- Appreciation +0.0/10.0
$35,000
🖨 Deal sheet 📄 Offer letter ✓ Due diligence
Listing remarks
Three Bedroom, One Bath Home with a full basement that is priced below assessed value. It has a nice sized back yard with a single stall garage. This property is a great opportunity for investors, or someone looking to put work into it to add to their rental property portfolio.
Key facts
- Back yard
- Single stall garage
- Full basement
Tags
Property features AI
Exterior
- Parking: Detached carport; 1 carport space
- Utilities: Public water; Public sewer
- Home design: Single-family residence; Residential property; Zoning: R-2
- Construction: Aluminum siding; Shingle roof; Basement: unfinished block, interior entry, sump pump
- Exterior features: Gravel road access
Interior
- Kitchen: Free-standing range; Refrigerator; Vented exhaust fan
- Bathrooms: 1 full bathroom
- Heating & cooling: Natural gas heating; Exhaust fan ventilation; No central cooling
- Interior features: Eat-in kitchen
- Laundry & utility: Laundry on lower level; Gas water heater
Neighborhood map
What this means for you Summary
Snapshot
- This is a 3-bed/1.0-bath single-family listed at $35k.
Deal economics
- At list price, monthly cash flow is $413 ($5k/yr) — positive.
- The deal already cash-flows at list — no discount required.
- Meets the 1% rule at list price ($882 rent vs $35k).
- Cap rate 20.4% vs local median 3.9% in Evansdale — top-decile yield for the area; either an underpriced asset or a hidden risk that comps aren't pricing in. Stress-test before assuming the spread holds.
Location & tenants
- Location reads 67/100 on livability (#487 in IA) — a middle-class / working-renter tenant base. Strengths: cost of living A+, housing A+, crime B+; Watch: employment D, amenities F, commute F.
- Waterloo Community School District (urban): math 50% / reading 54% proficiency, ranked #276 of 289 in IA (top 96%) — acceptable for families but not a draw, mixed tenant base, ~2y average lease.
- Zoned schools: Poyner Elementary (math 62% / reading 57%, grade B-, #390 of 616 statewide, top 69%, 362 students, 69% FRL); Bunger Middle School (math 48% / reading 47%, grade C-, #226 of 246 statewide, top 92%, 431 students, 75% FRL); East High School (math 39% / reading 58%, grade D, #317 of 336 statewide, top 94%, 1,022 students, 73% FRL).
- Market conditions: 64 active listings in the ZIP; 2 comparable units currently listed for rent nearby; 287 units permitted in Black Hawk County in 2024 (67 in 5+ unit buildings).
Forward outlook
- Local home prices are declining (-3.0%/yr); year-one equity from $242 of loan paydown is wiped out by about $1k of value loss. Plan a longer hold.
- Black Hawk County population projected at +10% by 2050 — modest demand growth; plan on rents tracking national, not racing it.
- At projected returns (-3.0% appreciation + 3.0% rent growth), your $10k cash investment doubles in ~3 years — after that, you're playing with house money.
Negotiation context
- Only 1 days on market — expect competitive offers; lowballing is unlikely to land.
Risks & watch-outs
- Watch-outs: property tax is 2.9% of price; built in 1950 — expect roof / HVAC / electrical / plumbing capex.
Questions for the listing agent
- Built in 1950 — when were the roof, HVAC, electrical panel, plumbing, and water heater last replaced?
- Property tax is high relative to price — has the assessment been appealed recently, and will the sale trigger a re-assessment?
- Is there a deadline driving the sale (1031 exchange, divorce, estate, relocation)? That informs how much negotiation room exists.
- What's the average days-on-market for RENTAL listings here right now (not sales)? A rising rental-DOM trend means longer vacancies and softer asking-rent achievability than the comps imply.
- What's the recent tenant-quality profile in this submarket — average credit score on applications, eviction rate, late-payment / NSF rate, and stable-employment percentage? A property-management company in the area should have these aggregated.
- How much new for-sale + rental construction is in the pipeline within 1–3 miles? Heavy new supply typically softens prices + rents 12–24 months out; constrained supply supports both.
Investment metrics
- 1% rule
- 2.52% ✓
- Cap rate
- 20.45%
- Cash-on-cash
- 50.56%
- DSCR
- 3.25
- GRM
- 3.3
CMA / ARV
- ARV (on-the-fly)
- $105,840
- Comps found
- 12
Show comp detail 12 sales within ~0.75 mi
| Address | Dist | Beds/Ba | Sqft | Sold | Price | $/sf | Match |
|---|---|---|---|---|---|---|---|
| 815 Fox Avenue Ave | 0.10mi | 2/1.0 (-1) | 807 (+12%) | 1mo | $161,000 | $200 | 69 |
| 620 Brookside Ave | 0.14mi | 2/1.0 (-1) | 728 (+1%) | 23mo | $121,000 | $166 | 68 |
| 839 Home Acres | 0.10mi | 2/1.0 (-1) | 668 (-7%) | 16mo | $110,000 | $165 | 65 |
| 602 Home Acres Ave | 0.27mi | 2/1.0 (-1) | 704 (-2%) | 23mo | $65,000 | $92 | 59 |
| 611 East End Ave | 0.47mi | 2/1.0 (-1) | 660 (-8%) | 1mo | $68,000 | $103 | 58 |
| 1101 Brookside Ave | 0.61mi | 2/1.0 (-1) | 748 (+4%) | 6mo | $110,000 | $147 | 55 |
| 843 Evans Rd | 0.20mi | 2/1.0 (-1) | 672 (-7%) | 24mo | $78,000 | $116 | 55 |
| 602 East End Ave | 0.44mi | 2/1.0 (-1) | 768 (+7%) | 13mo | $114,500 | $149 | 52 |
| 226 Wema Ave | 0.43mi | 2/1.0 (-1) | 624 (-13%) | 8mo | $89,900 | $144 | 47 |
| 317 Evans Rd | 0.52mi | 2/1.0 (-1) | 766 (+6%) | 19mo | $113,000 | $148 | 44 |
| 1114 Lake Ave | 0.36mi | 2/1.0 (-1) | 616 (-14%) | 17mo | $85,000 | $138 | 40 |
| 455 Morrell Ave | 0.61mi | 2/1.0 (-1) | 616 (-14%) | 9mo | $37,400 | $61 | 35 |
Match score weights: distance 35% · size 25% · config 20% · recency 20%. Top-matched comps best support the ARV.
Projected returns pro-forma
-3.0% appreciation · 3.0% rent growth · sell at horizon
- IRR
- 48.4%
- Equity multiple
- 3.11×
- Total profit
- $20,663
- Equity at exit
- $5,219
- IRR
- 54.0%
- Equity multiple
- 6.31×
- Total profit
- $52,013
- Equity at exit
- $3,026
Cash invested: $9,800 (down + closing). Projections, not guarantees.
Landlord ↔ Tenant lean methodology
- Overall (STATE)
- 83 Strongly Landlord-Friendly
- State Iowa
- 83 Strongly Landlord-Friendly · R+6
- County
- — inherits STATE
- City
- — inherits STATE
ZIP-level market 50707
- Active inventory
- 64
- Price-to-rent
- 3.3×
Monthly cashflow live
- Estimated rent
- $882 medium interval (Pro) →
- Mortgage (P&I)
- −$184
- Tax from tax record
- −$86 /mo · $1,032/yr
- Insurance
- −$15
- HOA
- −$0
- Vacancy / Maint / Mgmt
- −$185
- Net cashflow
- $413
Break-even live
UW: 25.0% down · 7.5% · 30yr · 1.5% tax · 5.0% vac · 8.0% maint · 8.0% mgmt
Financing live
Cash to close
- Down payment
- $8,750
- Closing costs
- $1,050
- Reserves months
- —
- Total cash needed
- —
Loan-product check · same deal, 3 products live
Conventional
25% down · 7.5% · 30yr
- Down + closing
- —
- Monthly P&I
- —
- Monthly cashflow
- —
- DSCR
- —
- Eligible?
- —
Personal DTI + credit; lowest rate.
DSCR
20% down · 8.5% · 30yr
- Down + closing
- —
- Monthly P&I
- —
- Monthly cashflow
- —
- DSCR
- —
- Eligible?
- —
No personal income docs; deal must DSCR.
Hard money
10% down · 12.0% · 12mo
- Down + closing
- —
- Monthly P&I
- —
- Monthly cashflow
- —
- DSCR
- —
- Eligible?
- —
Short-term bridge; refi at stabilization.
Rent comps 2 comps
| Address | Beds | Baths | Sqft | Rent | $/sqft | DOM | Units | Dist |
|---|---|---|---|---|---|---|---|---|
| 850 Payne St Evansdale, IA | 2.0 | 1.0 | 640 | $900 | $1.41 | 43d | 1 | 0.22mi |
| 136 Earl St Evansdale, IA | 2.0 | 1.0 | 702 | $795 | $1.13 | 21d | 1 | 1.18mi |
Listing history 2 events
-
2026-05-12status Pending
-
2026-05-11$35,000 Active
ⓘ Source: listings_history table (triggers on properties + properties_extension) + one-shot
backfill from property_details.listing_events for pre-trigger history.
Tax reassessment forecast IA · Partial reset (capped growth)
- Current annual tax
- $1,032 · $86/mo
- Projected year-2 tax
- $1,032 · $86/mo
- Expected delta
- $0/yr ($0/mo · 0.0%)
ⓘ Screening estimate from a state-policy table — verify with the county assessor before closing.
Climate risk First Street
- Flood 1/10 Low FEMA zone X · 0% chance over 30 yrs
- Wildfire 1/10 Low
- Heat 3/10 Moderate 7 d/yr ≥101°F today · 15 d/yr by 30 yrs out
- Wind 2/10 Low
- Air quality 1/10 Low 0 unhealthy d/yr today · 0 by 30 yrs out
Nearby sold comps map
Loading sold comps map…
Walkable amenities ~0.75 mi
Loading nearby amenities…
Taxation est. · year 1
- Rental income
- $10,587
- − Mortgage interest
- −$1,961
- − Property taxes
- −$1,032
- − Insurance
- −$175
- − Repairs & maintenance
- −$847
- − Management
- −$847
- − Depreciation
- −$1,018
- Taxable income
- $4,708
- Est. tax owed @ 24.0%
- −$1,130
- After-tax cash flow
- $3,825/yr
For passive investors: Depreciation is non-cash, so a rental often shows a tax loss while cash-flowing — sheltering income. Rental losses are passive: they offset passive income freely, and up to $25,000/yr can offset ordinary (W-2) income if you actively participate and your MAGI is under $100k (phasing out to $0 by $150k); unused losses carry forward. On sale, claimed depreciation is recaptured at up to 25%, and gains may owe capital-gains tax (a 1031 exchange can defer both). Figures are a year-1 estimate at your 24.0% rate — not tax advice; consult a CPA.
Schools (NCES district)
- District
- Waterloo Community School District
- NCES district ID
- 1930480
- Math proficiency
- 50% ▼ -4.00%
- Reading proficiency
- 54% ▲ 1.00%
- Median HH income
- $42,545
- Composite
- 43.72/100
- National rank
- #2950
- State rank
- #276 of 289 in IA
Livability — Evansdale
- Score
- 67/100
- State rank
- #487
- US rank
- #10824
Category grades
Schools grade is shown separately in the Schools card above.
Census & demographics
- Census place
- Evansdale, IA
- City population
- 7,407
- Population (ZIP)
- 7,407
Population outlook (Black Hawk County) Hauer SSP2
- Today (2025)
- 139,716 people
- By 2030
- 142,853 · +2.2%
- By 2040
- 147,843 · +5.8%
- By 2050
- 153,247 · +9.7%
- By 2075
- 167,977 · +20.2%
- By 2100
- 177,320 · +26.9%
Race, ethnicity, and origin ACS 2023
- Neighborhood character
- Predominantly White (80%)
- Race & ethnicity
- White 80% Black 8% Hispanic / Latino 7% Two or more races 6%
- Hispanic origin (detail)
- Mexican 3%
- Common ancestry
- Portuguese 3% Iranian 2% Lithuanian 1%
- Foreign-born
- 1% · Canada
- Languages at home
- 95% English-only · Spanish 3%
Political lean MEDSL · Black Hawk
- 2024 margin
- Toss-up / Even · D 50.0% · R 48.8% · Other 1.2%
- 2008→2024 swing
- -21.3pp toward R · 2008: 22.4pp · 2024: 1.2pp
- All cycles
- 2024: D+1.2 2020: D+9.0 2016: D+7.3 2012: D+20.0 2008: D+22.4
Not yet ingested
- Civics
- —
Market trends
- HPI YoY
- ▼ -121.77%
- Current HPI
- 178.5926
- Rent YoY
- —
- Metro
- —
- State GDP YoY
- ▲ 2.48%
- F500 in state
- 4
Industry mix (Fortune 500 HQ in IA)
| Industry | F500 HQs | Revenue |
|---|---|---|
| Financial Services | 1 | $16B |
|
||
| Retail / Convenience | 1 | $15B |
|
||
Price history
2 events — show timeline
- 2026-05-12 Pending — NEIRBR as distributed by MLS GRID
- 2026-05-11 Listed $35,000 NEIRBR as distributed by MLS GRID
Property tax history
+2.2%/yrLatest (2025): $1,032 · +12.7% YoY. Source: county tax records.
Cash-flow waterfall
monthlySold comps — $/sqft
last 12 mo · ≤1 miLoading sold comps…